

Key Points
CSF1R inhibition reduces cell viability in >20% of AML patient samples and is expressed on a subpopulation of supportive cells.
CSF1R activation stimulates paracrine cytokine secretion (eg, HGF), suggesting that CSF1R is a novel target of AML support cells.

Abstract
To identify new therapeutic targets in acute myeloid leukemia (AML), we performed small-molecule and small-interfering RNA (siRNA) screens of primary AML patient samples. In 23% of samples, we found sensitivity to inhibition of colony-stimulating factor 1 (CSF1) receptor (CSF1R), a receptor tyrosine kinase responsible for survival, proliferation, and differentiation of myeloid-lineage cells. Sensitivity to CSF1R inhibitor GW-2580 was found preferentially in de novo and favorable-risk patients, and resistance to GW-2580 was associated with reduced overall survival. Using flow cytometry, we discovered that CSF1R is not expressed on the majority of leukemic blasts but instead on a subpopulation of supportive cells. Comparison of CSF1R-expressing cells in AML vs healthy donors by mass cytometry revealed expression of unique cell-surface markers. The quantity of CSF1R-expressing cells correlated with GW-2580 sensitivity. Exposure of primary AML patient samples to a panel of recombinant cytokines revealed that CSF1R inhibitor sensitivity correlated with a growth response to CSF1R ligand, CSF1, and other cytokines, including hepatocyte growth factor (HGF). The addition of CSF1 increased the secretion of HGF and other cytokines in conditioned media from AML patient samples, whereas adding GW-2580 reduced their secretion. In untreated cells, HGF levels correlated significantly with GW-2580 sensitivity. Finally, recombinant HGF and HS-5–conditioned media rescued cell viability after GW-2580 treatment in AML patient samples. Our results suggest that CSF1R-expressing cells support the bulk leukemia population through the secretion of HGF and other cytokines. This study identifies CSF1R as a novel therapeutic target of AML and provides a mechanism of paracrine cytokine/growth factor signaling in this disease.
Introduction
Acute myeloid leukemia (AML) is the deadliest hematological malignancy, with 10 670 estimated new deaths from the disease in the United States in 2018.1 One of the factors complicating AML treatment is its genetic heterogeneity, with hundreds of drivers collectively observed across AML patient tumors.2,3 The use of genetically targeted therapies to treat AML has produced some clinical responses, but the development of disease resistance and relapse remains a continuous problem, in part because of the presence of multiple genetic subclones of leukemia cells in each patient.4,5
To overcome the inherent genetic complexity of AML, researchers have investigated methods of targeting the supportive leukemia microenvironment.6 Indeed, the development of resistance in AML is driven by multiple factors, including external signals from the bone marrow microenvironment.7 Leukemia cells disrupt normal hematopoietic stem cell growth,8 and changes in the microenvironment are sufficient to induce leukemia or myelodysplastic syndromes.9 The modification and reprogramming of multiple cell types in the bone marrow niche have been shown to enhance AML tumor cell proliferation and survival, including mesenchymal stromal cells,10-12 osteoblasts,13,14 and T cells.15-17
In solid tumors, a key contributor to the microenvironment is supportive monocytes/macrophages, also known as tumor-associated macrophages (TAMs).18 TAMs express a variety of proteins, including colony-stimulating factor 1 receptor (CSF1R), which signals downstream through phosphatidylinositol 3-kinase/AKT and MEK/extracellular signal-regulated kinase and promotes cell proliferation and differentiation.19 There have been significant efforts to target and eliminate TAMs in solid tumors, and many ongoing clinical trials exist using CSF1R small-molecule inhibitors and monoclonal antibodies.20 More recently, the same phenomenon has been shown in multiple myeloma21 ; and, in chronic lymphocytic leukemia, targeting CSF1R-expressing nurse-like cells has shown efficacy in mouse models22,23 and ex vivo patient samples.24 Recently, it was shown in mouse models that AML induces an increase in monocytes/macrophages in the bone marrow and spleen that supports a protumorigenic microenvironment.25 However, the possibility of targeting and eliminating supportive cells using CSF1R inhibitors has never before been demonstrated in AML.
Using functional screening of ex vivo primary AML patient samples, we report for the first time that CSF1R signaling is essential for the survival of AML. CSF1R sensitivity is not confined to a particular clinical or genetic subtype, although it is less prevalent in patients with adverse risk features. Using mass cytometry (cytometry by time of flight [CyTOF]) and conventional, fluorescence-based flow cytometry, we found that CSF1R surface expression is confined to a small subpopulation of cells that show evidence of phenotypic reprogramming. Samples with CSF1R inhibitor sensitivity show increased response to growth factor stimulation, including CSF1, hepatocyte growth factor (HGF), and other cytokines, and secretion of HGF and other cytokines was directly modulated after stimulation or inhibition of CSF1R in sensitive samples. Finally, incubation with conditioned media or recombinant HGF significantly decreased GW-2580 sensitivity in patient samples.
These data indicate that CSF1R is a novel therapeutic target in AML, provide evidence for paracrine signaling from CSF1R-expressing supportive cells, and suggest that CSF1R small-molecule inhibitors would be broadly effective in treating AML.
Methods
Patient sample acquisition and functional screening
Primary AML samples were obtained from patients by informed consent according to a protocol approved by the Oregon Health & Science University Institutional Review Board, and processed as described previously.26,27
The half-maximal inhibitory concentration (IC50) and area under the curve (AUC) were determined for each sample using probit regression analysis (see supplemental Methods, available on the Blood Web site). Within each patient sample, a small-interfering RNA (siRNA) “hit” was identified if its cell viability was at least 2 standard deviations less than the mean computed across all siRNAs tested (z score ≤ −2).28,29
To evaluate apoptosis, mononuclear cells (MNCs) were exposed to either GW-2580 or ARRY-382 at 10 µM, and apoptosis was measured after 24, 48, and 72 hours by Annexin V staining (Guava Nexin assay; Merck Millipore, Billerica, MA). The percentage of apoptotic cells from untreated control wells was subtracted from the drug-exposed wells to accommodate sample-specific variation in overall cell viability.
Most of these samples originated from the Beat AML program, a collaborative, multi-institutional project that evaluated a cohort of 672 tumor specimens collected from 562 patients.30 For a complete list of the specific patient samples used across different experiments and figures, see supplemental Table 1.
Mass cytometry (CyTOF) and flow cytometry analysis of cell-surface markers
MNCs were isolated from primary AML patient samples and evaluated for a variety of cell-surface markers using mass spectrometry–based flow cytometry, as described previously.31
Flow cytometry was performed using Live/Dead Aqua (Thermo Fisher, Waltham, MA), CD45-PerCP (BioLegend, San Diego, CA), CD34-PE-CF594 (BD Biosciences, Franklin Lakes, NJ), and either CSF1R-APC (BioLegend) or CSF1R Alexa Fluor 488 (BioLegend), according to the manufacturer’s instructions (see supplemental Methods).
Cytokine/growth factor analysis
We analyzed data assessing cytokine growth response ex vivo in AML patient samples, as previously described.32 For each cytokine, the log2 fold change (mean AUC for responders divided by mean AUC for nonresponders) was calculated and an unpaired Student t test conducted to compare sensitivity to GW-2580 between these 2 groups.
Cytokine secretion in conditioned media
Primary AML patient samples were added to 12-well plates (1 mL at 1 × 10⁶ cells per well) and treated with 10 µM GW-2580, 100 ng/mL CSF1 (PeproTech, Rocky Hill, NJ), or remained untreated. The plates were incubated for 48 hours, after which the cells from each condition were centrifuged and the conditioned media were collected and flash-frozen in liquid nitrogen. The levels of cytokines, chemokines, and growth factors were measured using the Human Cytokine Magnetic 30-Plex panel for the Luminex platform (Thermo Fisher).
Cytokine rescue from GW-2580 sensitivity
Primary AML patient samples were exposed to GW-2580 according to our functional screening protocol (see supplemental Methods). Cells were incubated either with HGF (1µg/mL), the maximum concentration used in Carey et al,32 or conditioned media from the human marrow stromal cell line HS-533 at a 1:1 ratio with normal media. Cells were incubated for 3 days and viability was evaluated by colorimetric assay.
See supplemental Methods for additional details.
Results
To identify new therapeutic targets and effective drugs against AML, we performed functional screening on primary AML patient samples (Figure 1A). We screened MNCs from patient samples with small-molecule inhibitors, or an siRNA library targeting the human tyrosine kinome, and measured cell viability after short-term culture. We observed that the siRNA that significantly reduced cell viability in the largest number of samples among our filtered patient sample population (n = 158 or 162; see supplemental Methods) was siCSF1R (Figure 1B), the specificity of which has been validated previously.34

Ex vivo AML patient sample screen reveals that knockdown/inhibition of CSF1R reduces leukemia cell survival in >20% of samples. (A) Schematic of screening primary AML patient samples against small-molecule inhibitors and siRNAs against the tyrosine kinome to identify new therapeutic targets. (B) siRNA tyrosine kinome screen (n = 93 kinase siRNAs) identifies CSF1R as the top “hit” in primary AML patient samples (n = 158 or 162) to significantly reduce cell viability. (C) High degree of specificity among the CSF1R-targeted small-molecule inhibitors GW-2580, ARRY-382, and JNJ-28312141, compared with other class III receptor tyrosine kinases. Data from (1) Davis et al35 and (2) Wright et al.36 (D) Strong correlation observed between GW-2580 AUC and z score of the viability from siCSF1R compared with that of other tyrosine kinase siRNAs (n = 162 patient samples). Significance determined by Spearman rank correlation. (E) siCSF1R has the strongest correlation and most significant association with GW-2580 AUC in the siRNA tyrosine kinome screen. Slope of linear regression line calculated for each siRNA as indicated in panel D was plotted against the P value, determined by significance test for linear regression. (F) Profile of sensitivity to GW-2580 across the cohort of primary AML patient samples (n = 315). The relative positions of representative dose-response curves (G-H) are indicated. (G-H) Representative dose-response curves for a (G) sensitive and (H) nonsensitive primary AML patient sample to GW-2580.
Ex vivo AML patient sample screen reveals that knockdown/inhibition of CSF1R reduces leukemia cell survival in >20% of samples. (A) Schematic of screening primary AML patient samples against small-molecule inhibitors and siRNAs against the tyrosine kinome to identify new therapeutic targets. (B) siRNA tyrosine kinome screen (n = 93 kinase siRNAs) identifies CSF1R as the top “hit” in primary AML patient samples (n = 158 or 162) to significantly reduce cell viability. (C) High degree of specificity among the CSF1R-targeted small-molecule inhibitors GW-2580, ARRY-382, and JNJ-28312141, compared with other class III receptor tyrosine kinases. Data from (1) Davis et al35 and (2) Wright et al.36 (D) Strong correlation observed between GW-2580 AUC and z score of the viability from siCSF1R compared with that of other tyrosine kinase siRNAs (n = 162 patient samples). Significance determined by Spearman rank correlation. (E) siCSF1R has the strongest correlation and most significant association with GW-2580 AUC in the siRNA tyrosine kinome screen. Slope of linear regression line calculated for each siRNA as indicated in panel D was plotted against the P value, determined by significance test for linear regression. (F) Profile of sensitivity to GW-2580 across the cohort of primary AML patient samples (n = 315). The relative positions of representative dose-response curves (G-H) are indicated. (G-H) Representative dose-response curves for a (G) sensitive and (H) nonsensitive primary AML patient sample to GW-2580.
We next compared these siRNA screening results in samples that were also evaluated for sensitivity to CSF1R small-molecule inhibitors as a means of orthogonal validation. We chose 3 inhibitors with single-digit nanomolar sensitivity (by IC50) to CSF1R: GW-2580, ARRY-382, and JNJ-28312141 (Figure 1C). We confirmed that GW-2580 and ARRY-382, both of which have extreme specificity for CSF1R and have no interaction with other class III receptor tyrosine kinases,35,36 induce apoptosis in primary AML patient samples (supplemental Figure 1A-B). As a quality control check, we examined the sensitivity profiles of all 3 inhibitors across patient samples and observed a highly significant correlation for each pairwise comparison of inhibitors (supplemental Figure 1C-E). Notably, we did not observe GW-2580 sensitivity in MNCs isolated from 5 healthy donors (supplemental Figure 1F-J), which had also been observed previously,37 highlighting the unique therapeutic responsiveness of AML samples. Because GW-2580 had the highest specificity for CSF1R among the other inhibitors, it was used to exclusively represent CSF1R inhibitor activity in all subsequent experiments.
Upon comparing the CSF1R siRNA and small-molecule inhibitor data, we observed a significant correlation between the z score for siCSF1R and GW-2580 AUC, suggesting that siCSF1R efficacy (lower z score) correlates with greater sensitivity to GW-2580 (lower AUC) (Figure 1D). (Unless otherwise specified, drug sensitivity was quantified using AUC because of its effectiveness in combining drug potency and efficacy.38 ) To confirm that this correlation was specific for siCSF1R, we performed the same correlation calculation from Figure 1D for each tyrosine kinase siRNA, which includes all other class III receptor tyrosine kinase family members. We found that siCSF1R had the strongest, most significant correlation with GW-2580 sensitivity compared with all other siRNAs (Figure 1E), suggesting that CSF1R is the operational target underlying CSF1R inhibitor sensitivity. Collectively, our screening of 315 AML patient samples for sensitivity to GW-2580 (Figure 1F) revealed a wide range of responses, with many highly sensitive samples as well as samples that were completely resistant (Figure 1G-H).
To determine whether sensitivity to CSF1R inhibitors correlated with prominent genetic abnormalities or clinical characteristics found in patients with AML, we analyzed patient samples from the Beat AML cohort30 that had been subjected to small-molecule inhibitor screening, many of which had whole-exome sequencing and detailed clinical annotations (supplemental Table 2). We compared the distribution of GW-2580 sensitivity to demographic or clinical factors of disease (specimen type, age, sex, white blood cell count, and prognostic risk) and genetic factors (common translocations and mutations found in AML2 ) (Figure 2A). Overall, we found a significant association between CSF1R inhibitor resistance and poor prognostic markers, including cytogenetic abnormalities (complex karyotype, inversion 3, and monosomy 5/deletion 5q), gene mutations (TP53, NRAS, and KRAS), and European LeukemiaNet (ELN) adverse prognostic risk (Figure 2A; supplemental Figure 2A-C).
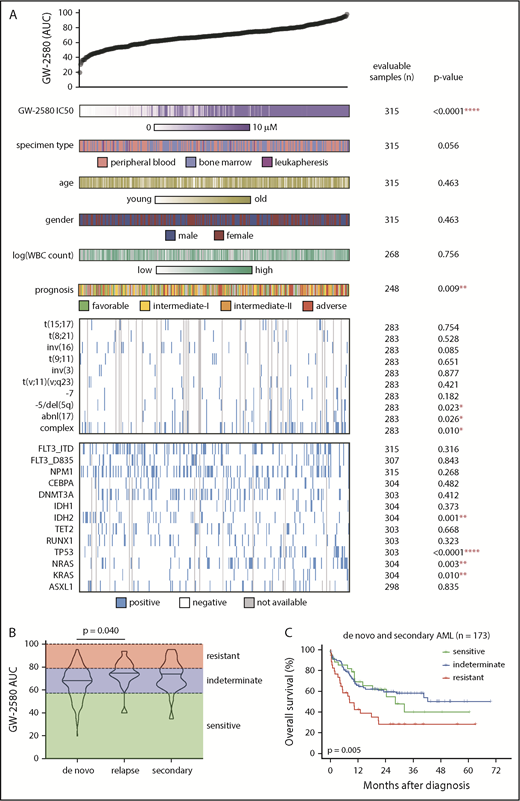
Resistance to CSF1R inhibitor is associated with adverse prognostic risk gene mutations and cytogenetic abnormalities. (A) GW-2580 AUC from primary AML patient samples (n = 315) was compared for a multitude of clinical and genetic characteristics, with number of samples with evaluable data and the P value listed for each characteristic. Prognostic risk was determined using the ELN guidelines for AML (see Döhner et al51 ). The presence/absence of translocations was determined from karyotype. Only translocations that were found in ≥2 patients were considered. Mutational data were collected by either targeted sequencing, whole-exome sequencing, or targeted polymerase chain reaction (PCR)-based methods (FLT3-ITD and NPM1). Significance was determined using either Mann-Whitney or Kruskal-Wallis tests (for categorical variables) or Spearman rank correlation (for continuous variables), and corrected for multiple comparisons if applicable. (B) GW-2580 AUC among the patient population with clinical data (n = 202 samples from 199 patients), subdivided into de novo (n = 158), secondary (n = 24), and relapsed (n = 20) AML disease presentation categories. Statistics were calculated on subdivided categories by the Kruskal-Wallis test with the Dunn multiple comparisons test. (C) Kaplan-Meier survival curve of patients with AML with both clinical and survival data (n = 173), grouped by the response of their corresponding ex vivo primary sample to GW-2580: sensitive (0-20th percentile), indeterminate (20th-80th), and resistant (80th-100th). P value obtained from the overall log-rank test.
Resistance to CSF1R inhibitor is associated with adverse prognostic risk gene mutations and cytogenetic abnormalities. (A) GW-2580 AUC from primary AML patient samples (n = 315) was compared for a multitude of clinical and genetic characteristics, with number of samples with evaluable data and the P value listed for each characteristic. Prognostic risk was determined using the ELN guidelines for AML (see Döhner et al51 ). The presence/absence of translocations was determined from karyotype. Only translocations that were found in ≥2 patients were considered. Mutational data were collected by either targeted sequencing, whole-exome sequencing, or targeted polymerase chain reaction (PCR)-based methods (FLT3-ITD and NPM1). Significance was determined using either Mann-Whitney or Kruskal-Wallis tests (for categorical variables) or Spearman rank correlation (for continuous variables), and corrected for multiple comparisons if applicable. (B) GW-2580 AUC among the patient population with clinical data (n = 202 samples from 199 patients), subdivided into de novo (n = 158), secondary (n = 24), and relapsed (n = 20) AML disease presentation categories. Statistics were calculated on subdivided categories by the Kruskal-Wallis test with the Dunn multiple comparisons test. (C) Kaplan-Meier survival curve of patients with AML with both clinical and survival data (n = 173), grouped by the response of their corresponding ex vivo primary sample to GW-2580: sensitive (0-20th percentile), indeterminate (20th-80th), and resistant (80th-100th). P value obtained from the overall log-rank test.
To evaluate the relationship between CSF1R inhibitor sensitivity and clinical response, we analyzed the patients with high-quality treatment data and GW-2580 functional screening data within our sample cohort (n = 202 samples from 199 patients). We subdivided this patient population based on disease presentation: de novo, secondary, and relapsed AML. We observed that the relapsed AML samples had a higher GW-2580 AUC than de novo AML samples (P = .040), whereas there was no difference between the GW-2580 AUC of secondary AML vs de novo AML (Figure 2B).
Next, we selected a subpopulation of patients from this cohort with survival data, excluding relapse patients (n = 173; supplemental Figure 3A; see supplemental Methods). We categorized CSF1R inhibitor sensitivity based on the GW-2580 AUC of each sample in this subpopulation: “sensitive” samples were below the 20th percentile, “indeterminate” samples between the 20th and 80th percentiles, and “resistant” samples above the 80th percentile. When comparing the Kaplan-Meier survival curves across these sensitivity groups, we observed a significant overall difference between them (P = .005; Figure 2C) as well as a significant pairwise difference between patients with “resistant” samples compared with patients with “sensitive” samples (unadjusted P = .035). These significant findings were not observed in the subpopulation of de novo AML patients (supplemental Figure 3B), but were for the secondary AML patients (overall P = .002, pairwise resistant vs sensitive unadjusted P = .005; supplemental Figure 3C).
Furthermore, when controlling for important clinical and genetic features in a multivariable Cox regression model, we found that “resistant” patients had significantly worse overall survival compared with “sensitive” patients (hazard ratio = 2.12; 95% confidence interval = 1.07-4.20; P = .030). When evaluating relapse-free survival among the eligible de novo and secondary AML patients who achieved remission, we observed a significant overall difference between the 3 sensitivity groups (P = .002; supplemental Figure 3D), as well as significant pairwise differences for “resistant” vs “sensitive” (unadjusted P = .009) and for “resistant” vs “indeterminate” (unadjusted P = .001).
We next wanted to understand the mechanism of action of CSF1R inhibitors in AML. Because CSF1R mutations are not observed in AML,2 and we did not observe any single genetic biomarker that could explain sensitivity to CSF1R inhibitors, we examined CSF1R expression patterns in AML patient samples. In healthy individuals, CSF1R cell-surface expression is found only on macrophages and committed macrophage precursor cells.39 This prompted us to determine whether CSF1R inhibitor sensitivity correlated with CSF1R expression on AML tumor cells or on healthy macrophage-lineage cells that might be interacting with the tumor cells. Therefore, we analyzed mass cytometry (CyTOF) data on the expression levels of 16 cell-surface markers, including CSF1R, on 66 AML patient samples and 11 healthy donors (Figure 3A) (methods reviewed in Lamble et al31 ; full data set in submission); we also conducted conventional flow cytometry on 4 patient samples.

CSF1R is expressed not on the bulk leukemia population in primary AML patient samples but on a small subpopulation of supportive cells. (A) Schematic diagram of CyTOF analysis to profile CSF1Rhi cells in primary AML patient samples. (B) Percentage of CSF1Rhi cells in primary samples from patients with AML (n = 66) and healthy donors (HD) (n = 11). (C) Correlation of the proportion of CSF1Rhi cells in primary AML patient samples with the sample’s response to GW-2580. Significance determined by Spearman rank test. (D-E) Representative CyTOF plots of CSF1R expression in primary AML patient samples that show (D) sensitivity and (E) resistance to GW-2580. (F-G) Violin plots of expression intensity of other cell-surface markers in CSF1Rhi cells from (F) AML patient and (G) healthy donor samples. (H) Cell-surface marker expression (median arcsinh) in CSF1Rhi cells for AML patient and healthy donor samples. (I) t-SNE analysis of CSF1R expression in cells isolated from primary AML patient sample (n = 66). (J) t-SNE analysis with labeled CSF1Rhi and non-CSF1Rhi cells in primary AML patient samples (n = 66) and healthy donors (n = 11).
CSF1R is expressed not on the bulk leukemia population in primary AML patient samples but on a small subpopulation of supportive cells. (A) Schematic diagram of CyTOF analysis to profile CSF1Rhi cells in primary AML patient samples. (B) Percentage of CSF1Rhi cells in primary samples from patients with AML (n = 66) and healthy donors (HD) (n = 11). (C) Correlation of the proportion of CSF1Rhi cells in primary AML patient samples with the sample’s response to GW-2580. Significance determined by Spearman rank test. (D-E) Representative CyTOF plots of CSF1R expression in primary AML patient samples that show (D) sensitivity and (E) resistance to GW-2580. (F-G) Violin plots of expression intensity of other cell-surface markers in CSF1Rhi cells from (F) AML patient and (G) healthy donor samples. (H) Cell-surface marker expression (median arcsinh) in CSF1Rhi cells for AML patient and healthy donor samples. (I) t-SNE analysis of CSF1R expression in cells isolated from primary AML patient sample (n = 66). (J) t-SNE analysis with labeled CSF1Rhi and non-CSF1Rhi cells in primary AML patient samples (n = 66) and healthy donors (n = 11).
Our initial examination of CSF1R expression using conventional flow cytometry, which allowed for traditional gating of leukemic blasts, revealed negligible expression of CSF1R on leukemic blasts (supplemental Figure 4). Using CyTOF data, we found that the percentage of CSF1Rhi cells (arcsinh ≥ 3) was relatively low throughout the AML patient data set (mean of 1.4% in total cells), and was comparable to that of the healthy donor samples (Figure 3B; supplemental Figure 5A). We observed no association between the percentage of CSF1Rhi cells and FMS-like tyrosine kinase-3 (FLT3)–internal tandem duplication (ITD) status or French-American-British morphology, although we did observe a trend of a higher percentage of CSF1R+ cells in monocytic subtypes of AML (eg, French-American-British M5) (supplemental Figure 5B-C). We investigated the relationship between the frequency of CSF1Rhi cells and CSF1R inhibitor sensitivity. We found an association between the overall percentage of CSF1Rhi cells and GW-2580 sensitivity (Figure 3C), with more sensitive samples having a higher percentage of CSF1Rhi cells than resistant samples (Figure 3D-E).
We further combined CSF1Rhi cells from every sample in our data set (separate combinations for AML and healthy donor samples) and subdivided the cells based on the coexpression of common hematopoietic population–defining cell-surface markers and markers associated with myeloid-derived suppressor cells40 (Figure 3A). CSF1Rhi cells most often coexpress myeloid-specific markers in patients with AML (Figure 3F) and healthy donors (Figure 3G), although AML CSF1Rhi cells were enriched for coexpression of HLA-DR and CD33 (and healthy donor CSF1Rhi cells predominantly coexpressed CD11c and CD16; Figure 3H), highlighting the phenotypic differences between the CSF1Rhi cells from both groups. When we subdivided the AML CSF1Rhi cells into the CSF1R inhibitor sensitivity subgroups of their corresponding patients, we found that HLA-DR and CD33 overexpression are enriched in CSF1Rhi cells from “sensitive” patients, whereas CD16 and CD66b expression are enriched in CSF1Rhi cells from “resistant” patients (supplemental Figure 8A-B). We observed minimal differences in cell-surface marker expression between CSF1Rhi cells from bone marrow aspirates and peripheral blood, although cells from the 1 leukapheresis sample showed comparatively less expression overall (supplemental Figure 8C). There was no difference in GW-2580 sensitivity across specimen types in this sample subset (supplemental Figure 8D).
To better characterize the origination of CSF1Rhi cells, we performed 2 separate experiments. First, we isolated CSF1R+ and CSF1R− cells from 2 primary AML patient samples using flow cytometry. We performed Sanger sequencing on each population for somatic mutations that had been previously identified in the patient’s tumor by targeted sequencing. For both samples, we observed the genetic mutation in the CSF1R+ population (supplemental Figure 6A-C), suggesting that CSF1Rhi cells could represent a tumor subpopulation and not reprogrammed normal cells. Second, we visualized the expression of CSF1R and other CyTOF markers across bulk cell populations using t-distributed stochastic neighbor embedding (t-SNE). Among AML cells, CSF1R expression exclusively defines a large, distinct cell subpopulation (Figure 3I), a characteristic not shared by other markers (supplemental Figure 7). Moreover, among AML and healthy donor cells, the CSF1Rhi cells from both groups do not overlap completely (Figure 3J), suggesting that AML CSF1Rhi cells are not phenotypically equivalent to those from healthy donors. These experiments indicate that CSF1Rhi cells could represent a subpopulation of tumor cells, although further experiments are needed to broadly confirm this finding in a large cohort of AML patients. Overall, these results suggest that CSF1Rhi cells in AML constitute a population of supportive cells that contribute to sensitivity to CSF1R inhibitors.
Next, we wanted to identify the cytokines or growth factors being secreted by this population of CSF1R-expressing supportive cells. We recently performed a study32 in which we incubated primary AML patient samples with various cytokines and growth factors, and classified each sample either as a “responder” (molecule increased cell growth) or a “nonresponder” (molecule had no effect). For each of these cytokines/growth factors, we compared sensitivity to GW-2580 for responders and nonresponders. We determined the fold change (the ratio of mean AUC values) between responder samples and nonresponder samples to examine whether CSF1R inhibitor sensitivity correlated with responsiveness to any recombinant cytokine/growth factor, which could indicate an operational role for that cytokine/growth factor in mediating the signal between CSF1Rhi cells and AML tumor cells. We identified cytokines and growth factors that showed a negative log2 fold change, meaning that the cytokine-responsive samples were more sensitive to GW-2580 than the samples that were nonresponsive to the cytokine (Figure 4A). The 4 cytokines and growth factors that correlated most significantly with CSF1R inhibitor sensitivity were lipopolysaccharide (LPS), RANTES, CSF1, and HGF (Figure 4B). The identification of CSF1 in this group reinforces our previous data suggesting that GW-2580 sensitivity occurs specifically because of inhibition of CSF1R and also suggests that the CSF1R inhibitor sensitivity involves a ligand-dependent mechanism.
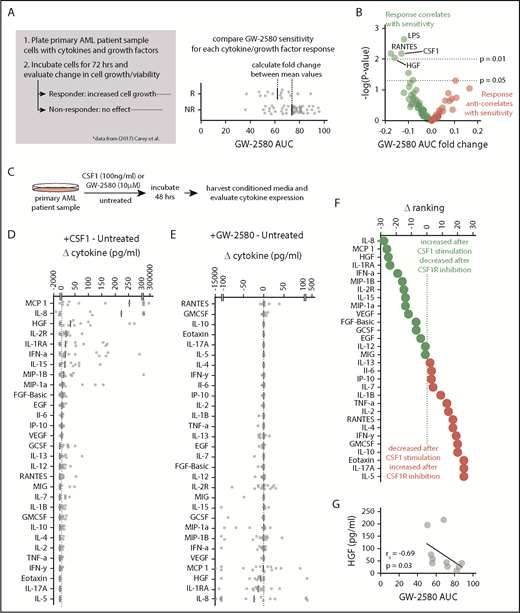
HGF stimulates growth in CSF1R inhibitor–sensitive samples and its secretion is regulated by CSF1R activation. (A) Schematic of analysis connecting cytokine growth assay results (data from Carey et al32 ) with CSF1R inhibitor sensitivity. (B) Cytokines and growth factors that increase AML cell growth are significantly associated with sensitivity to GW-2580. Data represent log2 fold change of GW-2580 AUCs between responders and nonresponders (n = 68 primary AML patient samples and 94 cytokines/growth factors) vs the unadjusted P value, determined by Student t tests. (C) Schematic of evaluating cytokine secretion after stimulation/inhibition of CSF1R in primary AML patient samples (n = 15). (D-E) Change in cytokine levels in conditioned media of primary AML patient samples after (D) CSF1R stimulation and (E) CSF1R inhibition. Cytokine levels for each patient sample are normalized to untreated and ranked by median value. (F) Difference in rank order of cytokines from panels D and E identifies cytokine secretion profile associated with upregulated and downregulated CSF1R activity. (G) Baseline HGF levels in primary AML patient samples correlate with GW-2580 sensitivity (n = 10). Significance determined by Spearman rank correlation.
HGF stimulates growth in CSF1R inhibitor–sensitive samples and its secretion is regulated by CSF1R activation. (A) Schematic of analysis connecting cytokine growth assay results (data from Carey et al32 ) with CSF1R inhibitor sensitivity. (B) Cytokines and growth factors that increase AML cell growth are significantly associated with sensitivity to GW-2580. Data represent log2 fold change of GW-2580 AUCs between responders and nonresponders (n = 68 primary AML patient samples and 94 cytokines/growth factors) vs the unadjusted P value, determined by Student t tests. (C) Schematic of evaluating cytokine secretion after stimulation/inhibition of CSF1R in primary AML patient samples (n = 15). (D-E) Change in cytokine levels in conditioned media of primary AML patient samples after (D) CSF1R stimulation and (E) CSF1R inhibition. Cytokine levels for each patient sample are normalized to untreated and ranked by median value. (F) Difference in rank order of cytokines from panels D and E identifies cytokine secretion profile associated with upregulated and downregulated CSF1R activity. (G) Baseline HGF levels in primary AML patient samples correlate with GW-2580 sensitivity (n = 10). Significance determined by Spearman rank correlation.
To further study the cytokines and growth factors that are operationally important in mediating a paracrine signal between leukemia cells and CSF1R-expressing monocyte/macrophage support cells, we treated primary AML patient samples (n = 15) either with CSF1, GW-2580, or nothing (remained untreated). We collected cell supernatants to study changes in cytokine levels that were impacted by positive or negative perturbation of CSF1R signaling (Figure 4C). We calculated the change in cytokine levels in conditioned media after CSF1 stimulation (CSF1-treated minus untreated control) and after CSF1R inhibition (GW-2580-treated minus untreated control), ranking each cytokine in order of decreasing median value (Figure 4D-E). To identify the cytokines that both increased after CSF1 stimulation and decreased after CSF1R inhibition, we subtracted the inhibition ranking from the stimulation ranking (Figure 4F).
The top 3 cytokines that we identified were interleukin 8 (IL-8), monocyte chemoattractant protein 1 (MCP-1), and HGF. The identification of IL-8 and MCP-1 in this context is not unexpected, as similar results have been observed in blood from healthy donors.41 However, HGF has not been previously associated as a CSF1/CSF1R-driven growth factor. We observed a significant correlation between GW-2580 sensitivity and baseline levels of HGF in conditioned media from untreated patient samples (n = 10; 5 samples showed no detectable HGF) (Figure 4G). We examined our small-molecule inhibitor data set of ex vivo AML patient samples to determine whether there was a correlation between CSF1R inhibitor sensitivity and sensitivity to inhibitors of the HGF receptor, MET. Using 3 small-molecule inhibitors with sensitivity to MET (crizotinib, foretinib, and SGX-523), whose responses in AML patient samples significantly correlate with one another (supplemental Figure 9A-C), we observed a strong correlation between their response and the response to GW-2580 (Figure 5A-C).
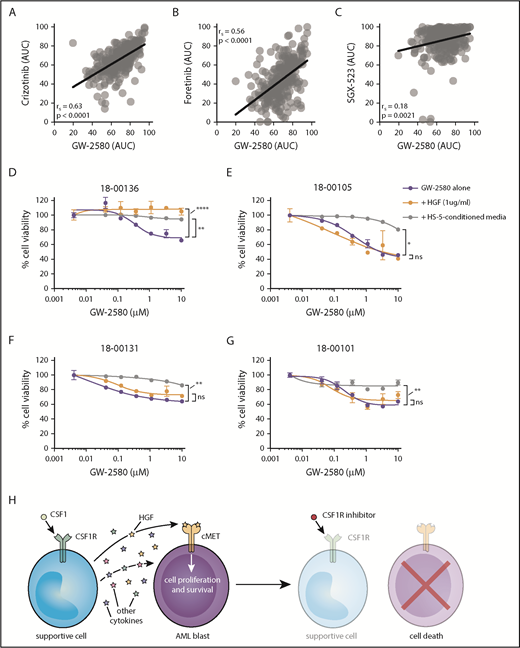
Sensitivity to CSF1R inhibitors correlates with MET inhibitor sensitivity and is eliminated after external cytokine stimulation. (A-C) Strong correlation in primary AML patient samples (n = 315) between GW-2580 sensitivity and sensitivity to 3 MET inhibitors: (A) crizotinib, (B) foretinib, and (C) SGX-523. Significance determined by Spearman rank correlation. (D-G) GW-2580 dose-response curves for 4 primary AML patient samples treated with recombinant HGF (1 µg/mL), HS-5–conditioned media, or untreated. Error bars represent mean plus or minus the standard error of the mean (n = 4 replicates); nonlinear curve fitting conducted using least squares regression. Significance determined by 1-way analysis of variance on the area under each curve with the Dunn test for multiple comparisons. (H) Model of CSF1R inhibitor sensitivity in primary AML patient samples resulting from paracrine secretion of cytokines by CSF1R-expressing supportive cells.
Sensitivity to CSF1R inhibitors correlates with MET inhibitor sensitivity and is eliminated after external cytokine stimulation. (A-C) Strong correlation in primary AML patient samples (n = 315) between GW-2580 sensitivity and sensitivity to 3 MET inhibitors: (A) crizotinib, (B) foretinib, and (C) SGX-523. Significance determined by Spearman rank correlation. (D-G) GW-2580 dose-response curves for 4 primary AML patient samples treated with recombinant HGF (1 µg/mL), HS-5–conditioned media, or untreated. Error bars represent mean plus or minus the standard error of the mean (n = 4 replicates); nonlinear curve fitting conducted using least squares regression. Significance determined by 1-way analysis of variance on the area under each curve with the Dunn test for multiple comparisons. (H) Model of CSF1R inhibitor sensitivity in primary AML patient samples resulting from paracrine secretion of cytokines by CSF1R-expressing supportive cells.
We performed a rescue experiment where primary AML patient samples were treated with GW-2580 for 72 hours and incubated either with HGF or conditioned media from the human marrow stromal cell line HS-5. We observed that HGF significantly rescued viability in 1 sample (Figure 5D), suggesting its importance in CSF1R inhibitor sensitivity. However, we also observed that HS-5–conditioned media rescued viability in 4 samples (Figure 5D-G), emphasizing that multiple factors are likely mediating CSF1R inhibitor sensitivity in the majority of samples.
Overall, our results suggest that, for roughly one-quarter of primary AML patient samples, a small subpopulation of CSF1R-expressing cells secretes necessary survival molecules, including HGF, to the bulk population of leukemia cells. By adding small-molecule inhibitors of CSF1R, we can nullify these signals and kill the leukemia cells (Figure 5H).
Discussion
The results of our research suggest that using CSF1R inhibitors or neutralizing agents to eliminate supportive cells may be an effective treatment of a subset of patients with AML. This aligns with existing research in solid tumors, in which eliminating CSF1R inhibitors may be effective against CSF1R-expressing cells in a variety of tumor subtypes.20 However, whereas these data generally suggest that a combinatorial approach is required for efficacy, we observe single-agent sensitivity to CSF1R inhibitors in our ex vivo patient samples.
Although GW-2580 sensitivity did correlate with individual genetic and prognostic markers, there was a correlation with the presence of IDH2 mutations, the significance of which is not understood, we observed a strong association between multiple adverse-risk markers and GW-2580 resistance. We believe that these CSF1R inhibitor–resistant samples are potentially resistant to general treatments, targeted or otherwise, which would explain the ineffectiveness of CSF1R inhibitors. In addition, perhaps the presence of NRAS/KRAS mutations in the leukemia cells, being downstream from the receptor tyrosine kinase signaling, obviates the contribution from upstream CSF1R activity. In forthcoming early stage clinical trials using CSF1R inhibitors in AML patients, the targeted population will likely have relapsed/refractory disease, reducing the number of predicted clinical responders.
Notably, investigating supportive monocyte/macrophages in human AML is inherently challenging. For other cancer types, CSF1R positivity almost exclusively defines a population of infiltrating macrophages. However, because AML itself can originate from macrophage-lineage precursor cells, it is difficult to determine whether CSF1R-expressing TAMs are supportive, reprogrammed monocyte/macrophages, or a tumor-derived subpopulation. In this manuscript, we focused on confirming the effectiveness of CSF1R inhibitors and understanding the mechanism underlying the prosurvival effect of CSF1R-expressing cells. Although our data suggest that CSF1Rhi cells can comprise a tumor subpopulation, additional experiments are needed to better and more broadly characterize their origins and their contribution to tumor survival.
Not only did having a higher percentage of CSF1Rhi cells correlate with increased GW-2580 sensitivity, we observed significantly higher overall survival between patients whose samples were sensitive to CSF1R inhibitors compared with patients with resistant samples. In most solid tumor types, higher TAM density is generally associated with both late-stage clinical presentation and reduced overall survival, although exceptions exist in ovarian and colorectal cancer.42 Our data suggest that AML reflects the broad complexity underlying the prognostic significance of TAMs, regardless of whether these supportive cells are infiltrating monocyte/macrophages or tumor-derived.
Our results indicate that CSF1Rhi cells show phenotypic differences in AML patient samples compared with healthy donor samples, particularly through the increased cell-surface expression of HLA-DR and CD33. HLA-DR is a major histocompatibility complex class II molecule whose expression is found on proinflammatory, classically activated TAMs. Enrichment of HLA-DR-expressing TAMs has been shown to correlate with better overall survival in non–small cell lung cancer43 and ovarian cancer.44 CD33 is a sialoadhesin molecule generally expressed on myeloid-lineage cells and has been identified as a marker on myeloid-derived suppressor cells,45,46 although its role in other supportive cell types remains poorly understood.47 Overall, the functional significance of the various CSF1Rhi cell populations identified in this study could provide yet another distinct supportive-cell-surface marker phenotype identified in many other cancers.48
One remaining question is the extent to which CSF1R ligand contributes to CSF1R inhibitor sensitivity. Adding CSF1 increases leukemia cell growth preferentially in AML patient samples sensitive to CSF1R inhibition (Figure 4A-B), suggesting a ligand-dependent mechanism. There was no association between CSF1 levels in patient sample plasma (22 bone marrow aspirates; 27 peripheral blood) and GW-2580 sensitivity (supplemental Figure 10A-D) (IL-34 could not be detected in 28 samples; data not shown). Because CSF1 is known to be secreted by bone marrow stromal cells,49 we isolated mesenchymal stromal cells from primary AML patient samples and measured the concentration of CSF1 in stromal cell conditioned media by enzyme-linked immunosorbent assay. There was no association between the level of CSF1 and the GW-2580 sensitivity of the samples from which the stromal cells were isolated (supplemental Figure 10E), suggesting that the CSF1 ligand-dependent mechanism could be a localized, autocrine stimulation of CSF1Rhi cells.
The contribution of HGF signaling to this supportive cell-dependent phenotype is intriguing, considering that autocrine HGF signaling has been previously identified in AML by Kentsis et al.50 They found HGF and MET coexpression on 58 of 138 AML patient samples by immunohistochemistry, and 5 of 13 samples showed phosphorylated MET on CD34-selected primary blasts by capillary isoelectric focusing electrophoresis nanoimmunoassay.50 Our data support a paracrine signaling mechanism in which supportive cells not only secrete HGF but other cytokines, as evidenced by the rescuing of cell viability after GW-2580 exposure using HS-5–conditioned media. There are likely multiple cytokine/growth factor pathways responsible for the CSF1R-dependent leukemia cell survival.
Perhaps CSF1R-sensitive AML comprises an earlier stage of disease development, with dependence upon signaling from CSF1Rhi supportive cells for their survival. Eventually, possibly due to a genetic perturbation, the disease is modified, with AML cells either producing their own supportive cytokines (including HGF) or gaining independence from supportive signaling entirely through the acquisition of adverse-risk mutations. Indeed, this model is consistent with our observation that more CSF1R-resistant cases possess adverse-risk disease features.
Overall, we have identified a new role for tumor-supportive cells in AML biology as well as a novel therapeutic approach for targeting survival signaling essential for leukemia survival. Based on our findings, we propose using CSF1R inhibitors as a promising targeted therapy in AML.
Presented in abstract form at the 57th annual meeting of the American Society of Hematology, Orlando, FL, 7 December 2015 (Abstract LP-3824).
The online version of this article contains a data supplement.
The publication costs of this article were defrayed in part by page charge payment. Therefore, and solely to indicate this fact, this article is hereby marked “advertisement” in accordance with 18 USC section 1734.
Acknowledgments
The authors thank Patrice Lee and David Chantry of Array BioPharma for providing ARRY-382, Mandy Gilchrist and Brianna Garcia from the OHSU Flow Cytometry Core for technical assistance, Daniel Bottomly and Beth Wilmot for conducting Beat AML exome sequencing, and Cristina Tognon and Elie Traer for assistance with Beat AML patient samples. Additionally, the authors thank Stephen Kurtz, Christopher Eide, Quinn Roth-Carter, Riley Roth-Carter, and Chris Cheng.
This work was supported by The Leukemia & Lymphoma Society. J.W.T. received grants from the V Foundation for Cancer Research, the Gabrielle’s Angel Foundation for Cancer Research, and the National Institutes of Health National Cancer Institute (1R01CA183947, 1U01CA217862, 1U01CA214116, and 1U54CA224019). D.K.E. was supported by the National Science Foundation Graduate Research Fellowship Program (DGE-1448072).
Authorship
Contribution: D.K.E. and J.W.T. conceptualized the study, developed the study methodology, and acquired funding for the study; D.K.E., K.W.-S., T.L., A.K., M.M., M.R., N.L., M.L., and S.K.M. provided formal analysis; D.K.E., K.W.-S., A.R., A.D., A.A., M.R., A.d’A., A.L., and E.F.L. investigated; A.A., and J.W.T. provided resources; D.K.E. wrote the original draft of the manuscript; D.K.E., K.W.-S., A.R., A.D., T.L., A.L., E.F.L., A.K., M.M., M.R., A.d’A., N.L., A.A., D.T.S., M.L., S.K.M., and J.W.T. reviewed and edited the manuscript; D.K.E., K.W.-S., T.L., M.R., D.T.S., M.L., and J.W.T. visualized the study; and S.K.M. and J.W.T. supervised the study.
Conflict-of-interest disclosure: J.W.T. receives research support from Agios, Aptose, Array, AstraZeneca, Constellation, Genentech, Gilead, Incyte, Janssen, Seattle Genetics, Syros and Takeda, and is a cofounder of Vivid Biosciences. The remaining authors declare no competing financial interests.
Correspondence: Jeffrey W. Tyner, Oregon Health & Science University, 3181 SW Sam Jackson Park Rd, Mail Code L592, Portland, OR 97239-3098; e-mail: tynerj@ohsu.edu.

This feature is available to Subscribers Only
Sign In or Create an Account Close Modal