

Key Points
Thrombosis develops in the spleen and liver with distinct kinetics following Salmonella infection.
Thrombi in the spleen and liver are not major sites of bacterial localisation.

Abstract
Thrombosis is a frequent, life-threatening complication of systemic infection associated with multiple organ damage. We have previously described a novel mechanism of inflammation-driven thrombosis induced by Salmonella Typhimurium infection of mice. Thrombosis in the liver develops 7 days after infection, persisting after the infection resolves, and is monocytic cell dependent. Unexpectedly, thrombosis was not prominent in the spleen at this time, despite carrying a similar bacterial burden as the liver. In this study, we show that thrombosis does occur in the spleen but with strikingly accelerated kinetics compared with the liver, being evident by 24 hours and resolving rapidly thereafter. The distinct kinetics of thrombosis and bacterial burden provides a test of the hypothesis that thrombi form in healthy vessels to trap or remove bacteria from the circulation, often termed immunothrombosis. Remarkably, despite bacteria being detected throughout infected spleens and livers in the early days of infection, immunohistological analysis of tissue sections show that thrombi contain very low numbers of bacteria. In contrast, bacteria are present throughout platelet aggregates induced by Salmonella in vitro. Therefore, we show that thrombosis develops with organ-specific kinetics and challenge the universality of immunothrombosis as a mechanism to capture bacteria in vivo.
Introduction
The consequences of thrombosis are the leading cause of death worldwide.1 Thrombosis is common after infection and can lead to organ failure and poor outcome.2-5 There are however significant gaps in our understanding of blood-borne infection–associated thrombosis, including whether it occurs at multiple sites through distinct mechanisms and/or kinetics.2 Immune-driven thrombosis, broadly termed immunothrombosis, can occur in the presence or absence of infection. Nevertheless, when triggered by infection, it is still unclear whether the induced thrombi capture and contain blood-borne pathogens within the vasculature as proposed.6-8
We recently reported on a novel pathway of thrombosis in the liver after infection with Salmonella Typhimurium (STm) involving inflammation-driven upregulation of podoplanin on monocytic cells and activation of platelets.9 A striking feature of this thrombosis is that it takes 1 week to develop and then persists as the bacterial burden declines. Furthermore, thrombi are largely undetectable in the spleen at this time, despite this organ being a major site of bacterial colonization.10,11 In this paper, we show that extensive thrombosis does occur in the spleen but is rapid in onset and transient, with distinct kinetics to liver. Furthermore, we show that thrombi present in either organ contain surprisingly few bacteria, despite the high bacterial burdens in the organs themselves, indicating that bacterial entrapment is not a major consequence of thrombosis after infection with STm.
Study design
Full details are provided in supplemental Materials and methods (available on the Blood Web site).
Mice and infection with STm
Immunohistology and fluorescent microscopy
Clodronate treatment
Results and discussion
Thrombosis develops with distinct kinetics in the spleen and liver
Thrombosis in the liver becomes established 7 days after infection, whereas few thrombi are detectable in the spleen at this time.9 In the liver, thrombosis is driven by the upregulation of podoplanin on monocytes/macrophages, triggering activation of CLEC-2 on platelets.9 The spleen is a reservoir of monocytic cells, with high numbers of these cells present before infection compared with the liver, and 24 hours after infection, there were increased numbers of inflammatory splenic monocytes (supplemental Figure 1), suggesting that thrombosis may occur at a much earlier stage in the infection. Consistent with this, we found numerous, large platelet-rich thrombi within the spleen 24 hours after infection (Figure 1A), independent of whether mice were infected IV or IP or the virulence of the infecting strain (Figure 1B-C). Thrombi typically stained positive for citrullinated-histone H3, Ly6G+ cells, and myeloperoxidase (supplemental Figure 2). Ly6C+ and F4/80+ cells were located at the periphery of thrombi (supplemental Figure 3). Splenic thrombosis resolved rapidly after day 1, with few thrombi detected thereafter (Figure 1D-E), often leaving the remnants of a fibrin core (Figures 1 and 2A). In contrast, at these early times, thrombosis was undetectable in the liver (Figure 1B-D,F). Moreover, thrombosis was absent in the spleens of clodronate-liposome–treated mice (Figure 1G), suggesting that like in the liver, monocytic cells are important in this process.9 Therefore, systemic infection with STm can induce thrombosis in distinct sites and with distinct kinetics, likely due to the levels of tissue-resident macrophages present at the time of infection.
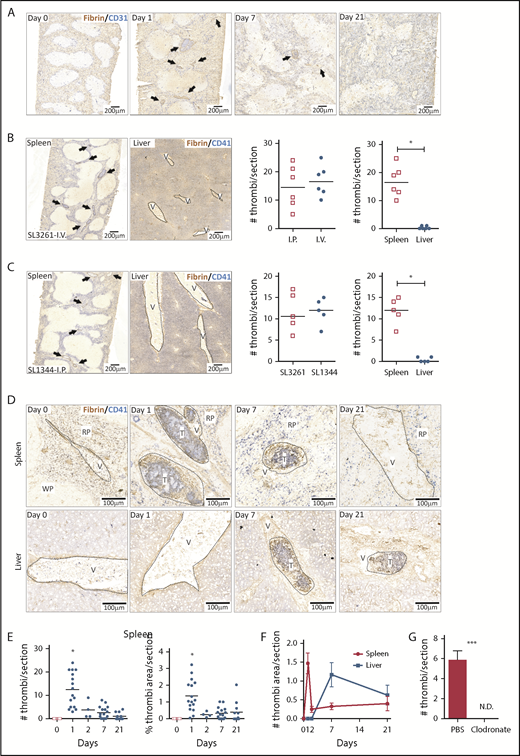
Thrombosis in the spleen and liver follows different kinetics after STm infection. (A) Frozen spleens from WT mice infected with 5 × 10⁵ STm intraperitoneally (IP) were sectioned longitudinally to the hilum (≥1200 μm deep), and 5-μm sections were stained by IHC. Scans of stained spleen sections from mice infected for 0, 1, 7, and 21 days show blood vessels identified with anti-CD31 in blue and thrombi with antifibrin/fibrinogen in brown. Arrows identify individual thrombi. (B) Representative low power images of spleen and liver sections stained for CD41 (platelets; blue) and fibrin/fibrinogen (brown) from mice infected for 24 hours via the IV route with 5 × 10⁵ STm SL3261. Arrows identify individual thrombi. The left-hand graph shows the number of thrombi per spleen section for mice infected IP or IV. The right-hand graph shows the number of thrombi per section in the spleen and liver from these IV-infected mice. (C) Representative low-power images of spleen and liver sections stained for CD41 (platelets; blue) and fibrin/fibrinogen (brown) from mice infected for 24 hours with the 105 virulent STm SL1344 strain. Arrows identify individual thrombi. The left-hand graph shows the number of thrombi per spleen section for mice infected with SL3261 (attenuated) or SL1344 (virulent). The right-hand graph shows the number of thrombi per section in the spleen and liver from mice infected with SL1344. (D) Representative scans at higher magnification of spleen sections (top) and liver sections (bottom) from WT mice at days 0, 1, 7, and 21 after infection with 5 × 10⁵ STm SL3261. Sections are stained for fibrin/fibrinogen (brown) and CD41 (blue). RP, red pulp; T, thrombus; V, vein; WP, white pulp. (E) Quantification of numbers of thrombi per spleen section (left graph) and the proportion of section area covered by thrombi (right graph) at days 0, 1, 2, 7, and 21 after infection with 5 × 10⁵ STm SL3261. Each point represents a single mouse (data are combined from 3 independent experiments); *P < .05 by 1-way ANOVA. (F) Line graph showing the level of thrombosis in the spleen (red line) and the liver (blue line) over the first 3 weeks of infection with 5 × 10⁵ STm SL3261. The data are expressed as mean ± standard error of the mean from at least 4 mice per group combined from 3 independent experiments. (G) Quantification of thrombi in spleen sections from phosphate-buffered saline (PBS) liposomes or clodronate-liposome–pretreated mice infected for 24 hours with 5 × 10⁵ STm SL3261. Combined data from 2 experiments with a total of 8 mice in each group are shown; *P < .05, ***P < .001 by 2-tailed nonparametric t test. N.D., not detected.
Thrombosis in the spleen and liver follows different kinetics after STm infection. (A) Frozen spleens from WT mice infected with 5 × 10⁵ STm intraperitoneally (IP) were sectioned longitudinally to the hilum (≥1200 μm deep), and 5-μm sections were stained by IHC. Scans of stained spleen sections from mice infected for 0, 1, 7, and 21 days show blood vessels identified with anti-CD31 in blue and thrombi with antifibrin/fibrinogen in brown. Arrows identify individual thrombi. (B) Representative low power images of spleen and liver sections stained for CD41 (platelets; blue) and fibrin/fibrinogen (brown) from mice infected for 24 hours via the IV route with 5 × 10⁵ STm SL3261. Arrows identify individual thrombi. The left-hand graph shows the number of thrombi per spleen section for mice infected IP or IV. The right-hand graph shows the number of thrombi per section in the spleen and liver from these IV-infected mice. (C) Representative low-power images of spleen and liver sections stained for CD41 (platelets; blue) and fibrin/fibrinogen (brown) from mice infected for 24 hours with the 105 virulent STm SL1344 strain. Arrows identify individual thrombi. The left-hand graph shows the number of thrombi per spleen section for mice infected with SL3261 (attenuated) or SL1344 (virulent). The right-hand graph shows the number of thrombi per section in the spleen and liver from mice infected with SL1344. (D) Representative scans at higher magnification of spleen sections (top) and liver sections (bottom) from WT mice at days 0, 1, 7, and 21 after infection with 5 × 10⁵ STm SL3261. Sections are stained for fibrin/fibrinogen (brown) and CD41 (blue). RP, red pulp; T, thrombus; V, vein; WP, white pulp. (E) Quantification of numbers of thrombi per spleen section (left graph) and the proportion of section area covered by thrombi (right graph) at days 0, 1, 2, 7, and 21 after infection with 5 × 10⁵ STm SL3261. Each point represents a single mouse (data are combined from 3 independent experiments); *P < .05 by 1-way ANOVA. (F) Line graph showing the level of thrombosis in the spleen (red line) and the liver (blue line) over the first 3 weeks of infection with 5 × 10⁵ STm SL3261. The data are expressed as mean ± standard error of the mean from at least 4 mice per group combined from 3 independent experiments. (G) Quantification of thrombi in spleen sections from phosphate-buffered saline (PBS) liposomes or clodronate-liposome–pretreated mice infected for 24 hours with 5 × 10⁵ STm SL3261. Combined data from 2 experiments with a total of 8 mice in each group are shown; *P < .05, ***P < .001 by 2-tailed nonparametric t test. N.D., not detected.
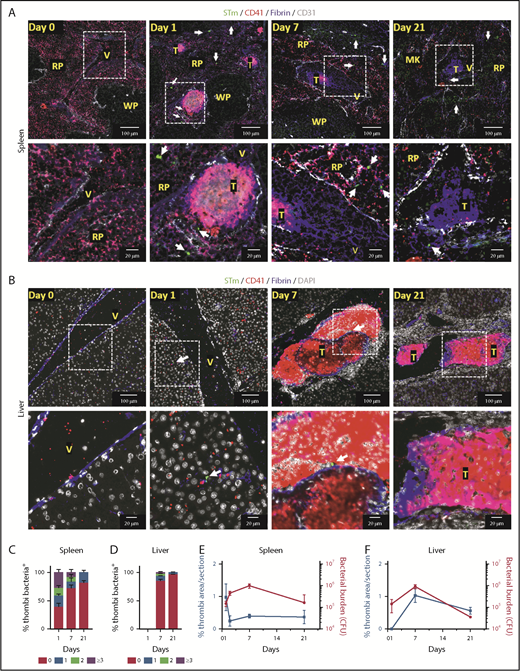
Detection of bacteria within thrombi. (A-B) Representative immunofluorescence photomicrographs of spleens (A) and livers (B) from WT mice infected with 5 × 10⁵ STm SL3261 for 0, 1, 7 and 21 days. MK, megakaryocyte; RP, red pulp; T, thrombus; V, vein; WP, white pulp. Fibrin, blue; CD31, white; CD41, red; STm, green (indicated with white arrows). For panels A and B, the second row shows a higher-magnification image of the area identified by the white box. (C-D) Frequency of detecting 0, 1, 2, or ≥3 bacteria in thrombi in sections from spleens and livers, respectively, from mice infected with 5 × 10⁵ STm SL3261 for 0, 1, 7, or 21 days. (E-F) Line graphs showing the kinetics of thrombosis (blue) and bacterial colonization (red) in spleens and livers respectively, from mice infected with 5 × 10⁵ STm SL3261 for 0, 1, 2, 7 or 21 days. Data are expressed as mean ± standard error of the mean from 152 thrombi counted in spleens from day 1–infected mice, 40 from day 7–infected mice, and 18 from day 21–infected mice. In liver, 411 thrombi were counted for days 7 and 23 for day 21 postinfection. In each case, thrombi were counted from at least 4 mice per group and are combined from 3 independent experiments. CFU, colony-forming unit.
Detection of bacteria within thrombi. (A-B) Representative immunofluorescence photomicrographs of spleens (A) and livers (B) from WT mice infected with 5 × 10⁵ STm SL3261 for 0, 1, 7 and 21 days. MK, megakaryocyte; RP, red pulp; T, thrombus; V, vein; WP, white pulp. Fibrin, blue; CD31, white; CD41, red; STm, green (indicated with white arrows). For panels A and B, the second row shows a higher-magnification image of the area identified by the white box. (C-D) Frequency of detecting 0, 1, 2, or ≥3 bacteria in thrombi in sections from spleens and livers, respectively, from mice infected with 5 × 10⁵ STm SL3261 for 0, 1, 7, or 21 days. (E-F) Line graphs showing the kinetics of thrombosis (blue) and bacterial colonization (red) in spleens and livers respectively, from mice infected with 5 × 10⁵ STm SL3261 for 0, 1, 2, 7 or 21 days. Data are expressed as mean ± standard error of the mean from 152 thrombi counted in spleens from day 1–infected mice, 40 from day 7–infected mice, and 18 from day 21–infected mice. In liver, 411 thrombi were counted for days 7 and 23 for day 21 postinfection. In each case, thrombi were counted from at least 4 mice per group and are combined from 3 independent experiments. CFU, colony-forming unit.
Most thrombi induced in the spleen and liver contain limited numbers of bacteria
It has been proposed that thrombus formation can trap and remove bacteria, a process sometimes known as immunothrombosis.6 After platelet activation induced by STm in vitro, bacteria are present throughout the aggregate (supplemental Figure 4; supplemental Video 1). This demonstrates that bacteria can closely associate with platelets in aggregates formed in vitro. We used IHC and immunofluorescence microscopy to identify the relationship between bacterial localization and thrombi in vivo at the peak times of thrombosis in the spleen (day 1) and liver (day 7) (Figure 2A-B; supplemental Figure 5). A 3-dimensional reconstruction of a thrombus and proximal bacteria is shown in supplemental Figure 6 and supplemental Video 2. Collectively, these approaches all showed that thrombi contained a surprisingly low number of bacteria, despite their relative abundance in the surrounding tissues. Quantification of the bacteria within sections of splenic thrombi (>200 thrombi from 37 mice [3 time points evaluated]) showed that no bacteria were detected in 38% of thrombus sections at day 1 and that 33% of sectioned thrombi contained 1 or 2 bacteria (Figure 2C). At later times, bacteria were detected at an even lower frequency within sections of splenic thrombi, with >90% of thrombi containing 0 to 2 bacteria at days 7 and 21 (Figure 2C). In the liver, only ∼20% of thrombi sections (>400 thrombi counted from 23 mice) contained bacteria at day 7, and this proportion was even lower (<5%) at day 21 (Figure 2D). Analysis of serial sections from the same thrombi confirmed a paucity of bacteria within individual thrombi (supplemental Figure 7). When the bacterial burdens per organ were compared with the levels of thrombosis at days 1 to 21 after infection, no direct relationship was found between the 2 other than the necessity for infection to induce thrombosis. In the spleen, thrombosis peaks before bacterial numbers peak (Figure 2E) and falls while bacterial numbers are still rising, whereas in the liver, thrombosis develops later and peaks when the bacterial levels are beginning to decline (Figure 2F).9,13,17 Therefore, thrombi induced during this infection do not trap significant numbers of bacteria, regardless of the bacterial loads in the organs. This contrasts with other models of infection,18,19 which used 1000-fold higher numbers of bacteria compared with this study.9 Thus, although STm infection can drive thrombosis, thrombi do not necessarily contribute to bacterial containment; moreover, they form in different organs with distinct kinetics. These findings are important for our understanding of the consequences of infection on the hematological system, since they show that the presence of equivalent levels of bacteria is not enough to induce thrombosis in an organ.
Although these data show that during a single infection, thrombosis can occur sequentially in multiple tissues, further work is needed to evaluate whether other systemic bacterial infections induce thrombosis with similar kinetics. Thrombi are induced by many different pathogens, and although the role of thrombosis after infection remains unclear, the presumption must be that they are pathological in some circumstances, particularly if they are large and/or embolize. Since we have shown that thrombi develop in the venous system, they may form due to differences in local infection-associated changes in blood flow and as part of altered vessel homeostasis. Perhaps the bigger clinical question is about what controls their ultimate size and what triggers thrombus resolution, as this may influence whether thrombosis becomes clinically problematic. Therefore, for a known infection, it may be possible to target therapeutically those organs at greatest risk of developing thrombosis at particular stages of infection. These findings deepen our understanding of the concept of immunothrombosis and show that thrombi can form as a noncanonical hemostatic response to infection-driven inflammation, but not to capture bacteria.
The publication costs of this article were defrayed in part by page charge payment. Therefore, and solely to indicate this fact, this article is hereby marked “advertisement” in accordance with 18 USC section 1734.
The online version of this article contains a data supplement.
Acknowledgments
The authors thank the staff of the Biomedical Services Unit for their assistance and the Imaging Suite at the University of Birmingham for support.
This work was supported by grants from the Medical Research Council (MR/N023706/1) and the British Heart Foundation (RG/13/18/30563). N.B.-C. was supported by a National Council of Science and Technology (CONACYT)–Mexico overseas postdoctoral fellowship (CVU 332390). S.P.W. is a British Heart Foundation chair (CH/03/003).
Authorship
Contribution: N.B.-C. and M.P.-T. designed and performed the experiments, analyzed the data, and wrote the manuscript; A.F.-L., M.Z., J.R.H., L.D.W.K., and W.M.C. performed the experiments and analyzed the data; M.R.T. and J.R. contributed vital reagents and experimental design and proofread the manuscript; I.R.H. provided experimental design and novel reagents and proofread the manuscript; and A.F.C. and S.P.W. supervised the research, analyzed the data, and wrote the manuscript.
Conflict-of-interest disclosure: The authors declare no competing financial interests.
Correspondence: Adam F. Cunningham, Institute of Immunology and Immunotherapy, College of Medical and Dental Sciences, University of Birmingham, Birmingham B15 2TT, United Kingdom; e-mail: a.f.cunningham@bham.ac.uk; and Steve P. Watson, Institute of Cardiovascular Sciences, College of Medical and Dental Sciences, University of Birmingham, Birmingham B15 2TT, United Kingdom; e-mail: s.p.watson@bham.ac.uk.

This feature is available to Subscribers Only
Sign In or Create an Account Close Modal