

Key Points
Heme rapidly upregulates ribosomal protein genes during early erythropoiesis to help ensure sufficient ribosomes for globin translation.
Heme later downregulates GATA1, GATA1-target genes, and mitotic spindle genes to enable the normal termination of erythroid differentiation.

Abstract
Erythropoiesis is the complex, dynamic, and tightly regulated process that generates all mature red blood cells. To understand this process, we mapped the developmental trajectories of progenitors from wild-type, erythropoietin-treated, and Flvcr1-deleted mice at single-cell resolution. Importantly, we linked the quantity of each cell’s surface proteins to its total transcriptome, which is a novel method. Deletion of Flvcr1 results in high levels of intracellular heme, allowing us to identify heme-regulated circuitry. Our studies demonstrate that in early erythroid cells (CD71+Ter119neg-lo), heme increases ribosomal protein transcripts, suggesting that heme, in addition to upregulating globin transcription and translation, guarantees ample ribosomes for globin synthesis. In later erythroid cells (CD71+Ter119lo-hi), heme decreases GATA1, GATA1-target gene, and mitotic spindle gene expression. These changes occur quickly. For example, in confirmatory studies using human marrow erythroid cells, ribosomal protein transcripts and proteins increase, and GATA1 transcript and protein decrease, within 15 to 30 minutes of amplifying endogenous heme synthesis with aminolevulinic acid. Because GATA1 initiates heme synthesis, GATA1 and heme together direct red cell maturation, and heme stops GATA1 synthesis, our observations reveal a GATA1–heme autoregulatory loop and implicate GATA1 and heme as the comaster regulators of the normal erythroid differentiation program. In addition, as excessive heme could amplify ribosomal protein imbalance, prematurely lower GATA1, and impede mitosis, these data may help explain the ineffective (early termination of) erythropoiesis in Diamond Blackfan anemia and del(5q) myelodysplasia, disorders with excessive heme in colony-forming unit-erythroid/proerythroblasts, explain why these anemias are macrocytic, and show why children with GATA1 mutations have DBA-like clinical phenotypes.
Introduction
Humans produce 2.3 × 10⁶ red cells/s. Because hemoglobin makes up more than 95% of the red cell protein content, large quantities of heme and globin are needed, and needed quickly, as red cells mature. However, free-heme is toxic, leading to elevated reactive oxygen species (ROS) and apoptotic and ferroptotic cell death.1-4 Therefore, heme synthesis must be tightly coordinated with globin synthesis. This cannot occur by coregulating the transcription or translation of heme and globin, because heme is an enzymatically assembled chemical, whereas globin is a protein. Therefore, developing erythroid cells need an alternative strategy.
GATA1 expression and iron availability initiate an erythroid cell’s heme synthesis.5-7 Heme then rapidly induces globin transcription and translation by removing Bach18-10 and inhibiting HRI activity,11,12 respectively. Although these mechanisms ensure that globin is synthesized as soon as heme is available, and only when heme is available, there is an obligate time (the colony-forming unit-erythroid [CFU-E]/proerythroblast stage) when transferrin receptor (CD71) expression is high, ample iron is present, and heme synthesis is robust, yet globin is insufficient. To avoid heme- and ROS-mediated damage during this brief interval, CFU-E/proerythroblasts export heme via FLVCR1, a cytoplasmic heme export protein.4,13-15 FLVCR1 provides an efficient solution, a way out for unneeded heme, while preserving the erythroid cell’s ability to use heme as a signaling molecule and a protein cofactor.
In previous work, we documented the pathological consequences of excessive CFU-E/proerythroblast heme by investigating Diamond Blackfan anemia (DBA) and the myelodysplasia associated with deletion of chromosome 5q [del(5q) myelodysplastic syndrome (MDS)].4 DBA is a congenital macrocytic anemia that results from germline mutation and haploinsufficiency of 1 of 16 ribosomal proteins.16 The macrocytic anemia of del(5q) MDS results from the somatic acquisition of ribosomal protein S14 (RPS14) haploinsufficiency.17 When tested, these ribosomal protein haploinsufficiencies cause poor ribosome assembly and impair translation.18-21 The limited or less efficient translation is sufficient to generate the small quantity of protein (enzymes) needed for brisk heme synthesis, and heme production proceeds normally in erythroid marrow cells from patients with DBA and patients with del(5q) MDS.4 However, the synthesis of globin, a protein, is initially inadequate, as ample globin requires robust translation. The quantity of heme in CFU-E/proerythroblasts exceeds the export capacity of FLVCR1, and cell death ensues.4
Here, to more completely define what heme signals during normal erythroid differentiation and how heme aborts erythroid differentiation when excessive, we analyzed single early erythroid cells from Flvcr1-deleted mice. Flvcr1-deleted mice have no mutations in metabolic or erythroid genes. Erythroid differentiation thus proceeds normally until the CFU-E/proerythroblast stage, when cells synthesize heme but cannot export it. As in patients with DBA and del(5q) MDS, the excessive CFU-E/proerythroblast heme causes ferroptotic and apoptotic cell death, ineffective erythropoiesis, and severe macrocytic anemia.14,15
Specifically, we quantitated the cell surface protein expression of erythroid precursors in wild-type and Flvcr1-deleted mice and linked this to the cell’s total transcriptome. Because Flvcr1-deleted mice are anemic and have high serum erythropoietin (EPO) levels,15 EPO-treated mice were included as an additional control. We then confirmed that our observations were a direct consequence of heme by amplifying heme synthesis in primary human erythroid marrow cells in vitro and observing its immediate effect on gene and protein expression.
With this approach, we show that in early erythroid precursors, heme upregulates the transcription of ribosomal protein genes, which results in increased ribosomal protein production and cellular ribosome content. As erythroid differentiation proceeds, it is known, and our studies confirm, that many GATA1-target genes are coordinately upregulated by heme via removing the Bach1 repressor, including heme biosynthesis genes.7,22-25 Thus, GATA1 and heme cooperate to coamplify the red cell program.
In later erythroid cells, we show that heme decreases GATA1, GATA1-target genes, and mitotic spindle gene expression.
These observations provide new insights into how erythropoiesis physiologically and pathophysiologically terminates. In normal settings, heme should not accumulate until late in erythropoiesis, when cell surface FLVCR1 is depleted. This is because FLVCR1 mRNA expression peaks at the burst-forming unit-erythroid (BFU-E)/CFU-E stage and then quickly stops.13,15 FLVCR1 protein is stable (long-lived),26 but dilutes as cells divide and is low or absent during the terminal stages of red cell maturation. We suspect that the late accumulation of heme deceases mitotic spindle gene expression to slow cell division, and downregulates GATA1 to appropriately end erythroid differentiation.
In contrast, in Flvcr1-deleted mice [and, by extension, in patients with DBA and patients with del(5q) MDS], the excess heme in CFU-E/proerythroblasts would downregulate GATA1 and slow mitosis prematurely, contributing to the ineffective erythroid differentiation and macrocytic anemia.
Together, these analyses provide a comprehensive understanding of the complex networks regulating erythropoiesis and identify an essential autoregulatory loop in which GATA1 initiates heme synthesis, heme and GATA1 coamplify the erythroid program, and then heme downregulates GATA1 to terminate a red cell’s development. They also provide new insights into the pathophysiology of DBA and del(5q) MDS.
Materials and methods
Mice
Inducible deletion of adult Flvcr+/+;Mxcre (wild-type control) and Flvcrflox/flox;Mxcre (Flvcr1-deleted) mice was performed as before.14 Additional wild-type mice were treated with 50U recombinant human EPO (epoetin alfa, Centocor Ortho Biotech Products, L.P.) every 48 hours for 6 days before single-cell isolation and analysis. All studies were approved by the University of Washington Institutional Animal Care and Use Committee.
Single-cell isolation, imaging, sequencing, and analysis
Erythroid precursor cells, populations Iⅈ B220–Gr1–CD11b–CD71+CD44hiTer119neg-hi, which include some BFU-E and all CFU-E, proerythroblasts, and basophilic erythroblasts15 (Figure 1A), were sorted on an Aria III cell sorter (antibodies in supplemental Table 1, available on the Blood Web site), and then processed on the C1 Single-Cell Auto-Prep System (Fluidigm) according to the manufacturer’s protocol. After the cells were loaded on the C1 chip, each cell was imaged for quantitation of CD71, CD44, and Ter119 expression before cell lysis and further processing. Each cell’s cDNA was harvested and then uniquely barcoded and sequenced (NextSeq 500). Raw sequence reads were aligned to the mouse genome (NCBI build 37.2) and normalized as reads per kilobase per million transcripts (RPKM). The supplemental material includes additional details and microarray analyses. All RNA sequencing (RNAseq) and microarray data have been deposited in the GEO database (accession numbers GSE94898 and GSE94905).
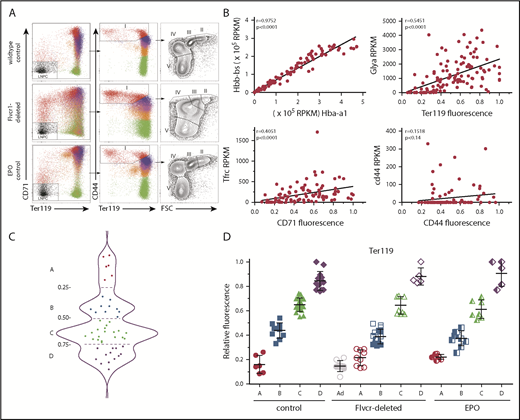
Early committed erythroid progenitors (BFU-E to basophilic erythroblasts) separate into 4 transcriptional groups correlating with Ter119 staining intensity. (A) Flow cytometry assessment of marrow cells from wild-type, Flvcr1-deleted, and EPO-treated mice. B220–Gr1–CD11b– marrow cells were divided into populations I-V as before.15,33 Single erythroid precursors from populations I and II were analyzed as described in the Materials and methods. In wild-type mice, the hemoglobin (HGB) equals 13.8 ± 0.7, and mean corpuscular volume (MCV) equals 44.8 ± 3.1; in Flvcr1-deleted mice, the HGB is 6.2 ± 1.3 and MCV is 72.2 ± 1.9, and in EPO-treated mice, the HGB is 15.9 ± 1.1 and MCV is 53.9 ± 0.9. The percentages of erythroid cells with given Ter119 intensities varied substantially; for example, Ter119neg cells comprised 0.93%, 4.39%, and 1.69% of cells from wild-type, Flvcr1-deleted, and EPO-treated mice, respectively. (B) Method validation. Transcription (RPKM) of α-globin (Hba-a1) closely correlated with β-globin (Hbb-bs) (r = 0.98), reflecting their coordinate regulation.34 The RNA-to-protein correlation of Glya to Ter119 (r = 0.56) was high, whereas Tfrc to CD71 (r = 0.41) was lower, as anticipated, as transferrin is a highly recycled protein.35 CD44 staining did not correlate with Cd44 expression (r = 0.15), indicating that Cd44 transcription decreases before or very early after erythroid commitment and protein levels and then decreases with successive cell divisions.33,36 (C) A plot of the Ter119 staining intensity of cells from wild-type mice identified 4 distinct cell groups, labeled A-D. This established the Ter119 staining intensity cutoffs that were then applied to cells isolated from Flvcr1-deleted and EPO-treated mice to identify developmentally equivalent cell groups in an unbiased manner. (D) Normalized Ter119 expression levels of individual cells from wild-type control, Flvcr1-deleted, and EPO-treated mice grouped A-D, using the cutoffs of panel C. Flvcr1-deleted cluster A cells are further separated into A (alive) and Ad (dying) subsets. Mean values ± SD are presented.
Early committed erythroid progenitors (BFU-E to basophilic erythroblasts) separate into 4 transcriptional groups correlating with Ter119 staining intensity. (A) Flow cytometry assessment of marrow cells from wild-type, Flvcr1-deleted, and EPO-treated mice. B220–Gr1–CD11b– marrow cells were divided into populations I-V as before.15,33 Single erythroid precursors from populations I and II were analyzed as described in the Materials and methods. In wild-type mice, the hemoglobin (HGB) equals 13.8 ± 0.7, and mean corpuscular volume (MCV) equals 44.8 ± 3.1; in Flvcr1-deleted mice, the HGB is 6.2 ± 1.3 and MCV is 72.2 ± 1.9, and in EPO-treated mice, the HGB is 15.9 ± 1.1 and MCV is 53.9 ± 0.9. The percentages of erythroid cells with given Ter119 intensities varied substantially; for example, Ter119neg cells comprised 0.93%, 4.39%, and 1.69% of cells from wild-type, Flvcr1-deleted, and EPO-treated mice, respectively. (B) Method validation. Transcription (RPKM) of α-globin (Hba-a1) closely correlated with β-globin (Hbb-bs) (r = 0.98), reflecting their coordinate regulation.34 The RNA-to-protein correlation of Glya to Ter119 (r = 0.56) was high, whereas Tfrc to CD71 (r = 0.41) was lower, as anticipated, as transferrin is a highly recycled protein.35 CD44 staining did not correlate with Cd44 expression (r = 0.15), indicating that Cd44 transcription decreases before or very early after erythroid commitment and protein levels and then decreases with successive cell divisions.33,36 (C) A plot of the Ter119 staining intensity of cells from wild-type mice identified 4 distinct cell groups, labeled A-D. This established the Ter119 staining intensity cutoffs that were then applied to cells isolated from Flvcr1-deleted and EPO-treated mice to identify developmentally equivalent cell groups in an unbiased manner. (D) Normalized Ter119 expression levels of individual cells from wild-type control, Flvcr1-deleted, and EPO-treated mice grouped A-D, using the cutoffs of panel C. Flvcr1-deleted cluster A cells are further separated into A (alive) and Ad (dying) subsets. Mean values ± SD are presented.
In vitro experiments
Marrow aspirates were obtained from healthy adults after written consent, as approved by the University of Washington Institutional Review Board. Lineage-negative (CD3–CD11b–CD19–) CD71+CD36+GlyA– or CD71+CD36+GlyA+ cells were sorted (antibodies in supplemental Table 1) as before4 and placed in Dulbecco’s modified Eagle medium (DMEM) with 10% fetal bovine serum. CD36 tracks equivalently to CD71 during erythropoiesis.27,28 K562 cells29 (ATCC) were placed in DMEM with 10% fetal bovine serum. UT7/EPO cells30 were maintained in DMEM with 10% fetal bovine serum and 2 U/mL EPO and cultured without EPO for 18 hours before analysis. Cells were treated with 0.5 mM 5-aminolevulinic acid (ALA), 5 U/mL EPO, or 10 to 50 μM hemin. For some studies, 0.5 mM succinylacetone was added (chemicals from Sigma-Aldrich). DMEM contains 24 μM iron, which is comparable to serum iron levels.
RNA, protein, heme, and ROS analysis
Total RNA was isolated and analyzed by quantitative polymerase chain reaction, using Actb as the reference gene.31 For western blot studies, cells were washed and samples of 105 cell equivalents were analyzed. Total cellular heme levels were measured according to established methods.15 Cellular ROS was measured with the in vitro ROS/RNS assay (STA-347, Cell Biolabs, Inc). The supplemental material contains additional details, including quantitative polymerase chain reaction probe set sequences and western blot antibodies (supplemental Table 2 and supplemental Materials and methods).
Statistical analysis
Transcriptome data are presented as mean ± standard deviation (SD) of biological replicates, whereas ex vivo treatment studies are presented as mean ± standard error of the mean (SEM). Significance testing was performed with 1-way ANOVA and post hoc Tukey’s test, or the Student t test (GraphPad Prism or Microsoft Excel 2010). P ≤ .05 was considered significant. Enrichment P values are reported for gene set enrichment analysis (GSEA).
Results
Coupling cell surface protein with transcriptome analyses in single cells is a reliable method
We performed single-cell RNAseq and cell surface protein analyses on erythroid precursors (BFU-E to basophilic erythroblasts) from Flvcr1-deleted, EPO-treated, and wild-type mice. All cells expressed CD71 and CD44 at high levels on their cell surface, whereas Ter119 ranged from negative to high. As expected, the number of cells with a given Ter119 expression level varied (Figure 1A), indicating that there were different proportions of earlier vs later precursors in each model. Whereas this cellular heterogeneity would bias transcriptional profiling using flow cytometrically defined subsets, single-cell-based analyses minimize this concern. We further validated our methods by comparing α-globin gene with β-globin gene expression (r = 0.98), Glya with Ter119 expression (r = 0.56), Tfrc with CD71 expression (r = 0.41), and Cd44 with CD44 expression (r = 0.15); results were as anticipated (Figure 1B).32
Because an initial principal component analysis (PCA) suggested that cell surface Ter119 intensity would provide an unbiased method of ordering differentiating cells (supplemental Figure 1), we used this to order wild-type cells. The density distribution plot (Figure 1C) identified 4 cell clusters, which we termed A (Ter119neg), B (Ter119lo), C (Ter119int), and D (Ter119hi). We then used these intensity cutoffs as the basis to cluster cells from Flvcr1-deleted and EPO-treated mice (Figure 1D). This ordering contrasts most prior studies in which erythroid precursors are arbitrarily divided into Ter119lo and Ter119hi populations.33,37 Linking the amount of Ter119 on each cell to its individual transcriptome allowed us to compare developmentally equivalent cells.
Approximately half of cluster A cells from the Flvcr1-deleted mice had hallmarks of impending cell death, such as low total RNA reads (∼20% of the average number of reads) and very low expression of housekeeping genes (eg, Actb, Gapdh, B2m, Gusb, Hprt). That half of cluster A cells from Flvcr1-deleted mice were dying (termed Ad, Figure 1D), but not cells in any other cluster from any mouse, confirmed our previous findings that Flvcr1 deletion results in CFU-E/proerythroblast cell death.15 These Ad cells were excluded from subsequent analyses.
Globin gene expression increased in successive clusters of all samples (Figure 2A), confirming that the Ter119-based clustering accurately identified sequential stages of erythroid differentiation. Because of their excess heme,8,15 cells from Flvcr1-deleted mice had higher overall levels of globin mRNA than cells from control mice. Despite good correlation of CD71 and Tfrc within each cell, CD71 expression was heterogeneous among cells within each cluster (supplemental Figure 2).
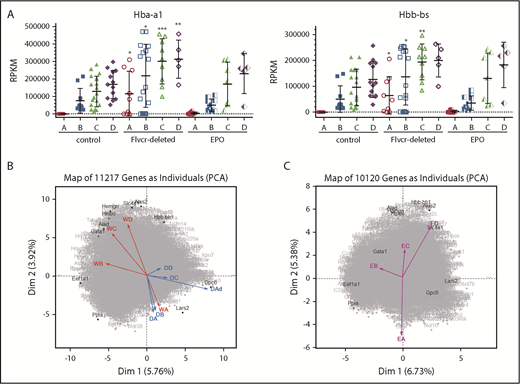
PCA reveals a distinct transcriptional program in cells from Flvcr1-deleted mice. (A) α-globin (Hba-a1, left) and β-globin (Hbb-bs, right) gene expression levels (RPKM) grouped by Ter119-based clusters (A-D) for each marrow sample. Cells from Flvcr1-deleted mice have significantly higher globin transcript levels than either control, showing that heme, but not EPO, increases globin transcription. Mean values ± SD are presented. Differences in gene expression levels between the cell clusters from wild-type control mice and Flvcr1-deleted or EPO-treated mice were identified by t test. *P ≤ .05; **P ≤ .01; ***P ≤ .001. (B) Two-component PCA of all gene expression with the mean gene expression trajectory of each cell cluster A-D shown as individual vectors for cell clusters from wild-type mice (indicated WA-WD) and Flvcr1-deleted mice (indicated DA-DD). Group A cells from both mice (WA and DA) are transcriptionally similar, as shown by their colocalization; however, their subsequent differentiation follows different trajectories. The erythroid cells from wild-type mice (WB to WD) progress clockwise, whereas cells from Flvcr1-deleted mice (DB to DD) progress counterclockwise. As anticipated, the dying cluster A cells (DAd) are transcriptionally distinct. Erythroid differentiation genes were generally distributed along the y-axis, whereas proliferation genes were generally distributed along the x-axis. Some genes with large projections are identified. (C) An independent 2-component PCA of cell clusters from EPO-treated mice (indicated EA-ED) shows that the erythroid differentiation of these clusters tracks comparably to clusters from wild-type mice (WA-WD). The same genes are highlighted as in panel B to facilitate comparison. Together, the analyses show that erythroid cells from wild-type and EPO-treated mice are transcriptionally similar throughout differentiation, whereas the transcriptional profile of erythroid cells from Flvcr1-deleted mice differs from both controls.
PCA reveals a distinct transcriptional program in cells from Flvcr1-deleted mice. (A) α-globin (Hba-a1, left) and β-globin (Hbb-bs, right) gene expression levels (RPKM) grouped by Ter119-based clusters (A-D) for each marrow sample. Cells from Flvcr1-deleted mice have significantly higher globin transcript levels than either control, showing that heme, but not EPO, increases globin transcription. Mean values ± SD are presented. Differences in gene expression levels between the cell clusters from wild-type control mice and Flvcr1-deleted or EPO-treated mice were identified by t test. *P ≤ .05; **P ≤ .01; ***P ≤ .001. (B) Two-component PCA of all gene expression with the mean gene expression trajectory of each cell cluster A-D shown as individual vectors for cell clusters from wild-type mice (indicated WA-WD) and Flvcr1-deleted mice (indicated DA-DD). Group A cells from both mice (WA and DA) are transcriptionally similar, as shown by their colocalization; however, their subsequent differentiation follows different trajectories. The erythroid cells from wild-type mice (WB to WD) progress clockwise, whereas cells from Flvcr1-deleted mice (DB to DD) progress counterclockwise. As anticipated, the dying cluster A cells (DAd) are transcriptionally distinct. Erythroid differentiation genes were generally distributed along the y-axis, whereas proliferation genes were generally distributed along the x-axis. Some genes with large projections are identified. (C) An independent 2-component PCA of cell clusters from EPO-treated mice (indicated EA-ED) shows that the erythroid differentiation of these clusters tracks comparably to clusters from wild-type mice (WA-WD). The same genes are highlighted as in panel B to facilitate comparison. Together, the analyses show that erythroid cells from wild-type and EPO-treated mice are transcriptionally similar throughout differentiation, whereas the transcriptional profile of erythroid cells from Flvcr1-deleted mice differs from both controls.
We next used 2-component PCA to map the mean expression of all genes in each cluster of cells onto the 2-component plane of all gene expression. Although gene expression in cluster A cells was comparable for cells from wild-type, Flvcr1-deleted, and EPO-treated mice, the cells from Flvcr1-deleted mice followed a different developmental trajectory than cells from both control mice (Figure 2B-C). This implied that heme differentially regulated erythroid cell differentiation, and that pathway analyses should be informative.
GSEA identifies pathways altered by heme in Flvcr1-deleted cells
When we analyzed our data using GSEA, with more than 40 000 pathways and gene sets,38-40 most pathways and gene sets (eg, myogenesis, myc targets, p53 pathway) were unaltered (supplemental Figure 3). However, there was substantial upregulation (enrichment) of the ribosome pathway41 in Flvcr1-deleted cells relative to control samples (Figure 3A). This pathway was actually the most upregulated gene set in Flvcr1-deleted cells, an initially unexpected result.
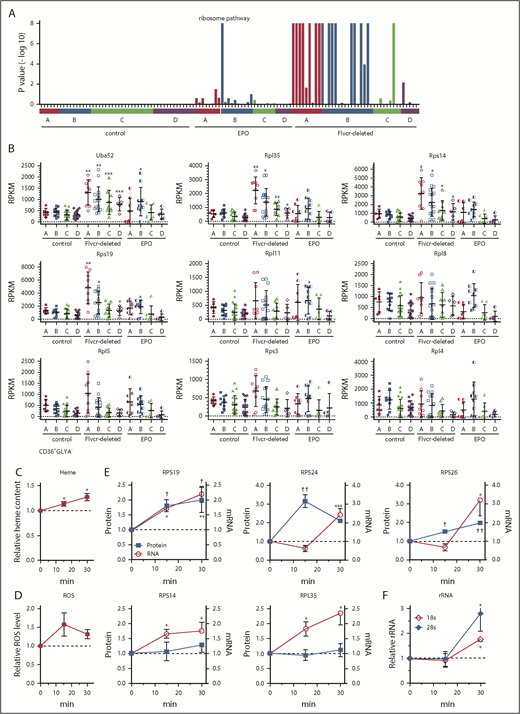
Heme increases ribosomal protein content in early erythroid cells. (A) GSEA enrichment plot of the KEGG ribosome pathway. Nominal P values for individual cells in clusters A-D of wild-type control, EPO-treated, and Flvcr1-deleted mice are shown. (B) Transcript expression levels (RPKM) of ribosomal protein genes. Mean values ± SD for each cluster are graphed. Differences in gene expression levels between the cell clusters from wild-type control mice and Flvcr1-deleted or EPO-treated mice were identified by t test. (C-F) Studies in early human erythroid cells (CD36+GlyA–) treated with or without 0.5 mM ALA for up to 30 minutes. ALA rapidly increases intracellular heme content (C), resulting in elevated ROS (D) and the increased expression of RPS19, RPS24, and RPS26 protein and mRNA (E). Representative western blots are in supplemental Figure 5. Levels of 18s and 28s rRNA also increase (F). The expression levels of experimental samples were normalized relative to the untreated control samples collected at the same time. Mean values ± SEM for 3 to 4 independent studies are shown. Differences relative to untreated (T0) were evaluated by 1-way ANOVA with a post hoc Tukey’s test. *(mRNA) or †(protein) P ≤ .05; ** or ††P ≤ .01; ***P ≤ .001.
Heme increases ribosomal protein content in early erythroid cells. (A) GSEA enrichment plot of the KEGG ribosome pathway. Nominal P values for individual cells in clusters A-D of wild-type control, EPO-treated, and Flvcr1-deleted mice are shown. (B) Transcript expression levels (RPKM) of ribosomal protein genes. Mean values ± SD for each cluster are graphed. Differences in gene expression levels between the cell clusters from wild-type control mice and Flvcr1-deleted or EPO-treated mice were identified by t test. (C-F) Studies in early human erythroid cells (CD36+GlyA–) treated with or without 0.5 mM ALA for up to 30 minutes. ALA rapidly increases intracellular heme content (C), resulting in elevated ROS (D) and the increased expression of RPS19, RPS24, and RPS26 protein and mRNA (E). Representative western blots are in supplemental Figure 5. Levels of 18s and 28s rRNA also increase (F). The expression levels of experimental samples were normalized relative to the untreated control samples collected at the same time. Mean values ± SEM for 3 to 4 independent studies are shown. Differences relative to untreated (T0) were evaluated by 1-way ANOVA with a post hoc Tukey’s test. *(mRNA) or †(protein) P ≤ .05; ** or ††P ≤ .01; ***P ≤ .001.
Heme increases the expression of nearly all ribosomal protein genes
The increase in ribosomal pathway transcripts was most pronounced in clusters A and B (Figure 3A), and was driven by increased ribosomal protein gene expression (Figure 3B), suggesting that early erythroid precursors preferentially upregulated ribosomal proteins in response to heme. Of the 86 cellular ribosomal protein genes in the KEGG ribosome pathway,41 73 were significantly upregulated and only 1 was significantly downregulated (supplemental Table 3). Notably, of the 17 ribosomal protein genes linked to DBA16 or MDS,17 only Rpl5 was not significantly upregulated in the Flvcr1-deleted cells vs control cells. Although nearly all ribosomal protein genes were markedly upregulated, heme’s effect on ribosome maturation, mRNA processing, and translation genes was variable (supplemental Figure 4).
To confirm that heme, and not another unappreciated abnormality in Flvcr1-deleted early erythroid cells, increased ribosomal protein gene expression, we amplified heme synthesis in early (CD71+CD36+GlyA–) human marrow erythroid cells by treating them with ALA to bypass the rate-limiting step (ALAS2). Because normal marrow cells have intact FLVCR and intact globin transcription and translation, they can quickly adapt to the extra heme, so we focused on changes occurring within 15 to 30 minutes after ALA was added. Within 15 minutes, heme content and ROS increased (Figure 3C-D). By 30 minutes, the expression of ribosomal protein genes and ribosomal proteins RPS19, RPS24, and RPS26 increased (Figure 3E; supplemental Figure 5). Gene expression increased before protein expression, as expected. The quantities of immature (unspliced) RNAs also increased within 15 minutes (supplemental Figure 6), indicating that the increases likely resulted from de novo mRNA synthesis. Later erythroid cells (CD71+CD36+GlyA+) were not responsive (supplemental Figure 7), as anticipated from the murine RNAseq data in Figure 3A. Adding EPO (5 U/mL) failed to induce comparable changes (supplemental Figure 8), also as anticipated.
In addition, treating early (CD71+CD36+GlyA–) human marrow erythroid cells with ALA increased rRNA (Figure 3F). Thus, not only are ribosomal protein genes and ribosomal proteins upregulated, but rRNAs also increase, indicating that ribosome numbers increase when heme increases. As our RNAseq method relies on polyA tracts for priming, the inefficient capture of rRNA that lacks polyA tails compromised our ability to quantitate rRNA in single mouse cells. Nonetheless, all 3 rRNA species (5.8s, 18s, and 28s) were increased in cluster A and B cells from Flvcr1-deleted mice relative to controls (supplemental Figure 9). That heme quickly upregulates ribosomal protein gene and rRNA expression early in erythroid differentiation likely ensures that there are sufficient numbers of ribosomes to efficiently translate the rapidly increasing quantities of globin mRNA.
Heme regulates heme biosynthetic enzyme and Gata1 gene expression
The hallmark heme metabolism gene set, which consists of 200 genes involved in erythroid differentiation and heme biosynthesis, was the most downregulated pathway identified by GSEA, with 130 downregulated genes in Flvcr1-deleted mice relative to control mice (supplemental Table 4). Although there was an increase in the expression of pathway genes in cluster A cells, this was offset by low gene expression later in erythropoiesis (ie, in clusters B-D) (Figure 4A). The 2 most reduced genes in this pathway were the heme biosynthetic enzyme Hmbs (hydroxymethylbilane synthase, also known as porphobilinogen deaminase) and the critical erythroid transcription factor Gata1 (67% reduction), a second unanticipated observation. Other erythroid transcription factors such as Klf1 and Nfe2 were also reduced in clusters B-D, but not to the same extent as Gata1 (Figure 4B; supplemental Figure 10; supplemental Table 4).
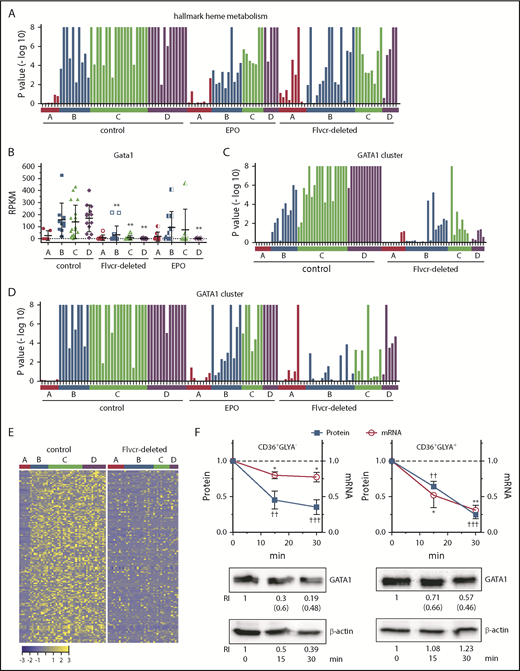
Heme regulates both GATA1 mRNA and protein in erythroid cells. (A) GSEA enrichment plot of the hallmark heme metabolism pathway. Nominal P values for individual cells in clusters A-D of wild-type control, EPO-treated, and Flvcr1-deleted mice are shown. The hallmark heme metabolism pathway includes genes involved in both erythroid differentiation and heme synthesis. (B) Transcript expression levels (RPKM) of Gata1. Mean values ± SD for each cluster are graphed. Differences in gene expression levels between the cell clusters from wild-type control mice and Flvcr1-deleted or EPO-treated mice were identified by t test. (C-D) GSEA enrichment plots of genes in the GATA1 cluster (supplemental Table 5). Nominal P values for individual cells in clusters A-D of wild-type and Flvcr1-deleted mice (C) or cells in clusters A-D from wild-type, EPO-treated, and Flvcr1-deleted mice (D) are shown. GSEA is a nondeterminant method that calculates the reference baseline from all cells in the analysis. This reference baseline varies depending on the cells that are included. Inclusion of the cells from EPO-treated mice thus alters the GSEA reference baseline, which increases the nominal P value for many individual cells when panel D is compared with panel C. Cells from the Flvcr1-deleted mice show significantly less upregulation of GATA1 cluster genes than cells from either wild-type or EPO-treated mice. (E) Heat map showing changes in expression of GATA1 cluster genes. Log2 transformed relative expression levels of each of the 150 genes in the GATA1 cluster in individual cells grouped by cluster A-D isolated from either wild-type control or Flvcr1-deleted mice. (F) Studies in early (CD36+GlyA–) and intermediate-late (CD36+GlyA+) human erythroid cells treated with or without 0.5 mM ALA for up to 30 minutes. GATA1 protein and mRNA concurrently decrease within 15 minutes after adding ALA. Representative western blot images are below (RI, relative band intensity; in parenthesis are the values normalized to actin). Normalized expression levels are presented relative to untreated samples collected at the same time. Western blot band intensities were within the linear sensitivity range of the digital detection system. Additional representative blots are in supplemental Figure 12. This time course is informative, as these normal human erythroid marrow cells express FLVCR and will export excess heme induced by ALA treatment, effectively restoring homeostasis without affecting cell viability. Because of this, we limited these studies to 30 minutes or less. Data are presented as mean values ± SEM of 3 to 6 independent experiments. Differences relative to untreated (T0) were evaluated by 1-way ANOVA with the post hoc Tukey’s test. *(mRNA) P ≤ .05; ** or ††(protein) P ≤ .01; †††P ≤ .001.
Heme regulates both GATA1 mRNA and protein in erythroid cells. (A) GSEA enrichment plot of the hallmark heme metabolism pathway. Nominal P values for individual cells in clusters A-D of wild-type control, EPO-treated, and Flvcr1-deleted mice are shown. The hallmark heme metabolism pathway includes genes involved in both erythroid differentiation and heme synthesis. (B) Transcript expression levels (RPKM) of Gata1. Mean values ± SD for each cluster are graphed. Differences in gene expression levels between the cell clusters from wild-type control mice and Flvcr1-deleted or EPO-treated mice were identified by t test. (C-D) GSEA enrichment plots of genes in the GATA1 cluster (supplemental Table 5). Nominal P values for individual cells in clusters A-D of wild-type and Flvcr1-deleted mice (C) or cells in clusters A-D from wild-type, EPO-treated, and Flvcr1-deleted mice (D) are shown. GSEA is a nondeterminant method that calculates the reference baseline from all cells in the analysis. This reference baseline varies depending on the cells that are included. Inclusion of the cells from EPO-treated mice thus alters the GSEA reference baseline, which increases the nominal P value for many individual cells when panel D is compared with panel C. Cells from the Flvcr1-deleted mice show significantly less upregulation of GATA1 cluster genes than cells from either wild-type or EPO-treated mice. (E) Heat map showing changes in expression of GATA1 cluster genes. Log2 transformed relative expression levels of each of the 150 genes in the GATA1 cluster in individual cells grouped by cluster A-D isolated from either wild-type control or Flvcr1-deleted mice. (F) Studies in early (CD36+GlyA–) and intermediate-late (CD36+GlyA+) human erythroid cells treated with or without 0.5 mM ALA for up to 30 minutes. GATA1 protein and mRNA concurrently decrease within 15 minutes after adding ALA. Representative western blot images are below (RI, relative band intensity; in parenthesis are the values normalized to actin). Normalized expression levels are presented relative to untreated samples collected at the same time. Western blot band intensities were within the linear sensitivity range of the digital detection system. Additional representative blots are in supplemental Figure 12. This time course is informative, as these normal human erythroid marrow cells express FLVCR and will export excess heme induced by ALA treatment, effectively restoring homeostasis without affecting cell viability. Because of this, we limited these studies to 30 minutes or less. Data are presented as mean values ± SEM of 3 to 6 independent experiments. Differences relative to untreated (T0) were evaluated by 1-way ANOVA with the post hoc Tukey’s test. *(mRNA) P ≤ .05; ** or ††(protein) P ≤ .01; †††P ≤ .001.
Studies of heme’s effect on GATA1 and GATA1-dependent gene expression
To determine whether the reduction in Gata1 expression in Flvcr1-deleted cells was physiologically relevant, we used coupled 2-way clustering analysis42 and identified 150 genes that were coordinately downregulated with Gata1 (supplemental Table 5). This subset included 73 known GATA1-target genes,43 and importantly, their pattern of expression mimicked that of GATA1 (Figure 4B-E). Also, in independent microarray experiments, we confirmed that the low level of Gata1 and GATA1-target gene expression that we observed in cluster B-D cells should be capable of impeding erythroid differentiation (supplemental Figure 11).
Although low GATA1 in Flvcr1-deleted cluster B-D cells was the most statistically significant finding (Figure 4B), the low GATA1 target gene expression was more visually apparent when the data from EPO-treated mice were omitted from (Figure 4C), rather than included in (Figure 4D), the GSEA calculations. This is because EPO increases Tfrc/CD71 expression,44,45 which increases iron uptake and heme synthesis. EPO also increases GATA1 activity without affecting GATA1 protein levels.46,47 Therefore, we expected that EPO treatment would blunt findings, especially later in erythropoiesis (clusters B-D), as its effect on heme is indirect.
To confirm that heme decreased GATA1 and its targets directly and independently of EPO, we amplified endogenous heme synthesis in early (CD71+CD36+GlyA–) and later (CD71+CD36+GlyA+) human marrow erythroid cells by adding ALA and observing outcomes over the course of 30 minutes. Within 15 minutes, both GATA1 mRNA and protein decreased (Figure 4F; supplemental Figure 12). In contrast, treating human marrow erythroid cells with EPO failed to decrease GATA1 mRNA or protein (supplemental Figure 13).
That GATA1 protein and mRNA dropped quickly and simultaneously (Figure 4F) raised the possibility that heme directly decreased GATA1 protein, as well as GATA1 mRNA abundance. GATA1 expression is autoregulatory.48 Thus, disruption of either protein or transcript levels would result in the loss of GATA1 and GATA1-target gene expression. Interestingly, treatment of primary mouse erythroblasts with ALA decreased Gata1 mRNA first, and GATA1 protein decreased afterward (supplemental Figure 14). Recent data in human cells suggest that heme accelerates GATA1 degradation by displacing it from HSP70 protection.49,50 This would be analogous to how heme regulates HIF1α degradation via HSP90.51 That human, but not mouse, GATA1 contains a caspase cleavage site that is cleaved when GATA1 is not protected by HSP7050,52,53 might explain the different kinetics of GATA1 suppression that we observed in the human vs murine studies.
Studies in K562 and UT7/EPO cell lines
Because only limited numbers of erythroid cells can be isolated from marrow aspirates of human volunteers, we used K562 and UT7/EPO cells (cell lines of human origin) to provide additional insights. After treating K562 cells with ALA, total heme content, ROS, and globin protein increased within 15 minutes, and there was a concurrent rapid reduction in GATA1 protein, just as observed in primary human cells. All changes were ablated when the K562 cells were simultaneously given succinylacetone, a competitive inhibitor of the second step of the heme synthetic pathway (ALA bypasses the first and rate-limiting step; Figure 5A-B).
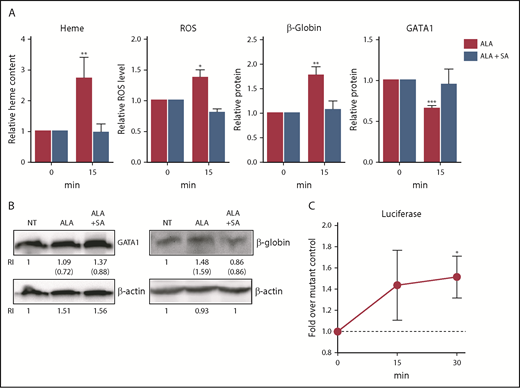
Heme synthesis rapidly downregulates GATA1 and upregulates β-globin in K562 cells. (A) K562 cells were treated with or without 0.5 mM ALA or ALA and 0.5 mM succinylacetone and analyzed for heme content, ROS levels, GATA1 protein, and β-globin protein content. Normalized expression levels are presented relative to untreated samples collected at the same time. As expected, within 15 minutes after ALA addition, heme content, ROS and β-globin protein increased and GATA1 protein decreased. These changes fail to occur when ALA (which bypasses the first step in heme synthesis) and succinylacetone (which blocks the second step in heme synthesis) were both added, thus demonstrating that the outcomes are heme-dependent. (B) Representative western blots for GATA1 and β-globin protein quantitation (RI, relative band intensity; in parenthesis are the values normalized to actin) at 15 minutes. NT, no treatment. An additional representative blot is in supplemental Figure 16. (C) K562 cells transduced with a heme reporter construct containing wild-type β-globin enhancer and promoter elements driving luciferase or a negative control construct containing mutant MARE elements8 were treated with 0.5 mM ALA for up to 30 minutes and assayed for luciferase expression. Luciferase expression is a measure of regulatory heme, as it quantitates heme-dependent transcription. Relative luciferase levels are presented as fold over the negative control construct harvested at the same time. All data are presented as mean values ± SEM of 3 to 4 independent experiments. Differences relative to untreated (T0) samples were identified by t test analysis. *P ≤ .05; **P ≤ .01; ***P ≤ .001.
Heme synthesis rapidly downregulates GATA1 and upregulates β-globin in K562 cells. (A) K562 cells were treated with or without 0.5 mM ALA or ALA and 0.5 mM succinylacetone and analyzed for heme content, ROS levels, GATA1 protein, and β-globin protein content. Normalized expression levels are presented relative to untreated samples collected at the same time. As expected, within 15 minutes after ALA addition, heme content, ROS and β-globin protein increased and GATA1 protein decreased. These changes fail to occur when ALA (which bypasses the first step in heme synthesis) and succinylacetone (which blocks the second step in heme synthesis) were both added, thus demonstrating that the outcomes are heme-dependent. (B) Representative western blots for GATA1 and β-globin protein quantitation (RI, relative band intensity; in parenthesis are the values normalized to actin) at 15 minutes. NT, no treatment. An additional representative blot is in supplemental Figure 16. (C) K562 cells transduced with a heme reporter construct containing wild-type β-globin enhancer and promoter elements driving luciferase or a negative control construct containing mutant MARE elements8 were treated with 0.5 mM ALA for up to 30 minutes and assayed for luciferase expression. Luciferase expression is a measure of regulatory heme, as it quantitates heme-dependent transcription. Relative luciferase levels are presented as fold over the negative control construct harvested at the same time. All data are presented as mean values ± SEM of 3 to 4 independent experiments. Differences relative to untreated (T0) samples were identified by t test analysis. *P ≤ .05; **P ≤ .01; ***P ≤ .001.
To more precisely quantitate regulatory heme (ie, heme available to promote transcription), we transduced the K562 cells either with a reporter construct in which tandem Maf recognition (MARE) elements (Bach1 binding sites) of the globin locus control region were linked to luciferase, or with a control construct in which the MARE elements were mutated, prohibiting Bach1 binding and eliminating heme responsiveness.4,8 ALA quickly increased luciferase expression by releasing Bach1 inhibition in the cells transduced with the intact MARE elements, but not with the mutated MARE elements (Figure 5C). Thus, not only does heme content (measured by the oxalate method) increase after ALA is added, but also regulatory “free” heme quickly increases.
The addition of exogenous heme to K562 cells comparably increased the cells’ heme content, but interestingly, this failed to activate the reporter construct. Also, it took 4 hours for GATA1 protein levels to fall after hemin was added to the media (supplemental Figure 15). We suspect that this reflects the time needed for heme to traffic from endosome to cytosol. This suggests that heme synthesized in, and then exported from, mitochondria (and not extracellular heme) regulates immediate cell fate decisions.
Although increased heme synthesis in K562 rapidly decreased GATA1, we did not observe decreased GATA1 after treatment with EPO (supplemental Figure 16). Although an expected result, K562 cells have relatively few EPO receptors and respond poorly to EPO.54 Therefore, we confirmed this finding by studying UT7 and UT7/EPO cells, an EPO-dependent and responsive subline (supplemental Figure 16).
Heme downregulates mitotic spindle gene expression
As macrocytosis also characterizes anemias resulting from vitamin B12 deficiency, folate deficiency, and drugs such as hydroxyurea, we wondered whether heme might affect DNA synthesis or another aspect of cell replication, surveyed the relevant GSEA, and noted that hallmark mitotic spindle genes40 were significantly reduced in cells from Flvcr1-deleted mice (supplemental Figure 17; supplemental Table 6). In support of these findings, mitotic spindle pathway genes were downregulated by ALA treatment of the K562 cells (supplemental Figure 18). If excess heme slowed mitosis, and thus cell division, this would help explain the macrocytosis both of Flvcr1-deleted mice14 and of patients with DBA and patients with del(5q) MDS, and also the increased ploidy in Flvcr1-deleted megakaryocytes.55
Heme-induced erythroid cell death is independent of p53
In DBA and del(5q) MDS, the imbalance that ensues from the inadequate production of 1 ribosomal protein can increase p53 activity, contributing to erythroid cell demise.16,56-58 Interestingly, our GSEA analyses did not find p53 pathway upregulation in Flvcr1-deleted cells (supplemental Figure 3). Because these cells have excess heme but no ribosomal protein gene mutations, heme-induced erythroid cell death appeared independent of p53 pathway activation. Genetic studies confirmed this finding and showed that p53 does not contribute to the erythroid failure in Flvcr1-deleted mice (Figure 6).
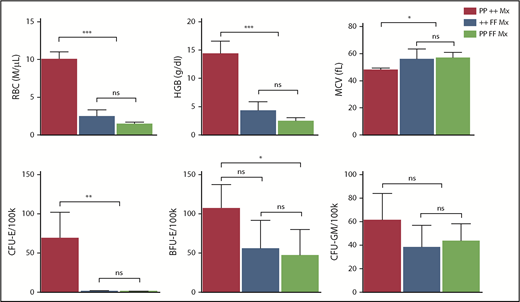
Erythroid failure caused by excess heme is independent of p53. Peripheral blood analysis of RBC, HGB, MCV, and marrow colony assays of CFU-E, BFU-E, or CFU-GM from control Trp53-null (PP ++ Mx, N = 5), Flvcr1-deleted (++ FF Mx, N = 4), or double-mutant (PP FF Mx, N = 4) mice. There was no improvement in any erythroid parameter in mice lacking both p53 and FLVCR1 compared with those only lacking FLVCR1. Analysis of 130 embryos from Flvcr1:Trp53 double-mutant breeding did not reveal any double Flvcr1-null Trp53-null embryos, whereas Trp53-null embryos were present at the expected frequency. Flvcr1-null embryos die because of failed erythropoiesis,14 and this further demonstrates that erythroid failure in mice lacking FLVCR is independent of p53. Data are presented as mean values ± SD. Differences relative to wild-type control (PP ++ Mx) mice were evaluated by 1-way ANOVA with the post hoc Tukey’s test. *P ≤ .05; **P ≤ .01; ***P ≤ .001.
Erythroid failure caused by excess heme is independent of p53. Peripheral blood analysis of RBC, HGB, MCV, and marrow colony assays of CFU-E, BFU-E, or CFU-GM from control Trp53-null (PP ++ Mx, N = 5), Flvcr1-deleted (++ FF Mx, N = 4), or double-mutant (PP FF Mx, N = 4) mice. There was no improvement in any erythroid parameter in mice lacking both p53 and FLVCR1 compared with those only lacking FLVCR1. Analysis of 130 embryos from Flvcr1:Trp53 double-mutant breeding did not reveal any double Flvcr1-null Trp53-null embryos, whereas Trp53-null embryos were present at the expected frequency. Flvcr1-null embryos die because of failed erythropoiesis,14 and this further demonstrates that erythroid failure in mice lacking FLVCR is independent of p53. Data are presented as mean values ± SD. Differences relative to wild-type control (PP ++ Mx) mice were evaluated by 1-way ANOVA with the post hoc Tukey’s test. *P ≤ .05; **P ≤ .01; ***P ≤ .001.
Discussion
Erythropoiesis follows a tightly regulated path that remains incompletely understood. Single-cell transcriptomics has emerged as a powerful tool to unravel developmental trajectories.59-61 Here, we analyzed erythroid cells from Flvcr1-deleted mice. Flvcr1-deleted mice provide a unique tool to study the effect of heme on erythropoiesis, as their only defect is an inability to export intracellular heme. Heme accumulates in CFU-E/proerythroblasts and subsequent erythroid cells,15 so one can study its actions. We ordered individual cells by surface protein (Ter119) expression and then analyzed their total transcriptome. GSEA of more than 40 000 gene sets identified the ribosome pathway and the hallmark heme metabolism pathway as the most upregulated and downregulated pathways, respectively. From this unbiased analysis, we derived new insights into how heme facilitates, and excess heme impairs, red cell differentiation.
Our studies demonstrate that heme upregulates the expression of most ribosomal protein genes during early murine (Figures 3A-B; supplemental Table 3) and early human (Figures 3E) erythropoiesis. This should ensure that ample ribosomes for globin translation are available. The upregulation occurs quickly and likely reflects de novo mRNA synthesis (supplemental Figure 6). Increases in rRNA are matched by increases in ribosomal protein levels (Figure 3E-F; supplemental Figure 9), indicating ribosomal content is increased. HRI is known to downregulate mTORC1 under iron-limiting (low heme) conditions.62 Possibly, heme prevents this HRI-dependent downregulation thus increasing mTORC1 activity and increasing ribosome biogenesis.63-65
Heme and GATA1 then cooperate and coamplify erythroid differentiation.7,22-25 As cells divide, cell surface FLVCR1 dilutes. It is low or absent during the late stages of normal erythroid differentiation, so heme again accumulates. Our data show that this decreases mitotic spindle gene expression (supplemental Figures 17 and 18; supplemental Table 6), which should slow cell division, and downregulates GATA1 (Figures 4-5), which would end the erythroid differentiation program. That GATA1 and GATA1-target gene expression must be turned off for red cell differentiation to successfully terminate is demonstrated in murine studies in which GATA1 is constitutively expressed as a transgene.66
Our studies also provide insights into the macrocytosis and anemia of Flvcr1-deleted mice. Excess heme accumulates in early erythroid precursors because heme export is infeasible.13,14 Decreased mitotic spindle gene expression could slow cell division while cytoplasmic maturation and hemoglobinization proceeds, leading to larger (macrocytic) cells. Heme via the HRI axis may also contribute to the macrocytosis.67 As red cells require a set hemoglobin concentration (to optimize tissue oxygen delivery), it seems likely that there are many (redundant) mechanisms to increase red cell size when heme (and hence hemoglobin) is plentiful. The excess CFU-E/proerythroblast heme would also prematurely downregulate GATA1, contributing to the ineffective erythropoiesis and severe anemia.
Importantly, our findings also provide insights into the pathogenesis of DBA and del(5q) MDS, given their convergent physiology with Flvcr1-deleted mice. As we previously demonstrated, impaired protein translation amplifies heme accumulation in CFU-E/proerythroblasts to cause their apoptotic and ferroptotic cell death.4 Here, we describe 3 additional ways that excessive heme may contribute: increasing ribosomal protein expression could amplify ribosomal protein imbalance, further increasing p53-mediated cell death56-58 ; decreasing mitotic spindle gene expression could slow cell division; and the early suppression of GATA1 could prematurely terminate the erythroid program. Data from Ludwig et al68 and Khajuria et al21 are consistent with this latter mechanism.
In addition to mutations in ribosomal proteins, a few DBA cases have been linked to mutations in GATA1 that result in preferential expression of a short isoform that lacks the transactivation domain.69-71 Our observation that excess heme prematurely downregulates GATA1 explains why the clinical phenotype in children with GATA1 mutations is similar, but not identical, to that of ribosomal protein mutations.58,68,72 Also, as GATA1 is needed for heme biosynthetic enzymes gene expression,7 heme and heme targets are not elevated in this setting.72
Together, as diagrammed in Figure 7, our findings provide a comprehensive paradigm to explain the mechanisms regulating normal erythropoiesis and argue that excess heme is the factor driving the ineffective erythropoiesis of DBA and del(5q) MDS.
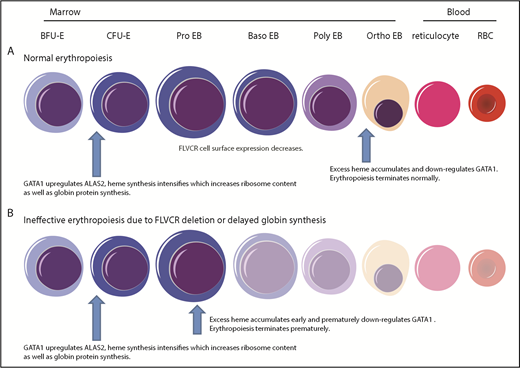
Model describing how heme and GATA1 might coordinately regulate erythroid differentiation. (A) Normal erythropoiesis and (B) erythropoiesis in Flvcr1-deleted mice, patients with DBA, and patients with del(5q) MDS. When erythropoiesis begins, GATA1 upregulates ALAS2 and heme synthesis intensifies. Heme and GATA1 then coregulate erythroid gene expression and differentiation. During normal erythropoiesis (A), heme accumulates late when FLVCR is low. This excessive heme downregulates GATA1 and mitotic spindle proteins to ensure red cell differentiation terminates appropriately. In the absence of FLVCR (B), the quantity of heme exceeds the capacity of globin and other metabolic needs during the CFU-E/proerythroblast stage. This excessive heme then prematurely downregulates GATA1 and mitotic spindle proteins, prematurely terminating differentiation. Effective erythropoiesis requires the quick and efficient upregulation of heme and the facile coordination of heme with globin. In DBA, del(5q) MDS, and potentially other disorders in which protein synthesis is decreased (also B), heme synthesis likewise exceeds the capacity of globin and other hemoproteins in CFU-E/proerythroblasts. This also leads to the premature termination of erythropoiesis, and a clinical phenotype similar to Flvcr1-deleted mice. EB, erythroblast. This figure was illustrated with the Biology PPT Drawing Toolkit (Motifolio Inc).
Model describing how heme and GATA1 might coordinately regulate erythroid differentiation. (A) Normal erythropoiesis and (B) erythropoiesis in Flvcr1-deleted mice, patients with DBA, and patients with del(5q) MDS. When erythropoiesis begins, GATA1 upregulates ALAS2 and heme synthesis intensifies. Heme and GATA1 then coregulate erythroid gene expression and differentiation. During normal erythropoiesis (A), heme accumulates late when FLVCR is low. This excessive heme downregulates GATA1 and mitotic spindle proteins to ensure red cell differentiation terminates appropriately. In the absence of FLVCR (B), the quantity of heme exceeds the capacity of globin and other metabolic needs during the CFU-E/proerythroblast stage. This excessive heme then prematurely downregulates GATA1 and mitotic spindle proteins, prematurely terminating differentiation. Effective erythropoiesis requires the quick and efficient upregulation of heme and the facile coordination of heme with globin. In DBA, del(5q) MDS, and potentially other disorders in which protein synthesis is decreased (also B), heme synthesis likewise exceeds the capacity of globin and other hemoproteins in CFU-E/proerythroblasts. This also leads to the premature termination of erythropoiesis, and a clinical phenotype similar to Flvcr1-deleted mice. EB, erythroblast. This figure was illustrated with the Biology PPT Drawing Toolkit (Motifolio Inc).
The online version of this article contains a data supplement.
The publication costs of this article were defrayed in part by page charge payment. Therefore, and solely to indicate this fact, this article is hereby marked “advertisement” in accordance with 18 USC section 1734.
Acknowledgments
The authors thank Sergei Doulatov for critical review and comments of this manuscript, Emery Bresnick for his insights into GATA1 function and regulation, Changting Meng for assisting with GSEA analysis and related discussions, and Boaz Levi for the use of the Fluidigm C1 system at the Allen Institute for Brain Science. This work was supported by National Institutes of Health, National Heart, Lung, and Blood Institute grant HL031823 (J.L.A.) and National Cancer Institute grant CA190122 (Q.T.). Flow cytometry and cell sorting were performed at the University of Washington Department of Pathology and Department of Immunology flow cytometry core facilities. Illumina sequencing was performed at the Institute for Systems Biology molecular core facility. Microarray analysis was performed at the Fred Hutchinson Cancer Research Center genomics core facility. Human bone marrow samples were obtained at the University of Washington Clinical Research Center (supported by National Center for Advancing Translational Sciences of the National Institutes of Health, award number UL1TR000423).
Authorship
Contribution: R.T.D. conceived, designed, and conducted experiments; collected and analyzed data; and wrote the manuscript; X.Y. performed the data curation and bioinformatics analysis; A.D.M., Z.Y., D.Y., N.J., and L.L. conducted experiments and analyzed data; C.L. and S.B.K. designed and conducted experiments and analyzed data; and Q.T. and J.L.A. conceived and designed experiments, reviewed and analyzed data, and wrote the manuscript.
Conflict-of-interest disclosure: The authors declare no competing financial interests.
Correspondence: Janis L. Abkowitz, Division of Hematology, Department of Medicine, University of Washington School of Medicine, Health Sciences Building, Seattle WA 98195; e-mail: janabk@u.washington.edu; Qiang Tian, Institute for Systems Biology, 401 Terry Ave North, Seattle WA 98109; e-mail: qiang.tian@systemsbiology.org.

This feature is available to Subscribers Only
Sign In or Create an Account Close Modal