

Key Points
Ibrutinib/methotrexate/rituximab combination treatment is safe and shows promising clinical activity in CNSL.
Analysis of ctDNA in CSF may be useful to monitor disease burden in patients with CNSL.

Abstract
Ibrutinib is a first-in-class inhibitor of Bruton tyrosine kinase (BTK) and has shown single-agent activity in recurrent/refractory central nervous system (CNS) lymphoma. Clinical responses are often transient or incomplete, suggesting a need for a combination therapy approach. We conducted a phase 1b clinical trial to explore the sequential combination of ibrutinib (560 or 840 mg daily dosing) with high-dose methotrexate (HD-MTX) and rituximab in patients with CNS lymphoma (CNSL). HD-MTX was given at 3.5 g/m2 every 2 weeks for a total of 8 doses (4 cycles; 1 cycle = 28 days). Ibrutinib was held on days of HD-MTX infusion and resumed 5 days after HD-MTX infusion or after HD-MTX clearance. Single-agent daily ibrutinib was administered continuously after completion of induction therapy until disease progression, intolerable toxicity, or death. We also explored next-generation sequencing of circulating tumor DNA (ctDNA) in cerebrospinal fluid (CSF) before and during treatment. The combination of ibrutinib, HD-MTX, and rituximab was tolerated with an acceptable safety profile (no grade 5 events, 3 grade 4 events). No dose-limiting toxicity was observed. Eleven of 15 patients proceeded to maintenance ibrutinib after completing 4 cycles of the ibrutinib/HD-MTX/rituximab combination. Clinical responses occurred in 12 of 15 patients (80%). Sustained tumor responses were associated with clearance of ctDNA from the CSF. This trial was registered at www.clinicaltrials.gov as #NCT02315326.
Introduction
Primary central nervous system lymphoma (PCNSL) is a rare and aggressive subtype of diffuse large B-cell lymphoma (DLBCL) that manifests exclusively in the central nervous system (CNS). The incidence of this disease has been increasing over the last decade.1 Standard induction treatment of PCNSL in most reported single-arm or randomized trials includes high-dose methotrexate (HD-MTX)–based therapy, an alkylating agent, with or without cytarabine and the anti‐CD20 antibody rituximab. Treatment is associated with considerable morbidity and disease recurrences, with a 5‐year survival ∼ 40%.2
Compared with DLBCL outside the CNS, the B-cell receptor (BCR) signaling pathway is more frequently mutated in PCNSL. The most common alterations include gain-of-function mutations in MYD88 and CD79B.3-5 Bruton tyrosine kinase (BTK) mediates signals downstream of MYD88 and CD79B and, therefore, represents an attractive drug target in PCNSL. The first-in-class BTK inhibitor ibrutinib has shown antitumor activity in preclinical PCNSL models3 and in patients with recurrent/refractory (r/r) PCNSL,3,6 pointing toward an important role for BTK for maintenance of the malignant phenotype in PCNSL.
Tumor responses to single-agent ibrutinib in CNS lymphoma (CNSL) are often incomplete or transient. Therefore, we investigated the safety and efficacy of ibrutinib in combination with HD-MTX and rituximab. Methotrexate (MTX) and rituximab form the backbone of many combination chemotherapy regimens in first-line therapy for CNSL. In a prior study, ibrutinib was combined with a polychemotherapy regimen not containing HD-MTX and considerable treatment-associated toxicity was observed, including aspergillosis involving lung and brain.6 To minimize the risk of adverse events, we held ibrutinib on days of HD-MTX infusion and resumed 5 days after HD-MTX infusion or after MTX clearance. Daily ibrutinib was administered continuously after completion of induction therapy until disease progression, intolerable toxicity, or death.
Methods
Study design and treatment
This was an open-label nonrandomized single-center dose-escalation study of rituximab, HD-MTX, and ibrutinib in r/r PCNSL/secondary CNSL (SCNSL) (NCT02315326). The primary objective was to determine the maximum tolerated dose of ibrutinib in combination with HD-MTX alone and ibrutinib in combination with HD-MTX and rituximab. Adverse events were graded using the National Cancer Institute Common Terminology Criteria for Adverse Events v.4.0. Dose-limiting toxicities (DLTs) were defined as any grade 4 hematologic toxicity, grade 3 febrile neutropenia and grade 3 thrombocytopenia associated with bleeding, or any grade 3 nonhematologic toxicity that did not respond to supportive therapy, occurring during the first 28 days of therapy and at least possibly related to ibrutinib. The secondary objectives were overall response rate (ORR), defined as the proportion of subjects with complete response (CR) or partial response (PR); progression-free survival (PFS); overall survival (OS); and pharmacokinetics in the blood and cerebrospinal fluid (CSF). The study was approved by the Institutional Review Board of Memorial Sloan Kettering Cancer Center (MSKCC).
The treatment regimen consisted of a combined induction therapy, followed by ibrutinib maintenance (supplemental Figure 1, available on the Blood Web site). Following the National Comprehensive Cancer Network guidelines for recurrent/refractory PCNSL (https://www.nccn.org/professionals/physician_gls/default.aspx), HD-MTX was given at 3.5 g/m2 every 2 weeks, for a total of 8 doses (4 cycles; 1 cycle = 28 days). Ibrutinib dose escalation among cohorts followed the “3+3” design and was allowed if, after 28 days of therapy, 0 of 3 or ≤1 of 6 patients had a DLT during the first cycle. The starting dose of ibrutinib was 560 mg/d and was escalated to 840 mg/d in the next cohort. After no DLT was observed in patients treated with the ibrutinib/MTX combination, rituximab was added, at 500 mg/m2 every 2 weeks during the induction phase, for a total of 8 doses. To minimize potential adverse events, ibrutinib was given sequentially and held on days of HD-MTX infusion and resumed 5 days after HD-MTX infusion or after MTX clearance. Daily ibrutinib was administered continuously after completion of induction therapy until disease progression, intolerable toxicity, or death.
Plasma samples were collected at 1, 2, 3, 4, and 6 hours, and CSF samples were collected through lumbar puncture 2 hours after ibrutinib dosing on day 28 of cycle 2 (before initiation of cycle 3) for pharmacokinetic studies. Additional CSF was collected at day 28 of cycle 4 (before initiation of cycle 5) to assess treatment response in the CSF in patients with leptomeningeal involvement.
Baseline staging assessments to assess disease burden followed the Primary CNS Lymphoma Collaborative Group guidelines7 and included brain magnetic resonance imagine (MRI), total spine MRI, CSF collection, ophthalmologic examination, and whole-body positron emission tomography. A bone marrow biopsy was performed if the whole-body positron emission tomography demonstrated an abnormal bone marrow signal.
Eligibility
The trial population consisted of patients with r/r PCNSL/SCNSL. Moreover, patients with systemic DLBCL who had completed systemic therapy without further signs of systemic disease and then developed CNS involvement for the first time were eligible to receive the study therapy as their first CNS-directed therapy. All subjects had histopathologic confirmation of DLBCL at initial diagnosis. Patients met the following criteria: age ≥ 18 years, disease on imaging or in CSF, Eastern Cooperative Oncology Group (ECOG) performance status score of 0 to 2, adequate bone marrow and organ function, and recovery to grade 1 toxicity from prior therapy. Patients with active non-CNS disease, prior ibrutinib therapy, or requiring >8 mg of dexamethasone daily for neurologic disability were excluded.
Treatment response assessments
Evaluation of treatment response followed the International Primary CNS Lymphoma Collaborative Group guidelines.7 Response to treatment was assessed in all CNS compartments using MRI imaging and CSF cytology, as well as ophthalmologic examination in case of eye involvement.
Statistical analysis
Descriptive statistics, including means, standard deviations, and medians for continuous variables and proportions for discrete variables, were used to summarize the findings in each of the combination cohorts. The Kaplan-Meier method was used for time-to-event analysis. PFS was calculated from trial registration until disease progression, last clinical assessment, or death, whichever came first. Progressions and deaths were considered events in the PFS analysis. OS was calculated from trial registration until death. Deaths were considered events in the OS analysis.
Genomic analysis
Archival tumor biopsy samples were obtained from patients who participated in the clinical trial. DLBCL subtype (activated B cell [ABC] or germinal center B cell [GCB]) was determined using immunohistochemical staining for CD10, BCL-6, and MUM-1, following the Hans classification.8 Up to 4 mL of CSF was collected for genomic analysis, if sufficient material was available at each CSF collection (baseline staging and after completion of cycles 2 and 4), and sequenced using the MSK-HemePACT targeted panel, including 585 cancer genes specifically targeting genes associated with hematologic malignancies. All samples were studied in accordance with a protocol approved by the MSKCC Institutional Review Board. Genomic analysis followed methods and algorithm used in previous studies.3,9,10
Results
Patient population
Fifteen eligible patients (9 PCNSL and 6 SCNSL) were enrolled. Median age was 62 years (range, 23-74), and median ECOG score was 1 (range, 0-2); 7 patients were women. Thirteen patients had parenchymal brain lesions, 5 patients had isolated brain lesions, 7 patients had brain and CSF involvement, 1 patient had brain and eye involvement, and 2 patients had isolated leptomeningeal disease confirmed on CSF cytology. Nine patients had recurrent disease (8 PCNSL, 1 SCNSL), 3 patients had HD-MTX–based chemotherapy-refractory disease (1 PCNSL, 2 SCNSL), and 3 patients had newly diagnosed SCNSL (Table 1; supplemental Table 1). For patients with r/r disease (n = 12), the median time from the last CNS-directed treatment was 8.55 months (range, 0.5-43.8). All patients with r/r disease had received HD-MTX chemotherapy in combination with rituximab. In 9 of 12 patients (75%), rituximab/HD-MTX was combined with an alkylating agent (procarbazine in 7 patients and temozolomide in 2 patients). One patient received prior cranial radiotherapy, and 1 patient received autologous stem cell transplantation. Three of 12 patients (25%) also received HD-MTX as salvage. Five patients (33%) required corticosteroid treatment to control neurologic symptoms at enrollment (supplemental Table 2). Each patient received MTX (3.5 g/m2). Using the “3+3” design, ibrutinib was first combined with MTX. Next, rituximab (500 mg/m2) was combined with MTX (3.5 g/m2) and ibrutinib. Ibrutinib was increased from 560 mg daily to 840 mg daily. In summary, HD-MTX and ibrutinib (560 mg) was given to 3 patients, HD-MTX and ibrutinib (840 mg) was given to 3 patients, HD-MTX, rituximab, and ibrutinib (560 mg) was given to 3 patients, and HD-MTX, rituximab, and ibrutinib (840 mg) was given to 6 patients. Six patients received HD-MTX with ibrutinib (560 mg, n = 3; 840 mg, n = 3), and 9 patients received HD-MTX, rituximab, and ibrutinib (560 mg, n = 3; 840 mg, n = 6).
Baseline characteristics of patients
| Characteristics | Values |
|---|---|
| Median age (range), y | 62 (23-74) |
| Sex, n (%) | |
| Male | 8 (53) |
| Female | 7 (47) |
| Median ECOG score (range) | 1 (0-2) |
| CNSL, n (%) | |
| PCNSL | 9 (60) |
| SCNSL | 6 (40) |
| Disease status, n (%) | |
| Recurrent PCNSL or SCNSL | 9 (60) |
| Refractory PCNSL or SCNSL | 3 (20) |
| Newly diagnosed SCNSL | 3 (20) |
| Newly diagnosed PCNSL | 0 (0) |
| CNS involvement, n (%) | |
| Brain | 5 (33) |
| CSF | 2 (13) |
| Brain and CSF | 7 (47) |
| Brain and eye | 1 (7) |
| Prior treatment in r/r disease, n (%); n = 12 | |
| Chemotherapy | 12 (100) |
| HD-MTX chemotherapy | 12 (100) |
| HD-MTX + alkylator | 9 (75) |
| Rituximab | 12 (100) |
| Radiation | 1 (8) |
| Stem cell transplant | 1 (8) |
| HD-MTX at recurrence | 3 (25) |
| Median number of prior regimens (range) | 1 (0-2) |
| Corticosteroids at enrollment, n (%) | 5 (33) |
Safety and adverse events
No DLT was observed during the DLT period. No treatment discontinuation occurred because of adverse events with ibrutinib treatment. The dose of rituximab or HD-MTX was not reduced in any of the patients. Ibrutinib was given on a median of 18 days (range, 15-20) per cycle. Ibrutinib dosing was delayed by HD-MTX clearing and minor surgical procedures (tooth extraction, bone marrow biopsy, MediPort placement). There were 3 non-DLT grade 4 adverse events (lung infection, lymphopenia, neutropenia) (Table 2; supplemental Table 3). Of those events, 2 occurred during the single-ibrutinib treatment phase (supplemental Table 3). All grade 4 adverse events were seen in patients treated with rituximab, HD-MTX, and ibrutinib (2 receiving 840 mg and 2 receiving 560 mg) (supplemental Table 3). We observed 29 grade 3 events (most frequent: 8 lymphopenia, 6 alanine aminotransferase/aspartate aminotransferase elevation, 3 anemia, 2 lung infections). Of those grade 3 adverse events, 8 were seen in patients receiving HD-MTX and ibrutinib (560 mg), 3 were observed in patients treated with HD-MTX and ibrutinib (840 mg), 5 were observed in those receiving HD-MTX, rituximab, and ibrutinib (560 mg), and 13 were observed in the cohort receiving HD-MTX, rituximab, and ibrutinib (840 mg). The most common adverse events were anemia, thrombocytopenia, alanine aminotransferase/aspartate aminotransferase elevation, and lymphopenia. No fungal infections were observed. The dose of single-agent ibrutinib was reduced in 3 patients for diarrhea, recurrent bacterial infection (skin, lung), and drug interaction (CYP3A inhibitor amlodipine was started to control atrial fibrillation).
Adverse events, most common events (>10% of patients), and all grade 3 or 4 toxicities
| Adverse event | Grade 1 or 2 | Grade 3 | Grade 4 | Total |
|---|---|---|---|---|
| Anemia | 12 (80) | 3 (20) | — | 15 (100) |
| Aspartate aminotransferase increased | 10 (67) | 5 (33) | — | 13 (87) |
| Platelet count decreased | 11 (73) | 1 (7) | — | 12 (80) |
| Alanine aminotransferase increased | 11 (73) | 1 (7) | — | 12 (80) |
| Lymphocyte count decreased | — | 8 (53) | 1 (7) | 9 (60) |
| White blood cell decreased | 8 (53) | 1 (7) | — | 9 (60) |
| Hyperglycemia | 7 (47) | 1 (7) | — | 8 (53) |
| Neutrophil count decreased | 4 (27) | 1 (7) | 1 (7) | 6 (40) |
| Alkaline phosphatase increased | 7 (47) | — | — | 7 (47) |
| Blood bilirubin increased | 7 (47) | — | — | 7 (47) |
| Cholesterol high | 7 (47) | — | — | 7 (47) |
| Hypokalemia | 6 (40) | 1 (7) | — | 7 (47) |
| Hypocalcemia | 4 (27) | 1 (7) | — | 5 (33) |
| Fatigue | 5 (33) | — | — | 5 (33) |
| Creatinine increased | 4 (27) | — | — | 4 (27) |
| Nausea | 4 (27) | — | — | 4 (27) |
| Musculoskeletal and connective tissue disorder (cramps) | 4 (27) | — | — | 4 (27) |
| Lung infection | — | 2 (13) | 1 (7) | 3 (20) |
| Hyponatremia | 2 (13) | 1 (7) | — | 3 (20) |
| Activated partial thromboplastin time prolonged | 3 (20) | — | — | 3 (20) |
| Hypertriglyceridemia | 3 (20) | — | — | 3 (20) |
| Hypoalbuminemia | 3 (20) | — | — | 3 (20) |
| Diarrhea | 1 (7) | 1 (7) | — | 2 (13) |
| Acute kidney injury | 2 (13) | — | — | 2 (13) |
| Arthralgia | 2 (13) | — | — | 2 (13) |
| Headache | 2 (13) | — | — | 2 (13) |
| Infections and infestations - other (infection of unknown origin) | — | 1 (7) | — | 1 (7) |
| Hyperkalemia | — | 1 (7) | — | 1 (7) |
All data are shown as number of patients (%).
—, not observed.
Treatment duration and response
Twelve of 15 patients completed the induction phase of ibrutinib-based combination therapy (47 delivered out of 48 cycles planned). Three patients did not complete the assigned combined induction regimen due to progression after cycle 1 (patients #3, #10) or withdrawal after cycle 2 due to personal choice (patient #2). One patient (#11) completed the induction phase of ibrutinib-based combination therapy but did not continue to single-agent ibrutinib maintenance because of progression found after completion of cycle 4. Eleven of 15 patients started the maintenance stage of our regimen with single-agent ibrutinib (supplemental Figure 2).
At a median follow-up of 19.7 months (range, 12.7-27.1) for the entire cohort, all 15 patients were evaluated for response. Best responses included 8 CRs, 4 PRs, 1 stable disease (SD), and 2 progressive disease (PD), with an ORR of 80% (12/15; 95% confidence interval [CI], 52-96) (Figure 1A). CRs were seen in patients receiving HD-MTX/ibrutinib, as well as in those receiving HD-MTX/rituximab/ibrutinib. None of the patients who achieved a CR received corticosteroids (supplemental Table 2). The response rate was 89% (8/9; 95% CI, 52-100) in r/r PCNSL and 67% (4/6; 95% CI, 22-96) in SCNSL.

Clinical response to ibrutinib-based combination therapy in CNSL. (A) Best response to ibrutinib-based combination therapy. Displayed is the change in target lesion diameter from baseline (%) by MRI or clearance of malignant cells in CSF; negative values indicate tumor shrinkage. Eight of 9 (89%) PCNSL patients and 4 of 6 (67%) SCNSL patients responded to ibrutinib-based combination therapy. (B) PFS in patients with PCNSL (upper panel) and SCNSL (lower panel).
Clinical response to ibrutinib-based combination therapy in CNSL. (A) Best response to ibrutinib-based combination therapy. Displayed is the change in target lesion diameter from baseline (%) by MRI or clearance of malignant cells in CSF; negative values indicate tumor shrinkage. Eight of 9 (89%) PCNSL patients and 4 of 6 (67%) SCNSL patients responded to ibrutinib-based combination therapy. (B) PFS in patients with PCNSL (upper panel) and SCNSL (lower panel).
The median PFS for all 15 patients was 9.2 months (95% CI, 3.39-no upper limit). The median PFS for the subset of PCNSL patients has not yet been reached. The median OS was not reached (11/15 subjects alive) (Figure 1B; supplemental Figure 3). The 1-year OS is 71.1% (95% CI, 46.7-95.5). Responses were observed in PCNSL and SCNSL and in both subtypes (ABC, GCB). No CR or PR was seen in the 3 patients with refractory CNS disease, all of whom had the GCB subtype.
Five patients have remained disease free on ibrutinib maintenance but received high-dose chemotherapy with stem cell rescue off-study (#1, #7, #9, #13, #15). None of these patients encountered difficulties mobilizing stem cells while on ibrutinib monotherapy, and none have developed recurrent disease. Four patients continued ibrutinib (#5, #8, #12, #14), and 2 patients (#4, #6) developed disease progression while receiving single-agent ibrutinib.
The median duration of response was 12.8 months in all patients (range, 0.53-25.63) and 14.3 months (range, 3.5-23.03) for the 6 patients who continued ibrutinib maintenance (#4, #5, #6, #8, #12, #14).
Ibrutinib concentration in the CSF
We measured ibrutinib concentrations in CSF 2 hours postdose on day 28 of cycle 2 in 11 of 15 patients (supplemental Figure 4). Mean CSF ibrutinib concentration was 3.105 ng/mL (equivalent to 7.05 nM; range, 0.305-9.22). In patients receiving 560 mg of ibrutinib (n = 4), the mean CSF concentration was 1.553 ng/mL (range, 0.991-2.62). The mean CSF levels in patients receiving 840 mg of ibrutinib (n = 7) was 3.992 ng/mL (range, 0.305-9.22). These ibrutinib concentrations are similar to the reported ibrutinib CSF concentrations observed in patients receiving single-agent ibrutinib.3,6 CSF was not collected in 2 patients due to disease progression, and 2 patients declined CSF collection.
Detection of ctDNA in CSF in CNSL
Disease burden in CNSL is typically assessed by MRI, CSF cytology, and CSF flow cytometry. We examined whether patients with r/r CNSL might harbor tumor-derived DNA in CSF. For 8 of 15 patients, we had sufficient pretreatment CSF volume for this exploratory analysis (Figure 2A). All samples were analyzed using MSK-HemPACT, a custom US Food and Drug Administration–authorized next-generation sequencing–based tumor-sequencing assay.9,10 We detected ≥1 tumor-derived genetic alteration in CSF from all 8 patients (supplemental Figure 5A). For 6 of these patients, we were able to compare the genetic profile in CSF with the genetic profile of a previous tumor biopsy, collected prior to CSF collection (median interval between tumor and CSF collection, 31 months) (supplemental Figure 5B). Between 11% and 37% of identified single nucleotide variants were shared between the archival tumor tissue and CSF circulating tumor DNA (ctDNA) at recurrence (supplemental Figure 5C). Due to a paucity of data, it is unclear how frequently genomic alterations are shared between tumor and ctDNA in the CSF of patients with brain tumors. Nonetheless, it is noteworthy that the frequency of shared mutations was considerably higher (60%) for mutations in BCR pathway members (MYD88_L265P, CD79B_Y196, CARD11, MALT1, PLCG2, TNFAIP3) (supplemental Figure 5D; supplemental Table 3), pointing toward a fitness advantage conferred by maintenance of these mutations.
![Figure 2. Molecular response to ibrutinib-based therapy. (A) Biospecimen collection for all patients enrolled in our study. Included is the time between the tumor and CSF collection (T/C interval). Red diamonds indicate primary tumor tissue that was collected and sequenced (BM: diagnosed by bone marrow biopsy; C: diagnosed by CSF cytology). X, patient refused CSF collection. P, patient off study for disease progression. Blue circles represent sequenced CSF samples, and white circles represent samples with insufficient volume to perform sequencing. (B) Imaging was performed at baseline and at C3 and C5 in 9 patients. Shown is the spider plot of patients with measurable disease, 1 of whom had disease progression after an initial response to therapy (#11) and 7 patients (#5, #7, #9, #12, #13, #14, #15) had a PR > 90% or CRs on MRI. (C) Heat maps of the variant allelic frequencies of all of the mutations present in CSF collected before treatment initiation (baseline), during ibrutinib-based combination therapy (C3, C5), and at progression (PD) in representative patients with sustained response demonstrating a “clearance” of tumor DNA (for all CSF profiles, see supplemental Figure 6). Variant allelic frequency scale = 0 (white) or 1 (dark blue). (D) Heat map of the variant allelic frequencies (baseline, C3, C5, and at progression [PD]) and early progression, demonstrating a persistent clone (#11). (E) Patient with nonmeasurable leptomeningeal disease on MRI (T1 postcontrast sequences) and CSF (cytology and flow cytometry) at baseline. After 2 cycles of study therapy, the MRI changes resolved. No malignant cells and no ctDNA was detectable in the CSF (C3). After completion of the induction therapy (C5), the brain MRI and CSF (cytology and flow cytometry) continued to show a response, whereas ctDNA was detectable in the CSF. Ultimately, the patient developed progression of disease on MRI, CSF cytology, and CSF flow cytometry after 1 month of maintenance ibrutinib. White arrowheads, leptomeningeal involvement in the cerebellar folia; white arrows, leptomeningeal involvement of both trigeminal nerves; red arrows, recurrent leptomeningeal disease affecting both trigeminal nerves. (F) Heat map of the variant allelic frequencies in a case of early progression with reemergence of genetic alterations (#6). Variant allelic frequency scale = 0 (white) or 1 (dark blue).](https://ash.silverchair-cdn.com/ash/content_public/journal/blood/133/5/10.1182_blood-2018-09-875732/3/m_blood875732f2.png?Expires=1767769042&Signature=u~SsXaID9wPMR6rlNFTJJseXYE5FRw-faxh58Goal5t~ZRKbczyQBzBuMS6kS395yzYhJ-qPXCUEeLXHU3rKupbgyN1tGwICpK7nTfI2vnefRZYEdfetQ-jkKAiUMcf7gDEoG6iPtJJO1aVQuHR8FvZnJpRKCefz8SRXgjYry1tIi0XSBAOYxFi8hZe3SZh0OSW8Q9KdfamqjYUNM3k7OytKDJHnD-9q99bLbqF~dGmHw2FukE2sICuC1ir-OGS6GIImMvkKHqhj6bN4beiCI-RvwgRcyS5FNIU98Ox5E3-RfBM9Apmv9nTTIbHr4h5nCemcjPc2jvMl44Bp03QBnA__&Key-Pair-Id=APKAIE5G5CRDK6RD3PGA)
Molecular response to ibrutinib-based therapy. (A) Biospecimen collection for all patients enrolled in our study. Included is the time between the tumor and CSF collection (T/C interval). Red diamonds indicate primary tumor tissue that was collected and sequenced (BM: diagnosed by bone marrow biopsy; C: diagnosed by CSF cytology). X, patient refused CSF collection. P, patient off study for disease progression. Blue circles represent sequenced CSF samples, and white circles represent samples with insufficient volume to perform sequencing. (B) Imaging was performed at baseline and at C3 and C5 in 9 patients. Shown is the spider plot of patients with measurable disease, 1 of whom had disease progression after an initial response to therapy (#11) and 7 patients (#5, #7, #9, #12, #13, #14, #15) had a PR > 90% or CRs on MRI. (C) Heat maps of the variant allelic frequencies of all of the mutations present in CSF collected before treatment initiation (baseline), during ibrutinib-based combination therapy (C3, C5), and at progression (PD) in representative patients with sustained response demonstrating a “clearance” of tumor DNA (for all CSF profiles, see supplemental Figure 6). Variant allelic frequency scale = 0 (white) or 1 (dark blue). (D) Heat map of the variant allelic frequencies (baseline, C3, C5, and at progression [PD]) and early progression, demonstrating a persistent clone (#11). (E) Patient with nonmeasurable leptomeningeal disease on MRI (T1 postcontrast sequences) and CSF (cytology and flow cytometry) at baseline. After 2 cycles of study therapy, the MRI changes resolved. No malignant cells and no ctDNA was detectable in the CSF (C3). After completion of the induction therapy (C5), the brain MRI and CSF (cytology and flow cytometry) continued to show a response, whereas ctDNA was detectable in the CSF. Ultimately, the patient developed progression of disease on MRI, CSF cytology, and CSF flow cytometry after 1 month of maintenance ibrutinib. White arrowheads, leptomeningeal involvement in the cerebellar folia; white arrows, leptomeningeal involvement of both trigeminal nerves; red arrows, recurrent leptomeningeal disease affecting both trigeminal nerves. (F) Heat map of the variant allelic frequencies in a case of early progression with reemergence of genetic alterations (#6). Variant allelic frequency scale = 0 (white) or 1 (dark blue).
Molecular response to ibrutinib-based therapy. (A) Biospecimen collection for all patients enrolled in our study. Included is the time between the tumor and CSF collection (T/C interval). Red diamonds indicate primary tumor tissue that was collected and sequenced (BM: diagnosed by bone marrow biopsy; C: diagnosed by CSF cytology). X, patient refused CSF collection. P, patient off study for disease progression. Blue circles represent sequenced CSF samples, and white circles represent samples with insufficient volume to perform sequencing. (B) Imaging was performed at baseline and at C3 and C5 in 9 patients. Shown is the spider plot of patients with measurable disease, 1 of whom had disease progression after an initial response to therapy (#11) and 7 patients (#5, #7, #9, #12, #13, #14, #15) had a PR > 90% or CRs on MRI. (C) Heat maps of the variant allelic frequencies of all of the mutations present in CSF collected before treatment initiation (baseline), during ibrutinib-based combination therapy (C3, C5), and at progression (PD) in representative patients with sustained response demonstrating a “clearance” of tumor DNA (for all CSF profiles, see supplemental Figure 6). Variant allelic frequency scale = 0 (white) or 1 (dark blue). (D) Heat map of the variant allelic frequencies (baseline, C3, C5, and at progression [PD]) and early progression, demonstrating a persistent clone (#11). (E) Patient with nonmeasurable leptomeningeal disease on MRI (T1 postcontrast sequences) and CSF (cytology and flow cytometry) at baseline. After 2 cycles of study therapy, the MRI changes resolved. No malignant cells and no ctDNA was detectable in the CSF (C3). After completion of the induction therapy (C5), the brain MRI and CSF (cytology and flow cytometry) continued to show a response, whereas ctDNA was detectable in the CSF. Ultimately, the patient developed progression of disease on MRI, CSF cytology, and CSF flow cytometry after 1 month of maintenance ibrutinib. White arrowheads, leptomeningeal involvement in the cerebellar folia; white arrows, leptomeningeal involvement of both trigeminal nerves; red arrows, recurrent leptomeningeal disease affecting both trigeminal nerves. (F) Heat map of the variant allelic frequencies in a case of early progression with reemergence of genetic alterations (#6). Variant allelic frequency scale = 0 (white) or 1 (dark blue).
Clinical response and pretreatment tumor genotype
The molecular basis of de novo and acquired resistance to ibrutinib in CNSL remains poorly understood. Clinical responses to single-agent ibrutinib are more frequent in PCNSL (ORR, 77%)3 and SCNSL (ORR, 71%)3 than in DLBCL outside the CNS (ORR, 25%),11 and CRs have been observed, even in tumors without activating mutations in MYD88 or CD79B. In DLBCL outside the CNS, clinical responses to ibrutinib are more common in tumors of the ABC DLBCL subtype than in patients with the GCB DLBCL subtype.11 Activating mutations in PLCγ2 and CARD11, downstream members of the BCR pathway, have been associated with resistance to single-agent ibrutinib in several human B-cell malignancies.11-15
Therefore, we examined the relationship between clinical response to the ibrutinib-based combination therapy and pretreatment tumor genotype, ascertained in tumor or CSF (whichever was closer to treatment onset). Twelve of 15 (80%) tumor samples had mutations in ≥1 BCR pathway member, including MYD88 (8/15, 53%), CD79B (7/15, 47%), CARD11 (6/15, 40%), TNFAIP3 (1/15, 7%), MALT1 (1/15, 7%), and PLCG2 (1/15, 7%) (Table 3). Consistent with our prior data, we observed responses to ibrutinib-based combination therapies even in tumors without mutations in the examined BCR pathway members. Interestingly, we also observed responses in patients whose tumors harbored mutations that might be expected to restore BCR pathway activity in the presence of ibrutinib (eg, CARD11 mutations at F97Y16 ; the coiled-coil domain mutations17 at M166T, K215M, and R418K; and the TNFAIP3 mutation at C483W18 ).
Mutations in BCR pathway members in pretreatment archival tumor tissue or CSF
| Patient ID | Disease | COO/status | Best response (duration, mo) | MYD88 | CD79B | CARD11 | MALT1 | TNFAIP3 | PLCG2 |
|---|---|---|---|---|---|---|---|---|---|
| #5 | PCNSL | ABC/recu | CR (24)* | L265P (C) | Y196H (C) | WT (C) | WT (C) | WT (C) | WT (C) |
| #8 | PCNSL | ABC/recu | CR (19.4)* | L265P (C) | Y196H (C) | WT (C) | WT (C) | WT (C) | WT (C) |
| #12 | PCNSL | ABC/recu | CR (16.7)* | WT (C) | Y196H (T) | WT (C) | WT (C) | WT (C) | WT (C) |
| #4 | PCNSL | ABC/recu | CR (9.2) | L265P (T) | X185splice/D185N (T) | F97Y (T) | WT (T) | WT (T) | WT (T) |
| #9 | PCNSL | ABC/recu | CR (4.3)† | WT (C) | WT (C) | WT (C) | WT (C) | WT (C) | WT (C) |
| #7 | PCNSL | ABC/recu | CR (4)† | WT (C) | WT (C) | M166T (C) | WT (C) | WT (C) | WT (C) |
| #13 | PCNSL | ABC/recu | PR (4.3)† | L265P (T) | Y196S (T) | R418K (T) | WT (T) | WT (T) | WT (T) |
| #15 | PCNSL | GCB/recu | PR (3.8)† | L265P (C) | Y196S/D201G (C) | WT (C) | WT (C) | WT (C) | WT (C) |
| #10 | PCNSL | GCB/refr | PD (0.9) | WT (T) | WT (T) | T128M/K252E (T) | WT (T) | WT (T) | WT (T) |
| #14 | SCNSL | GCB/new | CR (13.8)* | L265P (C) | Y196C (C) | WT (C) | WT (C) | WT (C) | WT (C) |
| #6 | SCNSL | ABC/new | PR (4.47) | L265P (T) | WT (T) | WT (T) | AMP (T) | WT (T) | WT (T) |
| #1 | SCNSL | GCB/recu | PR (4)† | D288_F298del (T) | Y196F/M164I (T) | K215M (T) | WT (T) | C483W (T) | WT (T) |
| #11 | SCNSL | GCB/new | PR (3.4) | A272P (C) | WT (C) | S66A/L251P/R418S (C) | WT (C) | WT (C) | WT (C) |
| #2 | SCNSL | GCB/refr | SD (1.5) | WT (T) | WT (T) | WT (T) | WT (T) | WT (T) | R268W (T) |
| #3 | SCNSL | GCB/refr | PD (0.9) | WT (C) | WT (C) | WT (C) | WT (C) | WT (C) | WT (C) |
Mutations are highlighted in bold.
(C), CSF; COO; cell of origin; recu, recurrent tumor; refr, refractory tumor; (T), archival formalin-fixed paraffin-embedded tissue; WT, wild-type.
Ongoing treatment with study drug.
Treated with high-dose chemotherapy with autologous stem cell rescue.
Monitoring of CSF ctDNA during therapy
We evaluated the effects of ibrutinib-based combination therapy on the presence of ctDNA in the CSF. We collected sequential CSF samples at study onset (“baseline”), before treatment cycle 3 (C3), and before cycle 5 (C5). For 9 of 15 patients in our study, we were able to obtain multiple CSF samples (Figure 2A). The remaining 6 patients declined repeated CSF collection, suffered disease progression with clinical deterioration preventing serial sample collection, or had insufficient CSF volume to complete sequencing (Figure 2A). Seven of 9 patients with repeated CSF collections had a complete or near-complete (PR > 90%) radiographic response of their measurable disease to the ibrutinib-based combination treatment (Figure 2B), and this response was accompanied by the disappearance of CSF ctDNA (Figure 2C; supplemental Figure 6). One patient (#11) with repeated CSF collections experienced rapid disease progression after an initial tumor response and showed persistence (Figure 2D) of tumor-specific alterations in the CSF. One patient (#6) with nonmeasurable leptomeningeal involvement had a CR on imaging and CSF assessments (Figure 2E). The genomic alterations cleared with therapy (C3) but reoccurred (C5), even before conventional CSF studies (cytology, flow cytometry) suggested disease recurrence. A summary of our integrated treatment response analysis (including MRI, CSF cytology, and CSF ctDNA evaluation) is shown in Figure 3.
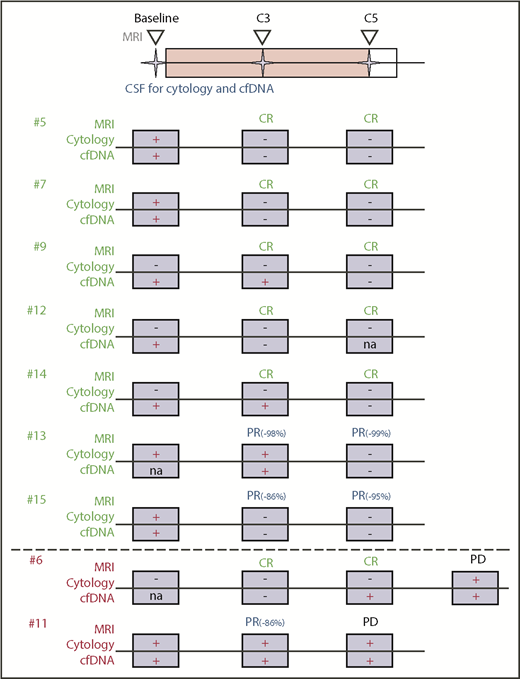
Integration of clinical and molecular response assessment. Conventional treatment response assessment using MRI and cytology is combined with genomic testing of ctDNA in CSF. CSF and imaging were performed at baseline prior to treatment initiation and at C3 and C5. Shown are patients with serial CSF collections and their response to study treatment using MRI, cytology, and ctDNA. Patient #6 had radiographic progression of disease at cycle 7.
Integration of clinical and molecular response assessment. Conventional treatment response assessment using MRI and cytology is combined with genomic testing of ctDNA in CSF. CSF and imaging were performed at baseline prior to treatment initiation and at C3 and C5. Shown are patients with serial CSF collections and their response to study treatment using MRI, cytology, and ctDNA. Patient #6 had radiographic progression of disease at cycle 7.
Discussion
Our study demonstrates that the sequential combination of ibrutinib with HD-MTX–based chemotherapy had acceptable toxicity in the setting of our single-center phase 1 trial. Eleven of 15 patients proceeded to maintenance ibrutinib after completing 4 cycles of the ibrutinib/HD-MTX/rituximab combination, and we did not observe any DLT, treatment-related death, or aspergillosis. For future studies, we propose to use an 840-mg dose of ibrutinib, because CSF drug concentrations achieved at this dose level are consistently above the 50% inhibitory concentration needed to induce cell death in vitro.3,6 The tolerability of the current regimen (4 grade 4 events, 29 grade 3 events) contrasts with the considerable toxicity reported for the combination of ibrutinib with dose-adjusted temozolomide, etoposide, liposomal doxorubicin, dexamethasone, and rituximab (TEDDi-R)6 (27 grade 4 events, 51 grade 3 events). We cannot exclude the possibility that our patients were healthier or less heavily pretreated, which may have contributed to the better tolerability of the ibrutinib/HD-MTX/rituximab combination. However, this seems less likely, because many patients in our trial (9/12 patients with r/r CNSL) had received intensive prior therapy (HD-MTX, rituximab, and alkylating agent) and had aggressive disease, with only a short relapse-free interval since receiving front-line therapy.
The ibrutinib/HD-MTX/rituximab combination regimen showed promising antitumor activity, but there are several caveats in interpreting these results, including the overall small study size, the phase 1b design, exclusion of patients receiving >8 mg dexamethasone daily, and the heterogeneous patient population with inclusion of PCNSL and SCNSL. Given the nonrandomized design, we are also unable to determine to what extent the addition of ibrutinib increased the activity of high-dose MTX. At first glance, the response rates with salvage HD-MTX plus ibrutinib and rituximab in our cohort may seem similar to those described for salvage with HD-MTX in relapsed PCNSL. However, response rates to MTX-based chemotherapy have been obtained retrospectively,19,20 and the longer median time to first relapse in these retrospective studies (>2 years) suggests an enrichment for patients with MTX-responsive disease21 compared with the patients in our current study. In comparison with our prior study with single-agent ibrutinib,3 the radiographic response of r/r PCNSL was higher with the ibrutinib/HD-MTX/rituximab combination regimen (89% vs 77%), and PFS was longer with the combination therapy. However, this finding will require longer follow-up, because 5 of 15 patients in our current study proceeded to high-dose chemotherapy with autologous stem cell rescue, after responding to the ibrutinib/HD-MTX/rituximab combination therapy. Lastly, we observed CRs, even in patients with tumors that would be predicted to respond less favorably to single-agent ibrutinib due to a mutation in the distal BCR pathway members CARD11 or TNFAIP3. Therefore, future evaluation of the ibrutinib-based combination therapy regimen seems warranted. Recently, the role of rituximab in PCNSL has become questionable. In the HOVON 105/ALLG NHL 24 phase 3 study,22 which included 200 patients newly diagnosed with PCNSL, the addition of rituximab to an MTX-based polychemotherapy regimen (HD-MTX, BCNU, teniposide, prednisone) did not demonstrate a significant benefit on clinical outcome parameters. Of note, 5 of 9 (56%) patients in our study receiving rituximab had a CR, in contrast to only 2 of 6 (33%) patients not receiving rituximab.
Lastly, our exploratory biomarker analysis suggests that CSF liquid biopsies, obtained through office-based lumbar puncture and examined with a US Food and Drug Administration–authorized next-generation–sequencing assay, may be useful to monitor disease burden and evaluate treatment response in CNSL. Although not all patients in our study participated in this exploratory biomarker analysis, our preliminary data suggest that a considerable fraction of patients with r/r CNSL harbor tumor DNA in CSF, even if CSF involvement is undetectable by conventional techniques (MRI, CSF cytology, CSF flow cytometry). Longer follow-up and larger studies are needed to extend and validate these observations and their impact on our understanding of acquired drug resistance, which is currently a major roadblock in the treatment of brain tumors.
Presented in abstract form at the 2017 American Society of Clinical Oncology Meeting, Chicago, IL, 2 June 2017.
The online version of this article contains a data supplement.
The publication costs of this article were defrayed in part by page charge payment. Therefore, and solely to indicate this fact, this article is hereby marked “advertisement” in accordance with 18 USC section 1734.
Acknowledgments
This work was supported by a research grant from Pharmacyclics to MSKCC. Pharmacyclics was not involved in the design and conduct of the study. The statistical analysis plan and data analyses were performed by MSKCC investigators. The exploratory research was supported by grants from the National Institutes of Health, National Institute of Neurological Disorders and Stroke (NINDS) (1 R35 NS105109 01 [I.K.M.], P30-CA008748), the Leukemia and Lymphoma Society (C.G.), the Society of MSKCC (C.G.), a Lymphoma Research Foundation Career Development Award (C.G.), and a Cycle for Survival Equinox Innovation Award (C.G.).
Authorship
Contribution: C.G. conceived, designed, and supervised the study; C.G. and I.K.M. developed the methodology; C.G., S.S.T., T.J.K., M.D., E.I.P., A.F.P., J.S., A.L., C.P.N., M.M., P.C., C.C., A.V., J.W., V.H., L.M.D., and I.K.M. acquired data; C.G., S.S.T., A.S.R., K.S.P., and I.K.M. analyzed and interpreted data (ie, statistical analysis, biostatistics, computational analysis); C.G., M.M., J.W., and I.K.M. provided administrative, technical, or material support; C.C. and J.W. helped to process CSF and blood samples; and all authors wrote, reviewed, and/or revised the manuscript.
Conflict-of-interest disclosure: C.G. has acted as a consultant for BTH and Kite. E.I.P. has acted as an advisor for AstraZeneca. A.L. has received research funding from Nantomics and Bristol-Myers Squibb. K.S.P. owns stock in Johnson & Johnson, Pfizer, Viking Therapeutics, and Catalyst Biotech. L.M.D. has acted as an advisor for Sapience Therapeutics, Tocagen, BTG International, Roche, and Syndax. M.F.B. has acted as an advisor for Roche and has received research funding from Illumina. I.K.M. has received research funding from General Electric, Amgen, and Lilly; has acted as an advisor for Agios, Puma Biotechnology, and Debiopharm Group; and has received honoraria from Roche for a presentation. The remaining authors declare no competing financial interests.
The current affiliation for A.A.T. is Department of Neurology, University of Vermont, Burlington, VT.
Correspondence: Ingo K. Mellinghoff, Department of Neurology and Human Oncology and Pathogenesis Program, Memorial Sloan Kettering Cancer Center, 1275 York Ave, New York, NY 10065; e-mail: mellingi@mskcc.org; and Christian Grommes, Department of Neurology, Memorial Sloan Kettering Cancer Center, 1275 York Ave, New York, NY 10065; e-mail: grommesc@mskcc.org.

This feature is available to Subscribers Only
Sign In or Create an Account Close Modal