

Key Points
A novel MSCE116K mutation occurs exclusively in ALK− ALCLs, particularly those with DUSP22 rearrangements.
MSCE116K induces expression of the CD30–IRF4–MYC axis, drives cell cycle progression, and can be targeted with BET inhibitors.

Abstract
Anaplastic large cell lymphomas (ALCLs) represent a relatively common group of T-cell non-Hodgkin lymphomas (T-NHLs) that are unified by similar pathologic features but demonstrate marked genetic heterogeneity. ALCLs are broadly classified as being anaplastic lymphoma kinase (ALK)+ or ALK−, based on the presence or absence of ALK rearrangements. Exome sequencing of 62 T-NHLs identified a previously unreported recurrent mutation in the musculin gene, MSCE116K, exclusively in ALK− ALCLs. Additional sequencing for a total of 238 T-NHLs confirmed the specificity of MSCE116K for ALK− ALCL and further demonstrated that 14 of 15 mutated cases (93%) had coexisting DUSP22 rearrangements. Musculin is a basic helix-loop-helix (bHLH) transcription factor that heterodimerizes with other bHLH proteins to regulate lymphocyte development. The E116K mutation localized to the DNA binding domain of musculin and permitted formation of musculin–bHLH heterodimers but prevented their binding to authentic target sequence. Functional analysis showed MSCE116K acted in a dominant-negative fashion, reversing wild-type musculin-induced repression of MYC and cell cycle inhibition. Chromatin immunoprecipitation–sequencing and transcriptome analysis identified the cell cycle regulatory gene E2F2 as a direct transcriptional target of musculin. MSCE116K reversed E2F2-induced cell cycle arrest and promoted expression of the CD30–IRF4–MYC axis, whereas its expression was reciprocally induced by binding of IRF4 to the MSC promoter. Finally, ALCL cells expressing MSCE116K were preferentially targeted by the BET inhibitor JQ1. These findings identify a novel recurrent MSC mutation as a key driver of the CD30–IRF4–MYC axis and cell cycle progression in a unique subset of ALCLs.
Introduction
T-cell non-Hodgkin lymphomas (T-NHLs) are a diverse group of generally aggressive malignancies of mature T-cell origin that represent 10% to 15% of lymphomas.1,2 More than 30 distinct subtypes are recognized by the World Health Organization (WHO), the most common of which are peripheral T-cell lymphoma, not otherwise specified (PTCL, NOS), angioimmunoblastic T-cell lymphoma (AITL), and anaplastic large cell lymphoma (ALCL).3 PTCL, NOS is the most common and represents a “wastebasket” entity for T-NHLs not meeting criteria for a more specific entity, underscoring the limited understanding of a significant fraction of T-NHLs. Together with the diversity, relative rarity, and high mortality of T-NHL, these data highlight a significant unmet need for improved diagnosis and therapy of this challenging group of malignancies.
The genomic landscape of T-NHL is gradually being elucidated, revealing significant opportunities for precision diagnostics and targeted therapies.4 In AITL and PTCL, NOS, recurrent genetic alterations include those activating the T-cell receptor signaling pathway, such as RHOA mutations and CTLA4-CD28 fusions, and those affecting epigenetic-modifying genes, such as IDH2, TET2, and DNMT3A.5-9 ALCLs have ALK fusion genes in about half of cases, leading to activation of the JAK-STAT3 signaling pathway.4,10 Alternative mechanisms of JAK-STAT3 activation have been reported in anaplastic lymphoma kinase (ALK)− ALCLs, including mutations in JAK1 and/or STAT3 and fusions involving ROS1, TYK2, or FRK.11-13 In addition, rearrangements of DUSP22 or TP63 have been reported in 30% and 8%, respectively, of ALK− ALCLs.14-16 Rearrangements of ALK or DUSP22 have been associated with favorable prognosis, and rearrangements of TP63 have been associated with poor prognosis, whereas ALK and JAK-STAT3 signaling represent therapeutic targets.12,16-18 To extend understanding of this genomic landscape, we studied the exomes of 62 T-NHLs and analyzed the results in the context of detailed pathologic and molecular annotation, in vitro functional studies, and therapeutic targetability.
Methods
Patient samples
Sixty-two patients with T-NHL and available frozen tissue were studied by exome sequencing. All cases were rereviewed and classified by revised 2016 WHO criteria.3 Clinicopathologic data are shown in supplemental Table 1, available on the Blood Web site. Targeted resequencing was performed on 176 additional formalin-fixed paraffin-embedded T-NHLs, the details of which are provided below. Healthy donor peripheral blood samples for T-cell studies were obtained as previously described.19 The study was approved by the Mayo Clinic Institutional Review Board.
Additional methods are detailed in supplemental Methods.
Results
Exome sequencing of T-NHL identifies a recurrent MSCE116K mutation
To better understand the genomic landscape of T-NHLs, we performed exome sequencing in 62 cases representing most major subtypes (supplemental Table 1). We performed variant-level analysis and identified 24 recurrent variants, each encountered in >1 sample (Table 1). We also performed gene-level analysis of somatic variants called in paired tumor-normal samples (supplemental Figure 2). The most frequent variant was the previously reported small GTPase mutation RHOAG17V,5,20,21 which was seen in 4 AITLs and 1 case of PTCL, NOS. The second most common variant was a previously unreported mutation, MSCE116K (chr8:72756068C>T), which was seen in 4 ALK− ALCLs (3 systemic and 1 cutaneous). MSC encodes musculin, previously called activated B-cell factor-1, a basic helix-loop-helix (bHLH) transcription factor initially characterized in skeletal muscle and activated B cells.22,23 Musculin interacts with bHLH E proteins (E2A/TCF3, TCF4/E2-2, and HEB/HTF4/TCF12) to form heterodimers that bind to E-box DNA sequences (CANNTG).23,24 The E116K mutation occurred in the ERXR motif within the α-1 basic chain in the DNA binding domain (Figure 1A-B). One additional ALCL had a distinct MSC mutation outside of the DNA binding domain (MSCG89D; chr8:72756148C>T).
Recurrent somatic variants identified by exome sequencing in 62 T-NHLs
| Chrom | Base | REF | ALT | Gene symbol | Ensembl Protein ID | Variant | Samples involved (n) | |
|---|---|---|---|---|---|---|---|---|
| Paired | Unpaired | |||||||
| chr3 | 49412973 | C | A | RHOA | ENSP00000400175 | G17V | 4 | 1 |
| chr8 | 72756068 | C | T | MSC | ENSP00000321445 | E116K | 3 | 1 |
| chr19 | 50265271 | G | A | TSKS | ENSP00000246801 | T130M | 1 | 1 |
| chr15 | 81271632 | CT | C | MESDC2 | ENSP00000261758 | FS | 1 | 1 |
| chr15 | 79750585 | TA | T | KIAA1024 | ENSP00000307461 | FS | 1 | 1 |
| chr14 | 60903564 | CA | C | C14orf39 | ENSP00000324920 | FS | 1 | 1 |
| chr12 | 4719361 | GA | G | DYRK4 | ENSP00000437534 | FS | 1 | 1 |
| chr8 | 124384892 | CT | C | ATAD2 | ENSP00000287394 | FS | 1 | 1 |
| chr6 | 4995423 | AT | A | RPP40 | ENSP00000369391 | FS | 1 | 1 |
| chr5 | 79970914 | CA | C | MSH3 | ENSP00000265081 | FS | 1 | 1 |
| chr2 | 99439493 | CG | C | C2orf55 | ENSP00000380996 | FS | 1 | 1 |
| chr9 | 140005175 | GATG | G | DPP7 | ENSP00000360635 | I469DEL | 0 | 4 |
| chr19 | 12903430 | C | T | JUNB | ENSP00000303315 | A282V | 0 | 3 |
| chr17 | 40474482 | T | A | STAT3 | ENSP00000264657 | Y640F | 0 | 3 |
| chr4 | 155160429 | A | C | DCHS2 | ENSP00000349768 | V2007G | 0 | 3 |
| chr21 | 40559143 | C | T | BRWD1 | ENSP00000330753 | V2258I | 0 | 2 |
| chr19 | 50393385 | A | C | IL4I1 | ENSP00000342557 | L438V | 0 | 2 |
| chr19 | 37880774 | C | T | ZNF527 | ENSP00000348501 | T608M | 0 | 2 |
| chr17 | 73619886 | A | G | MYO15B | ENSP00000293201 | D94G | 0 | 2 |
| chr17 | 25974411 | C | T | LGALS9 | ENSP00000378856 | R292* | 0 | 2 |
| chr15 | 22940793 | G | A | CYFIP1 | ENSP00000390623 | R353H | 0 | 2 |
| chr11 | 17388825 | C | T | RP1-239B22.1 | ENSP00000341637 | R231W | 0 | 2 |
| chr8 | 65711086 | G | A | CYP7B1 | ENSP00000310721 | P20L | 0 | 2 |
| chr3 | 101568755 | C | A | NFKBIZ | ENSP00000325663 | Q95K | 0 | 2 |
ALT, alternative sequence (variant); Chrom, chromosome; FS, frame shift; REF, reference sequence.
Stop codon.
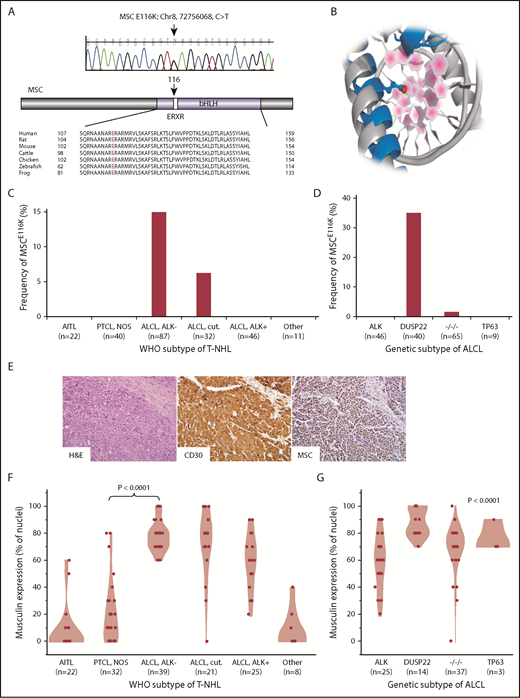
Recurrent MSCE116K mutations in ALK−ALCLs with DUSP22 rearrangements. (A) Sanger sequencing validated MSCE116K (chr8:72756068C>T) as shown (representative tracing from 3 independent samples). The mutation affected the conserved ERXR motif within the DNA binding domain of the bHLH transcription factor musculin. (B) Structural prediction of interaction between MSC (blue) and target DNA placed the mutated E116K residue (red) within the major groove. The model is superimposed on the TAL1:E2A experimental structure (gray) for comparison. (C) Data on 238 T-NHLs from exome sequencing and additional targeted resequencing of MSC identified MSCE116K exclusively in ALK− ALCLs, including systemic (ALCL, ALK−; frequency, 14.9%) and primary cutaneous (ALCL, cut.; 6.3%) types (P < .0001, cutaneous and systemic ALK− ALCLs vs all other subtypes, Fisher’s exact test,). Additional case details are given in supplemental Table 3. (D) Genetic subtyping of 160 ALCLs into ALK, DUSP22, TP63, and triple-negative (−/−/−) subtypes showed that MSCE116K was nearly exclusively associated with DUSP22 rearrangements (frequency, 35%; P < .0001, DUSP22 subtype vs all other subtypes, Fisher’s exact test). (E) ALK− ALCL with DUSP22 rearrangement and MSCE116K. Hematoxylin and eosin (H&E) stain shows sheets of large tumor cells (original magnification × 400). By immunohistochemistry, the tumor cells show strong and uniform staining for CD30 and musculin (nuclear staining pattern). See also supplemental Figure 4A. (F) Among WHO subtypes of T-NHL (N = 147), musculin protein expression was highest in systemic and cutaneous ALK− ALCLs. Data reflect the percentage of tumor cell nuclei positive for musculin by immunohistochemistry. Additional case details are given in supplemental Table 4. (G) Musculin expression was highest in ALCLs with DUSP22 rearrangements. The P value refers to differences among the 4 genetic subtypes.
Recurrent MSCE116K mutations in ALK−ALCLs with DUSP22 rearrangements. (A) Sanger sequencing validated MSCE116K (chr8:72756068C>T) as shown (representative tracing from 3 independent samples). The mutation affected the conserved ERXR motif within the DNA binding domain of the bHLH transcription factor musculin. (B) Structural prediction of interaction between MSC (blue) and target DNA placed the mutated E116K residue (red) within the major groove. The model is superimposed on the TAL1:E2A experimental structure (gray) for comparison. (C) Data on 238 T-NHLs from exome sequencing and additional targeted resequencing of MSC identified MSCE116K exclusively in ALK− ALCLs, including systemic (ALCL, ALK−; frequency, 14.9%) and primary cutaneous (ALCL, cut.; 6.3%) types (P < .0001, cutaneous and systemic ALK− ALCLs vs all other subtypes, Fisher’s exact test,). Additional case details are given in supplemental Table 3. (D) Genetic subtyping of 160 ALCLs into ALK, DUSP22, TP63, and triple-negative (−/−/−) subtypes showed that MSCE116K was nearly exclusively associated with DUSP22 rearrangements (frequency, 35%; P < .0001, DUSP22 subtype vs all other subtypes, Fisher’s exact test). (E) ALK− ALCL with DUSP22 rearrangement and MSCE116K. Hematoxylin and eosin (H&E) stain shows sheets of large tumor cells (original magnification × 400). By immunohistochemistry, the tumor cells show strong and uniform staining for CD30 and musculin (nuclear staining pattern). See also supplemental Figure 4A. (F) Among WHO subtypes of T-NHL (N = 147), musculin protein expression was highest in systemic and cutaneous ALK− ALCLs. Data reflect the percentage of tumor cell nuclei positive for musculin by immunohistochemistry. Additional case details are given in supplemental Table 4. (G) Musculin expression was highest in ALCLs with DUSP22 rearrangements. The P value refers to differences among the 4 genetic subtypes.
The ERXR motif is highly conserved within musculin across species (Figure 1A) and across bHLH proteins in humans (supplemental Figure 3A). Because there is no experimental 3-dimensional structure of musculin, we used homology-based methods25 to generate a model of MSC bound to DNA using the experimental TAL1:E2A heterodimer26 as a template (Figure 1B). From sequence comparison and structural modeling, MSC E166 is analogous to TAL1 E196 and E2A/TCF3 E555, glutamic acid residues that are the primary amino acids for sequence-specific hydrogen bonding with the target DNA sequence (E-box motif).26 Thus, sequence and structural data strongly support MSC E116 as a critical amino acid in sequence-specific DNA binding. A database search did not identify MSC mutations at amino acid position 116 reported in any cancer; however, a search for mutations involving the ERXR motif across bHLH genes revealed multiple recurrent nonsynonymous mutations (supplemental Table 2), with 13 of 22 (59%) unique mutations involving replacement of the glutamic acid residue (E) with the basic amino acid lysine (K) similar to MSCE116K. We also identified an E555K mutation in the ERXR motif of the bHLH gene TCF3 in an additional ALK− ALCL case in the exome discovery set (supplemental Figure 3B). Taken together, these findings identify a novel recurrent MSCE116K mutation in T-NHLs that involves a highly conserved residue recurrently mutated in other bHLH genes across a spectrum of human cancers.
MSCE116K occurs nearly exclusively in ALK− ALCLs with DUSP22 rearrangements
To dissect the distribution of MSCE116K further based on WHO T-NHL subtypes, we performed targeted resequencing in formalin-fixed paraffin-embedded tissue on 176 additional cases, for a total of 238 T-NHLs assessed for MSCE116K (summarized in supplemental Table 3). Fifteen T-NHLs with MSCE116K were identified (6.3%), including 13 of 87 systemic ALK− ALCLs (14.9%) and 2 of 32 primary cutaneous (ALK−) ALCLs (6.3%; Figure 1C). MSCE116K was not identified in ALK+ ALCL or any other T-NHL subtype (P < .0001 vs systemic and cutaneous ALK− ALCLs, Fisher’s exact test). The difference in frequency of MSCE116K between systemic and cutaneous ALK− ALCL was not statistically significant (P = .35). We also attempted to identify differences in copy number alterations (CNAs) from exome data or gene-expression profiles from microarray data13 between mutated and unmutated ALCLs. However, no significant differences were identified, possibly as a result of the small number of mutated samples available for these analyses (CNA, n = 4; microarray, n = 3).
We have previously demonstrated pronounced clinicopathologic differences among genetic subtypes of ALCLs stratified by rearrangements of ALK, DUSP22, TP63, or none of the 3 (triple negative).16,17,27,28 Notably, DUSP22-rearranged ALCLs, which are uniformly ALK−, have unique molecular features independent of the WHO stratification into systemic and cutaneous subtypes.29 Therefore, we evaluated the distribution of MSCE116K based on genetic subtype. Remarkably, 14 of 15 (93%) ALCLs with MSCE116K were of the DUSP22 subtype, and 14 of 40 (35%) ALCLs with DUSP22 rearrangements had MSCE116K (Figure 1D). No ALCL with ALK or TP63 rearrangement and only 1 triple-negative ALCL had MSCE116K (P < .0001 vs ALCL with DUSP22 rearrangement, Fisher’s exact test). Thus, MSCE116K occurs nearly exclusively in ALK− ALCLs with DUSP22 rearrangements.
Musculin is highly expressed in ALK− ALCLs with DUSP22 rearrangements
The role of musculin in T-NHL is unknown. To understand the possible implications of MSCE116K, we first assessed the expression of musculin across WHO subtypes of T-NHL by immunohistochemistry (Figure 1E; supplemental Figure 4A). Among 147 T-NHLs (summarized in supplemental Table 4), musculin expression was highest in ALCLs, particularly in systemic and cutaneous ALK− ALCLs (mean percentage of tumor cell nuclei with positive staining ± standard deviation [SD], 77.9% ± 11.5% and 71.4% ± 25.6%, respectively; Figure 1F). Corroborating the gene-expression data reported by Agnelli et al,30 musculin was expressed at the protein level significantly more in systemic ALK− ALCL than in PTCL, NOS (20.0% ± 23.3%; P < .0001, Wilcoxon test), suggesting a potential role in diagnostic practice where current markers for this distinction are suboptimal.3 Musculin expression also varied among genetic subtypes of ALCL (P < .0001, Kruskal-Wallis test) and was highest in DUSP22-rearranged cases (87.9% ± 10.5%) and lowest in ALK+ ALCL (58.8% ± 20.3%; Figure 1G). Therefore, the distribution of musculin protein expression closely mirrored that of MSCE116K. Accordingly, ALCLs with MSCE116K had higher musculin protein expression than ALCLs without MSCE116K (93.3% ± 8.2% vs 68.0% ± 18.1%, respectively; P = .0004, Wilcoxon test; supplemental Figure 4B). Similar relationships were observed in previously published gene-expression data from 31 ALCLs,13,29 which showed consistently high MSC expression in ALCLs with DUSP22 rearrangements (supplemental Figure 4C), as well as higher expression in ALCLs with vs without MSCE116K (log2 expression, 9.2 ± 0.7 vs 5.9 ± 1.6; P = .006, Wilcoxon test; supplemental Figure 4D). Taken together, these findings indicate that musculin expression in T-NHLs is highest in ALK− ALCLs and particularly those with DUSP22 rearrangements, including cases with MSCE116K.
MSCE116K sequesters bHLH proteins and prevents heterodimer binding to canonical musculin and E2A target sequences
We next sought to understand the functional role of wild-type musculin (MSCwt) and MSCE116K in ALCL. We cloned the MSC gene, created an MSCE116K construct using in vitro mutagenesis, and stably introduced these constructs into Karpas 299 cells, an ALK+ cell line that lacks MSC mutations (data not shown) and has low musculin expression (Figure 2A). Cells transduced with MSCE116K had higher musculin expression than those transduced with MSCwt, as well as increased expression of the E proteins and known musculin heterodimerization partners E2A and HEB. MSCwt, MSCE116K, E2A, and HEB all localized primarily to the nucleus.
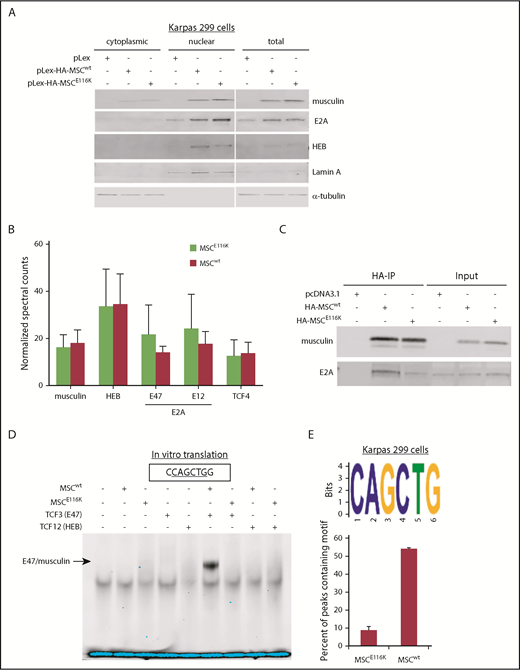
MSCE116K disrupts musculin DNA binding but not protein interactions. (A) MSCwt and MSCE116K were expressed primarily in the nuclear fraction in Karpas 299 cells. MSCE116K is expressed more highly than MSCwt. A representative example from 3 independent experiments is shown. (B) Immunoprecipitation of HA-tagged MSCwt and MSCE116K in Karpas 299 cells, followed by mass spectrometry, revealed similar musculin:E-protein interactions. There was a slightly increased interaction between MSCE116K and E2A isoforms, although none of the differences was statistically significant. Data are shown as mean ± SD from 3 independent experiments. See also supplemental Table 5. (C) Western blot of immunoprecipitated musculin and E2A from experiment shown in (B). Input is also shown. (D) Electrophoretic mobility shift assay of proteins generated by in vitro translation of the indicated genes showed binding of E47/musculin heterodimers to the musculin-binding E-box motif CAGCTG in the presence of MSCwt but not MSCE116K. A representative example from 4 independent experiments is shown. (E) ChIP-seq for HA-tagged MSCwt and MSCE116K in Karpas 299 cells identified the CAGCTG E-box motif as the primary motif for MSCwt (E-value = 1.40E−176) but not for MSCE116K. See also supplemental Figure 8.
MSCE116K disrupts musculin DNA binding but not protein interactions. (A) MSCwt and MSCE116K were expressed primarily in the nuclear fraction in Karpas 299 cells. MSCE116K is expressed more highly than MSCwt. A representative example from 3 independent experiments is shown. (B) Immunoprecipitation of HA-tagged MSCwt and MSCE116K in Karpas 299 cells, followed by mass spectrometry, revealed similar musculin:E-protein interactions. There was a slightly increased interaction between MSCE116K and E2A isoforms, although none of the differences was statistically significant. Data are shown as mean ± SD from 3 independent experiments. See also supplemental Table 5. (C) Western blot of immunoprecipitated musculin and E2A from experiment shown in (B). Input is also shown. (D) Electrophoretic mobility shift assay of proteins generated by in vitro translation of the indicated genes showed binding of E47/musculin heterodimers to the musculin-binding E-box motif CAGCTG in the presence of MSCwt but not MSCE116K. A representative example from 4 independent experiments is shown. (E) ChIP-seq for HA-tagged MSCwt and MSCE116K in Karpas 299 cells identified the CAGCTG E-box motif as the primary motif for MSCwt (E-value = 1.40E−176) but not for MSCE116K. See also supplemental Figure 8.
The higher protein expression of MSCE116K than of MSCwt was a phenomenon observed in all cell models and vector systems examined. This could reflect, in part, preferential in vitro selection of MSCE116K-transduced cells; however, because this differential expression was also observed in human ALCL tissue samples, we examined relative expression of MSCwt and MSCE116K over time after exposure to cycloheximide and identified increased protein stability of MSCE116K (supplemental Figure 5).
To evaluate musculin binding partners and the effect of the E116K mutation on protein–protein interactions, we used mass spectrometry to identify proteins coimmunoprecipitated with hemagglutinin (HA)-tagged MSCwt or MSCE116K in Karpas 299 cells (supplemental Table 5). E2A (TCF3), HEB (TCF12), and TCF4 were the most abundant transcription factors coimmunoprecipitated and, overall, showed a similar distribution for MSCwt and MSCE116K (Figure 2B-C).
We then used an electrophoretic mobility shift assay to assess the ability of MSCE116K to bind to the previously reported musculin-binding E-box motif CAGCTG.31 In vitro translation was used to test the ability of MSCwt, MSCE116K, and the E2A splice variant E47 to bind to the oligonucleotide alone and in combination. In the presence of MSCwt, E47 preferentially bound as an E47/musculin heterodimer (Figure 2D). Heterodimer binding was completely abolished in the presence of MSCE116K. We also examined binding to the known E2A-binding E-box motif CAGGTG.32 Again, E47/musculin heterodimers were observed in the presence of MSCwt but not MSCE116K (supplemental Figure 6A). E47 homodimer binding to CAGGTG was observed when E47 alone was introduced, but it was abolished in the presence of MSCwt or MSCE116K. The TCF3 (E47) E555K mutation similarly diminished E47/musculin heterodimer binding to the CAGCTG and CAGGTG motifs (supplemental Figure 6B-C), consistent with its previously reported dominant-negative function.33 To confirm the loss of E-box motif binding in ALCL cells, we performed a DNA affinity assay for MSCwt and MSCE116K expressed in Karpas 299 cells. Using the musculin-binding CAGCTG oligonucleotide probe, musculin and E2A proteins were pulled down from cells transduced with MSCwt but not MSCE116K (supplemental Figure 7).
To more fully characterize musculin binding motifs in ALCL cells and examine the possibility that MSCE116K preferentially bound to an alternate motif, we then performed chromatin immunoprecipitation (ChIP) sequencing (ChIP-seq) for HA-tagged MSCwt and MSCE116K in stably transduced Karpas 299 cells. ChIP-seq motif analysis identified CAGCTG as the major MSCwt binding motif (E-value = 1.40E−176), but this motif was minimally present with MSCE116K (Figure 2E). This finding was replicated in ALK− FE-PD cells (supplemental Figure 8). Although DNA binding peaks were present for MSCE116K, a dominant binding motif could not be identified (supplemental Figure 9). Taken together, these findings indicate that MSCE116K retains the ability to form heterodimers but fails to bind to canonical musculin and E2A target sequences, thus sequestering E-box proteins and preventing them from engaging in functional heterodimer–DNA interactions.
MSCE116K promotes growth of normal and neoplastic T cells
To explore the functional impact of MSCwt and MSCE116K on T-cell biology, we evaluated their effects through lentiviral transduction of normal human CD4+ T cells. Expression of MSCwt markedly inhibited T-cell growth (17.6% ± 4.8% of control; P = .003; Figure 3A-B). This effect was completely reversed by MSCE116K (P = .0003 vs MSCwt), and there was an additional 40.2% increased growth over control with a trend toward significance (P = .05). Cell cycle analysis indicated that these growth differences were associated with G1 arrest (Figure 3C). Furthermore, coexpression of normal CD4+ T cells with MSCwt and MSCE116K rescued cells from the growth inhibition induced by MSCwt alone (P = .01; Figure 3D). In the context of the finding that MSCE116K sequestered MSC heterodimerization partners but failed to bind to DNA, these data support a dominant-negative function for MSCE116K.
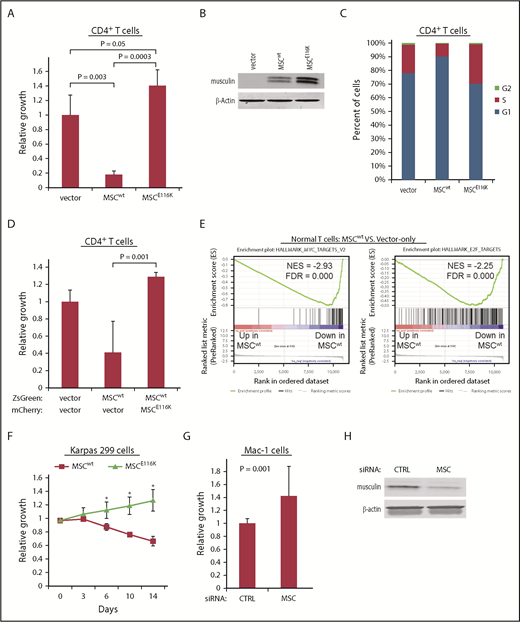
MSCE116K promotes growth of normal and neoplastic T cells. (A) MSCwt inhibited cell growth in normal CD4+ T cells stimulated with anti-CD3/CD28. Growth inhibition was completely reversed by MSCE116K with an additional trend toward increased growth over baseline control. (B) Western blot of musculin expression in cells from the experiment shown in (A). (C) MSCwt inhibited cell cycle progression via G1 arrest; G1 arrest was reversed by MSCE116K. (D) Coexpression of normal CD4+ T cells with MSCwt and MSCE116K rescued cells from the growth inhibition induced by MSCwt alone. Cells were flow sorted for ZsGreen and mCherry double positivity prior to evaluation. Representative results from 3 independent experiments. The Student t test was used to compare results. (E) GSEA of genes differentially expressed in CD4+ T cells overexpressing MSCwt vs control-transduced cells showed depletion of genes encoding MYC and E2F targets. (F) Overexpression of MSCwt inhibited growth in MSClow Karpas 299 cells, whereas overexpression of MSCE116K promoted growth. Data show growth relative to vector control in a competitive growth assay; error bars reflect 3 independent experiments. (G) Small interfering RNA (siRNA) knockdown of MSC increased cell growth in MSChigh Mac-1 cells relative to cells treated with a control siRNA. Data reflect 3 independent experiments. The Student t test was used to compare results. (H) Western blot of musculin expression in cells from the experiment shown in (G). *P < .05, MSCwt vs MSCE116K.
MSCE116K promotes growth of normal and neoplastic T cells. (A) MSCwt inhibited cell growth in normal CD4+ T cells stimulated with anti-CD3/CD28. Growth inhibition was completely reversed by MSCE116K with an additional trend toward increased growth over baseline control. (B) Western blot of musculin expression in cells from the experiment shown in (A). (C) MSCwt inhibited cell cycle progression via G1 arrest; G1 arrest was reversed by MSCE116K. (D) Coexpression of normal CD4+ T cells with MSCwt and MSCE116K rescued cells from the growth inhibition induced by MSCwt alone. Cells were flow sorted for ZsGreen and mCherry double positivity prior to evaluation. Representative results from 3 independent experiments. The Student t test was used to compare results. (E) GSEA of genes differentially expressed in CD4+ T cells overexpressing MSCwt vs control-transduced cells showed depletion of genes encoding MYC and E2F targets. (F) Overexpression of MSCwt inhibited growth in MSClow Karpas 299 cells, whereas overexpression of MSCE116K promoted growth. Data show growth relative to vector control in a competitive growth assay; error bars reflect 3 independent experiments. (G) Small interfering RNA (siRNA) knockdown of MSC increased cell growth in MSChigh Mac-1 cells relative to cells treated with a control siRNA. Data reflect 3 independent experiments. The Student t test was used to compare results. (H) Western blot of musculin expression in cells from the experiment shown in (G). *P < .05, MSCwt vs MSCE116K.
We then performed RNA sequencing and gene set enrichment analysis (GSEA) on transduced normal T cells to identify candidate mechanisms responsible for these functional effects. Consistent with the inhibition of cell cycle and growth by MSCwt in normal T cells, top GSEA pathways comparing MSCwt-transduced with vector only–transduced CD4+ T cells included negative associations with MYC targets, MTORC1 signaling, and E2F targets (Figure 3E; supplemental Table 6). The same GSEA pathways were identified as those most positively regulated when comparing MSCE116K-transduced and MSCwt-transduced CD4+ T cells (supplemental Figure 10A; supplemental Table 7). Importantly, E2F and MYC targets also were recently found to be top gene sets enriched in ALCLs with DUSP22 rearrangements.29 Consistent with the proposed dominant-negative function of MSCE116K, no GSEA pathway was identified as being significantly enriched (FWER P < .05) when comparing MSCE116K-transduced and vector only–transduced CD4+ T cells, which lack native musculin; specifically, the E2F and MYC target gene sets were not enriched (supplemental Figure 10B).
We then examined growth of ALCL cells with MSCwt and MSCE116K. Competitive growth assays in MSClow Karpas 299 cells demonstrated growth inhibition by MSCwt and accelerated growth with MSCE116K (mutant/wild-type growth ratio = 1.9 at day 14, P < .05; Figure 3F). Accordingly, MSC knockdown in MSChigh Mac-1 cells significantly increased cell growth by 42.1% (P = .001; Figure 3G-H).
MSCE116K blocks expression of the MSCwt target and cell cycle inhibitor E2F2
We next sought to identify candidate musculin transcriptional targets that might underlie the functional effects of MSCE116K in ALCL cells. We performed ChIP-seq for HA-tagged MSCwt and MSCE116K in Karpas 299 cells and examined differential peaks in the context of RNA sequencing (RNAseq) and GSEA findings to identify E2F2, a member of the E2F family of transcription factors that regulates cell cycle genes (Figure 4A). Although E2F2 is often classified as a transcriptional activator (E2F1-3) rather than a repressor (E2F4-8), E2F family members have complex and context-specific roles; specifically, E2F2 has been shown to suppress expression of target genes in T lymphocytes and to exhibit tumor-suppressor function in MYC-induced T-cell lymphomagenesis.34-36 E2F2 expression was induced 4.7-fold by MSCwt, and this induction was largely reversed by MSCE116K (Figure 4B). Furthermore, ChIP in normal T cells showed diminished binding of MSCE116K to the E2F2 gene locus (Figure 4C). To evaluate the function of E2F2 in ALCL cells, we overexpressed E2F2 in Karpas 299 cells and observed G1 arrest (Figure 4D). Furthermore, in keeping with MSCE116K inhibiting the expression of repressive E2F2, MSCE116K increased E2F reporter activity 1.7-fold over MSCwt (P = .001; Figure 4E). Taken together, these data indicate that MSCE116K blocks the ability of MSCwt to transcriptionally regulate E2F2 and suggest that MSCE116K reverses E2F2-mediated cell cycle inhibition.

E2F2 is a transcriptional target of MSCwt that inhibits the cell cycle in ALCL cells. (A) ChIP-seq in Karpas 299 cells showed binding of MSCwt, but not MSCE116K, to several sites upstream and downstream of the E2F2 transcriptional start site. NR_110799 represents an uncharacterized noncoding RNA gene, LOC101928163, which was not expressed at the RNA level in any of the samples. The data shown are from the same ChIP-seq experiment as the motif analysis shown in Figure 2E. (B) Corresponding RNAseq data showed a 4.7-fold induction of E2F2 expression in Karpas 299 cells transduced with MSCwt compared with vector-only control that was largely reversed by MSCE116K. Representative results from 2 independent experiments. (C) ChIP in normal T cells confirmed MSCwt binding to E2F2. (D) Overexpression of E2F2 in Karpas 299 cells, which have low basal levels of MSC and E2F2, inhibited cell cycle progression via G1 arrest. (E) MSCE116K increased E2F reporter activity in luciferase assays, consistent with its ability to block expression of repressive E2F2. Data reflect 3 independent experiments and are shown as mean ± SD. The Student t test was used to compare results. RPKM, reads per kilobase of transcript per million mapped reads.
E2F2 is a transcriptional target of MSCwt that inhibits the cell cycle in ALCL cells. (A) ChIP-seq in Karpas 299 cells showed binding of MSCwt, but not MSCE116K, to several sites upstream and downstream of the E2F2 transcriptional start site. NR_110799 represents an uncharacterized noncoding RNA gene, LOC101928163, which was not expressed at the RNA level in any of the samples. The data shown are from the same ChIP-seq experiment as the motif analysis shown in Figure 2E. (B) Corresponding RNAseq data showed a 4.7-fold induction of E2F2 expression in Karpas 299 cells transduced with MSCwt compared with vector-only control that was largely reversed by MSCE116K. Representative results from 2 independent experiments. (C) ChIP in normal T cells confirmed MSCwt binding to E2F2. (D) Overexpression of E2F2 in Karpas 299 cells, which have low basal levels of MSC and E2F2, inhibited cell cycle progression via G1 arrest. (E) MSCE116K increased E2F reporter activity in luciferase assays, consistent with its ability to block expression of repressive E2F2. Data reflect 3 independent experiments and are shown as mean ± SD. The Student t test was used to compare results. RPKM, reads per kilobase of transcript per million mapped reads.
MSCE116K induces expression of the CD30–IRF4–MYC axis
Expression of CD30 encoded by the TNFRSF8 gene is a defining and biologically critical hallmark of ALCL that drives a positive-feedback loop with the transcription factor IRF4 resulting in MYC expression.3,19,37 Because the MYC transcriptional program was the top GSEA hit following overexpression of MSCE116K, we examined the relationship of MSCE116K to the CD30–IRF4–MYC axis. Indeed, MSCE116K increased TNFRSF8 expression 5.7-fold over MSCwt in CD4+ T cells (Figure 5A) and increased CD30 at the protein level (Figure 5A-B). MSCE116K also increased expression of MYC and IRF4, as well as BATF3 and JUNB, which cooperate in IRF4 transcriptional activity (Figure 5C).38,39 Upregulation of TNFRSF8 and MYC was also observed in Karpas 299 cells transduced with MSCE116K (Figure 5D).
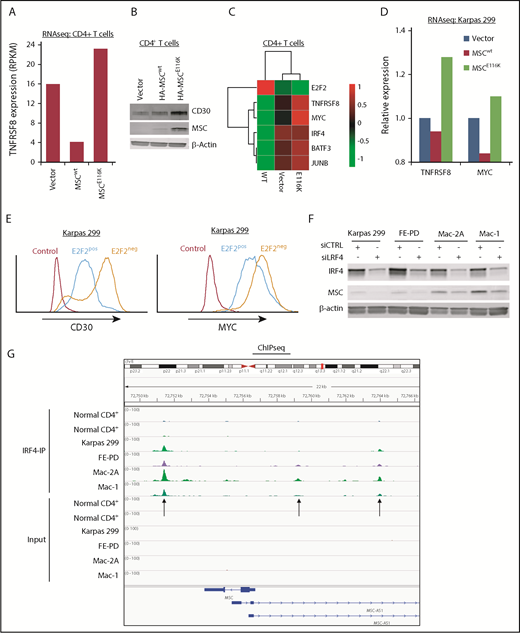
MSCE116K augments expression of the CD30–IRF4–MYC axis in normal and neoplastic T cells. (A) Expression of the TNFRSF8 gene encoding CD30 is increased in normal T cells transduced with MSCE116K. Data are from RNAseq. Representative results from 2 independent experiments. (B) CD30 protein expression is increased in normal T cells transduced with MSCE116K. (C) Heat map showing downregulation of E2F2 and upregulation of genes involved in the CD30–IRF4–MYC axis in response to MSCE116K in normal CD4+ T cells. Data are from RNAseq. Representative results from 2 independent experiments. (D) Expression levels of TNFRSF8 and MYC are increased in Karpas 299 cells transduced with MSCE116K. These RNAseq data are from the same experiment shown in Figure 4B. Representative results from 2 independent experiments. (E) Overexpression of E2F2 in Karpas 299 cells decreases expression of CD30 and MYC. Data are from flow cytometry. Representative results from 3 independent experiments. (F) IRF4 knockdown in ALCL cell lines decreases MSC expression. (G) IRF4 ChIP-seq demonstrates binding of IRF4 to the MSC locus 2.3 kb downstream and 2.4 kb and 7.2 kb upstream of the transcriptional start site in ALCL cell lines. MSC-AS1 is a noncoding RNA gene that was minimally expressed at the RNA level and showed no significant differential expression after IRF4 knockdown. RPKM, reads per kilobase of transcript per million mapped reads.
MSCE116K augments expression of the CD30–IRF4–MYC axis in normal and neoplastic T cells. (A) Expression of the TNFRSF8 gene encoding CD30 is increased in normal T cells transduced with MSCE116K. Data are from RNAseq. Representative results from 2 independent experiments. (B) CD30 protein expression is increased in normal T cells transduced with MSCE116K. (C) Heat map showing downregulation of E2F2 and upregulation of genes involved in the CD30–IRF4–MYC axis in response to MSCE116K in normal CD4+ T cells. Data are from RNAseq. Representative results from 2 independent experiments. (D) Expression levels of TNFRSF8 and MYC are increased in Karpas 299 cells transduced with MSCE116K. These RNAseq data are from the same experiment shown in Figure 4B. Representative results from 2 independent experiments. (E) Overexpression of E2F2 in Karpas 299 cells decreases expression of CD30 and MYC. Data are from flow cytometry. Representative results from 3 independent experiments. (F) IRF4 knockdown in ALCL cell lines decreases MSC expression. (G) IRF4 ChIP-seq demonstrates binding of IRF4 to the MSC locus 2.3 kb downstream and 2.4 kb and 7.2 kb upstream of the transcriptional start site in ALCL cell lines. MSC-AS1 is a noncoding RNA gene that was minimally expressed at the RNA level and showed no significant differential expression after IRF4 knockdown. RPKM, reads per kilobase of transcript per million mapped reads.
Tnfrsf8 was previously identified in a ChIP study of genes bound to E2F2 in mouse lymphocytes.35 To confirm this interaction in human ALCL cells, we performed ChIP for HA-tagged E2F2 in Karpas 299 cells and identified binding to 2 sites in TNFRSF8 (supplemental Figure 11). Furthermore, overexpression of E2F2 in Karpas 299 cells decreased expression of CD30 and MYC at the protein level (Figure 5E).
Because IRF4 directly regulates transcription of TNFRSF8 and MYC,19,40 we next investigated whether MSCE116K was also involved in the CD30-IRF4 positive-feedback loop. Small interfering RNA–mediated knockdown of IRF4 in ALCL cell lines decreased musculin expression in 4 of 4 ALCL cell lines tested (Figure 5F). Furthermore, ChIP-seq demonstrated binding of IRF4 to MSC (Figure 5G), in addition to TNFRSF8 and MYC as expected (data not shown). These data suggest that IRF4 transcriptionally regulates MSC expression; because MSCE116K, but not MSCwt, induces the CD30–IRF4–MYC axis, it provides evidence for a positive-feedback loop involving MSCE116K and IRF4.
Potential therapeutic targeting of ALCLs with MSCE116K
Although CD30 and IRF4 are consistently expressed in essentially all ALCLs,19,41,42 MYC expression varies within ALCL and across T-NHLs.43-45 Therefore, we examined MYC expression by immunohistochemistry in 83 T-NHLs with known MSC mutation status (summarized in supplemental Table 8). MYC expression was higher in ALCLs with MSCE116K (56% ± 28% tumor cell nuclei with positive staining) than in ALCLs without MSCE116K (33% ± 29%, P < .05, Wilcoxon test) or non-ALCL T-NHLs without MSCE116K (20% ± 21%, P = .005, Wilcoxon test; Figure 6A-B). We also examined Ki67 staining in 68 ALCLs and found a higher proliferative rate in those with MSCE116K (83% ± 21% tumor cell nuclei with positive staining) than in ALCLs without MSCE116K (50% ± 31%, P = .0009, Wilcoxon test; supplemental Figure 12). We did not observe a significant association between MSCE116K and overall survival, although the number of mutated cases with available outcome data was limited (supplemental Figure 13).
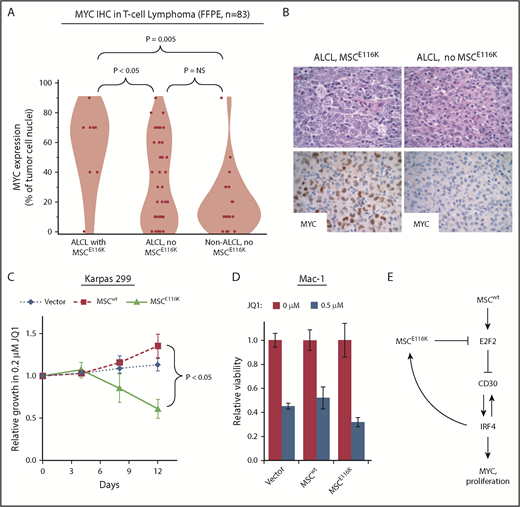
Potential therapeutic targeting of ALCLs with MSCE116K. (A) Immunohistochemistry for MYC in 83 T-NHLs with and without MSCE116K, as indicated. Additional case details are given in supplemental Table 8. (B) Representative MYC expression in ALCLs with and without MSCE116K. (C) Karpas 299 cells expressing MSCE116K are more sensitive to JQ1 than are cells expressing MSCwt. Data represent relative fractions of GFP− cells in 0.2 μM JQ1 compared with vehicle for each of the constructs in competition with Karpas 299 cells overexpressing GFP. Summary of 3 independent experiments. (D) Treatment of Mac-1 cells stably expressing MSCwt or MSCE116K with JQ1 revealed increased sensitivity of MSCE116K to JQ1 compared with MSCwt (P = .004). (E) Model of interactions among MSC, E2F2, CD30, IRF4, and MYC in ALCL cells with MSCwt or MSCE116K. Briefly, MSCwt transcriptionally regulates E2F2 (Figure 4), and the resultant E2F2 protein represses expression of TNFRSF8 encoding CD30 (Figure 5). MSCE116K sequesters bHLH proteins but fails to bind to DNA, preventing heterodimer binding to canonical musculin and E2A target sequences (Figure 2) and inhibiting E2F2-mediated repression of CD30 (Figure 5). CD30 and IRF4 augment each other’s expression in a positive-feedback loop that leads to increased MYC expression and proliferation, as described previously.39 In addition, IRF4 transcriptionally regulates MSC to increase expression of MSCE116K, further augmenting expression of the CD30–IRF4–MYC axis (Figure 5). Although transcriptional regulation of MSC by IRF4 may also increase expression of MSCwt, this arrow is not indicated in the model because IRF4-MSCwt is not implicated in the same positive-feedback mechanism as IRF4-MSCE116K, MSCwt function is inhibited by the presence of dominant-negative MSCE116K, and MSCwt protein is less stable than MSCE116K and is present at lower levels. NS, not significant.
Potential therapeutic targeting of ALCLs with MSCE116K. (A) Immunohistochemistry for MYC in 83 T-NHLs with and without MSCE116K, as indicated. Additional case details are given in supplemental Table 8. (B) Representative MYC expression in ALCLs with and without MSCE116K. (C) Karpas 299 cells expressing MSCE116K are more sensitive to JQ1 than are cells expressing MSCwt. Data represent relative fractions of GFP− cells in 0.2 μM JQ1 compared with vehicle for each of the constructs in competition with Karpas 299 cells overexpressing GFP. Summary of 3 independent experiments. (D) Treatment of Mac-1 cells stably expressing MSCwt or MSCE116K with JQ1 revealed increased sensitivity of MSCE116K to JQ1 compared with MSCwt (P = .004). (E) Model of interactions among MSC, E2F2, CD30, IRF4, and MYC in ALCL cells with MSCwt or MSCE116K. Briefly, MSCwt transcriptionally regulates E2F2 (Figure 4), and the resultant E2F2 protein represses expression of TNFRSF8 encoding CD30 (Figure 5). MSCE116K sequesters bHLH proteins but fails to bind to DNA, preventing heterodimer binding to canonical musculin and E2A target sequences (Figure 2) and inhibiting E2F2-mediated repression of CD30 (Figure 5). CD30 and IRF4 augment each other’s expression in a positive-feedback loop that leads to increased MYC expression and proliferation, as described previously.39 In addition, IRF4 transcriptionally regulates MSC to increase expression of MSCE116K, further augmenting expression of the CD30–IRF4–MYC axis (Figure 5). Although transcriptional regulation of MSC by IRF4 may also increase expression of MSCwt, this arrow is not indicated in the model because IRF4-MSCwt is not implicated in the same positive-feedback mechanism as IRF4-MSCE116K, MSCwt function is inhibited by the presence of dominant-negative MSCE116K, and MSCwt protein is less stable than MSCE116K and is present at lower levels. NS, not significant.
Bromodomain and extraterminal domain (BET) inhibitors represent a promising group of therapeutics that inhibit YAP/p21/MYC signaling, MYC and IRF4 expression, and the E2F and mTORC pathways.46-48 Because MYC, E2F, and mTORC represented the top gene sets associated with MSCE116K overexpression by GSEA, we investigated potential therapeutic targeting of ALCLs with MSCE116K with the BET inhibitor JQ1. Overexpression of MSCE116K rendered Karpas 299 cells more sensitive to JQ1 in competitive growth assays, whereas MSCwt-overexpressing cells were less sensitive than control-transduced cells (P < .05; Figure 6C). The increased sensitivity to JQ1 conferred by MSCE116K was confirmed in another ALCL cell line, Mac-1. Relative viability at 72 hours with 0.5 μM JQ1 in Mac-1 cells transduced with MSCE116K was 32% ± 4% compared with 52% ± 9% in cells transduced with MSCwt (P = .004, Wilcoxon test) and 45% ± 2% in cells transduced with empty vector (P = .004; Figure 6D). Although clinical translation of this observation requires additional study, these data confirm that tumors with MSCE116K might be specifically targeted pharmacologically.
A model summarizing the interrelationships among mutant and wild-type MSC, E2F2, CD30, IRF4, and MYC is shown in Figure 6E.
Discussion
We report the discovery and characterization of a novel recurrent mutation, MSCE116K, in the gene encoding musculin, a bHLH transcription factor previously uncharacterized in T-NHL. MSCE116K occurred exclusively in ALK− ALCLs and was associated with DUSP22 rearrangements in 93% of cases. MSCE116K is one of the most common variants in systemic ALK− ALCL, with a 15% frequency, similar to JAK1 mutations.12 Functional analysis identified a dominant-negative function for MSCE116K, including disruption of binding to canonical musculin target sequences, sequestration of musculin heterodimerization partners, and promotion of cell growth through upregulation of the IRF4–CD30–MYC axis.19 Furthermore, ALCL cells overexpressing MSCE116K showed increased sensitivity to the BET inhibitor JQ1. These findings deepen our understanding of the molecular pathogenesis of ALCL and have potential therapeutic implications.
MSCE116K represents the first recurrent MSC mutation reported in human cancer. However, recurrent E>K amino acid substitutions in the conserved ERXR motif of other bHLH transcription factors were found to be present in a variety of malignancies. We also identified an ALK− ALCL without MSCE116K carrying TCF3E555K, a mutation recurrent in isolated agammaglobulinemia and also reported in Burkitt lymphoma.33,49 The dominant-negative function that we demonstrate for MSCE116K is similar to that of TCF3E555K and native Id proteins50 in that MSCE116K not only cannot participate in functional transcriptional regulation, but also sequesters other bHLH proteins and prevents them from forming functional dimers. Additionally, we identified a positive-feedback loop with the master transcription factor IRF4 that provides an explanation for the higher expression of MSCE116K over MSCwt in tissue samples and in vitro, and likely further accentuates the dominant-negative effect of MSCE116K.
The role of musculin in T-cell neoplasia has not been characterized previously. Also called MyoR and named for its role in myogenesis,22,51 musculin is critical in B-cell differentiation and is alternately known as activated B-cell factor-1.52 MSC is silenced by promoter DNA methylation in B-cell lymphomas,53 and its expression antagonizes the B-cell program in Hodgkin lymphoma.54 Recently, T-cell subset–specific roles have been defined for musculin, including T helper 2 cell suppression, promotion of induced regulatory T cell development, and suppression of interleukin-2–induced STAT5B activation in T helper 17 cells.55,56 Wu et al have shown that Msc−/− mice developed gastrointestinal and pulmonary inflammation associated with an inability to suppress T helper 2 cell responses, although lymphoma development was not reported.56 However, Tcf3−/− mice develop T-cell tumors,57,58 and 70% of Sézary T-cell lymphomas have TCF3 deletions associated with activation of MYC and cell cycle progression,59 similar to functions that we demonstrated for MSCE116K.
Although musculin acts mainly as a transcriptional repressor in myogenesis,51 our data indicate that it positively regulates expression of the E2F family member E2F2 in ALCL cells. We focused on E2F2 because of its tumor-suppressive role in inhibiting MYC-induced T-cell lymphomagenesis36 and the GSEA finding that MSCE116K led to enrichment of MYC and E2F transcriptional targets in normal and neoplastic T cells. Indeed, we showed directly that E2F2 inhibited MYC expression in ALCL cells, that ALCLs with MSCE116K showed upregulation of the CD30–IRF4–MYC axis, and that MSCE116K conferred increased sensitivity to the BET inhibitor JQ1. In addition to the potential therapeutic significance of this finding, it is likely that MSCE116K contributes to the molecular pathogenesis of a unique subset of ALK− ALCLs recently identified that include ALCLs with DUSP22 rearrangements and show enrichment of MYC and E2F transcriptional targets.29 These cases were characterized by their lack of expression of phosphorylated (p)STAT3 and JAK-STAT3–associated genes. Notably, all ALCLs show high expression of CD30, regardless of pSTAT3 expression. Although pSTAT3 drives CD30 expression in ALK+ and other kinase-driven ALCLs,12,60 alternative mechanisms have not been described to explain CD30 expression in pSTAT3− ALCLs, including those with DUSP22 rearrangements.29 We provide evidence that MSCE116K represents 1 such mechanism by acting in a dominant-negative fashion and blocking the ability of MSCwt to drive E2F2-mediated inhibition of CD30 expression. However, other similar mechanisms likely exist, because MSCE116K occurs in only 35% of ALCLs with DUSP22 rearrangements. Of note, the case of ALK− ALCL in which we identified TCF3E555K also belonged to the STAT3− cluster of ALCLs recently reported,29 suggesting the possibility of more widespread dysregulation of bHLH transcription factors in pSTAT3− ALCLs.
The striking association between MSCE116K and DUSP22 rearrangements suggests likely functional synergy between these 2 events. ALCLs with DUSP22 rearrangements have diminished DUSP22 expression through disruption of the DUSP22 locus on 6p25.3.14 DUSP22 encodes a dual-specificity phosphatase that is critical in mitogen-activated protein kinase and T-cell receptor signaling.61,62 Functionally, DUSP22 has been shown to induce apoptosis,63-65 and Dusp22−/− mice spontaneously develop T-cell–mediated inflammation and autoimmunity.62 Therefore, cell cycle progression via MSCE116K-induced MYC expression and simultaneous inhibition of apoptosis through the loss of DUSP22 might represent a novel type of “double hit,” mechanistically analogous to double-hit B-cell lymphomas bearing simultaneous translocations leading to upregulation of MYC and the antiapoptotic gene BCL2.66 Furthermore, because BCL2 rearrangements typically precede MYC rearrangements in double-hit B-cell lymphoma and based on the higher frequency of DUSP22 rearrangement compared with MSCE116K in ALCL, DUSP22 rearrangements might represent an earlier event during ALCL lymphomagenesis, with subsequent acquisition of MSCE116K. However, unlike double-hit B-cell lymphomas and despite their high proliferative rate and MYC expression, ALCLs with DUSP22 rearrangement and MSCE116K appear to have favorable outcomes; this finding might relate to pronounced immunogenicity of ALCLs with DUSP22 rearrangement29 or to the unique sensitivity of these tumors to current treatment regimens. Further study is needed to identify the mechanisms responsible for the co-occurrence and selection of cells with DUSP22 rearrangement and MSCE116K, as well as to determine whether these cases should be considered a clinicopathologically distinct subset of ALK− ALCL.
Presented in abstract form at the 57th annual meeting of the American Society of Hematology, Orlando, FL, 6 December 2015.
The online version of this article contains a data supplement.
The publication costs of this article were defrayed in part by page charge payment. Therefore, and solely to indicate this fact, this article is hereby marked “advertisement” in accordance with 18 USC section 1734.
Acknowledgments
This work was supported by grant 123012-RSG-12-193-01-TBE from the American Cancer Society (A.L.F.); grants R01 CA177734 (A.L.F.), P30 CA15083 (Mayo Clinic Cancer Center), and P50 CA97274 (University of Iowa/Mayo Clinic Lymphoma SPORE) from the National Institutes of Health, National Cancer Institute; Clinical and Translational Science Award UL1 TR000135 from the National Center for Advancing Translational Science; grant CI-48-09 from the Damon Runyon Cancer Research Foundation (A.L.F.); the Department of Laboratory Medicine and Pathology, Mayo Clinic; the Center for Individualized Medicine, Mayo Clinic; and the Predolin Foundation.
Authorship
Contribution: R.A.L. designed the research, performed research, analyzed and interpreted data, and wrote the manuscript; M.T.Z. designed research and analyzed and interpreted data; G.H., N.O., J.-H.L., B.W.E., and J.V. performed research and analyzed data; R.P.K., S.L.S., T.O., and J.-P.K. interpreted data; S.D. and H.Y. analyzed and interpreted data; M.J., H.K.J., Y.Z., T.H., and K.L.R. performed research; K.S.G., S.T., and Z.Y. analyzed data; M.E.K. contributed vital reagents; J.S., L.J., B.K.L., S.I.S., F.F., N.N.B., J.R.C., and S.M.A. contributed samples and clinical data; A.L.F. designed research, performed research, analyzed and interpreted data, and wrote the manuscript; and all authors approved the final manuscript.
Conflict-of-interest disclosure: The authors declare no competing financial interests.
The current affiliation for M.T.Z. is Medical College of Wisconsin, Milwaukee, WI.
The current affiliation for K.S.G. is Children’s Hospital of Philadelphia, Philadelphia, PA.
Correspondence: Andrew L. Feldman, Department of Laboratory Medicine and Pathology, Stabile Building, Room 2-44, Mayo Clinic, 200 First St SW, Rochester, MN 55905; e-mail: feldman.andrew@mayo.edu; and Rebecca A. Luchtel, Department of Laboratory Medicine and Pathology, Stabile Building, Room 6-56, Mayo Clinic, 200 First St SW, Rochester, MN 55905; e-mail: luchtel.rebecca@mayo.edu.

This feature is available to Subscribers Only
Sign In or Create an Account Close Modal