

Key Points
At least 24 weeks of EPAG administration in patients with rSAA may be required to determine responsiveness to drug.
EPAG may result in rapid emergence of abnormal metaphases but not expansion of clones with somatic mutations in myeloid candidate genes.

Abstract
Eltrombopag (EPAG) received approval from the US Food and Drug Administration for the treatment of refractory severe aplastic anemia (rSAA) based on treatment of 43 patients with doses escalating from 50 to 150 mg daily for 12 weeks. Response kinetics suggested that more prolonged administration of EPAG at a dose of 150 mg could speed and improve response rates. We enrolled 40 patients with rSAA in a study of EPAG 150 mg daily, with a primary end point of response at 24 weeks. Twenty (50%) of 40 patients responded at 24 weeks; 5 (25%) of 20 would have been deemed nonresponders at 12 weeks, the end point of the previous study. Fifteen of the 19 responding patients continuing on EPAG had drug discontinued for robust response; 5 of the 15 required EPAG re-initiation for relapse, with all recovering response. To analyze risk of clonal progression, we combined long-term data from the 83 patients with rSAA enrolled in both studies. Evolution to an abnormal karyotype occurred in 16 (19%), most within 6 months of EPAG initiation. Targeted deep sequencing/whole-exome sequencing was performed pre-EPAG and at primary response end point and/or time of clonal evolution or longest follow-up. Cytogenetic evolution did not correlate with mutational status, and overall mutated allele fractions of myeloid cancer genes did not increase on EPAG. In summary, extended administration of EPAG at a dose of 150 mg for 24 weeks rescued responses in some patients with rSAA not responding at 12 weeks. The temporal relationship between clonal evolution and drug exposure suggests that EPAG may promote expansion of dormant preexisting clones with an aberrant karyotype. The studies were registered at www.clinicaltrials.gov as #NCT00922883 and #NCT01891994.
Introduction
Immune-mediated destruction of hematopoietic stem and progenitor cells (HSPCs) is the principal mechanism responsible for severe aplastic anemia (SAA).1,2 Treatment with immunosuppressive therapy (IST) consisting of horse anti-thymocyte globulin and cyclosporine (ATG/CSA) results in responses in about two-thirds of patients.2,3 Patients with SAA refractory to IST and ineligible for transplantation had few therapeutic options before 2012, when we reported that 44% of such patients responded to the thrombopoietin mimetic eltrombopag (EPAG) with clinically relevant improvements in blood cell counts. The mechanism of hematopoietic recovery was presumed to be stimulation by EPAG of the HSPC pool, as the c-MPL receptor is expressed on HSPCs.4 We subsequently showed that the addition of EPAG to standard IST resulted in improved response rates in patients with treatment-naive SAA; blood cell count improvement was accompanied by increased numbers of phenotypic stem cells and progenitors.5 These prospective clinical trials and a recent practice-based survey6 suggest that EPAG can help regenerate the depleted HSPC compartment in SAA.
In the initial phase 1/2 study,4,7 each patient underwent dose escalation starting at 50 mg/d and increased biweekly by 25 mg, reaching a maximal dose of 150 mg at week 10. All but 1 patient reached 150 mg, with little evidence of dose-related toxicities. Response was assessed at 12 to 16 weeks, chosen arbitrarily as there was no previous experience in SAA. EPAG was stopped in nonresponders and continued in responding patients. We noted that most responders barely met response criteria at 12 to 16 weeks but continued to subsequently exhibit improved blood cell counts with continued EPAG. In addition, several nonresponders showed evidence of hematologic improvement at 16 weeks of treatment but did not meet response criteria. We hypothesized that to respond, some patients with refractory SAA (rSAA) may require more prolonged HSPC stimulation with EPAG.
Patients with SAA are at risk for “clonal evolution,” development of myelodysplastic syndromes (MDS), paroxysmal nocturnal hemoglobinuria (PNH), or acute myeloid leukemia (AML), with ∼15% clonal evolution to an abnormal karyotype or MDS/AML at 10 years after initial IST.8 Patients with rSAA seem to have a higher risk of clonal progression,9 although changes in the rSAA population over time due to improved treatment of infections and earlier and more frequent referral for allotransplantation due to advances in alternative donor approaches limit extrapolations from earlier data.
Typically, clonal evolution is characterized as acquisition of clonal cytogenetic abnormalities, with loss of all or part of the long arm of chromosome 7 (chr7) both the most frequent and the most prognostically-ominous abnormality.10,11 Clonal evolution risk has been associated with telomere length at diagnosis and accelerated telomere attrition after treatment.12,13 Sequencing of hematopoietic cells in patients with SAA at diagnosis has revealed acquired somatic mutations in myeloid candidate genes previously associated with MDS/AML in one-third and clonal hematopoiesis with mutations in other genes in almost one-half.14 A subset of mutated genes predicted better responses and survival and others worse outcomes but without a clear link to clonal progression. Studies have revealed expansion of clones with acquired somatic mutations, including in myeloid candidate genes, in population-based cohorts of humans without hematologic diseases, at an incidence increasing with age.15,16 A depleted stem cell pool, whether resulting from aging or, in the case of SAA, immune attack, may favor outgrowth of some somatically mutated HSPCs.17
Whether treatment with hematopoietic growth factors, especially granulocyte colony-stimulating factor (G-CSF), promotes clonal evolution in AA is unclear.9,18,19 Activation of signaling pathways related to HSPC proliferation and differentiation could hypothetically result in induction or selection of abnormal premalignant or malignant clones.20 Concern has been raised that EPAG, which directly activates primitive HSPC signaling pathways, might favor induction or selection of premalignant HSPCs. We previously reported that 19% of patients with rSAA treated with EPAG developed detectable bone marrow cytogenetic abnormalities with a median follow-up of >2 years.7 The impact of EPAG therapy on acquired somatic mutations has not been addressed in the context of uniformly treated SAA patients enrolled in clinical trials.
In the current study, we assessed response rates, long-term clinical outcomes, and evolution of cytogenetic abnormalities and acquired somatic mutations in 83 patients with rSAA, including those enrolled in the original trial treating with dose-escalated EPAG for 12 to 16 weeks and in the current trial administering EPAG at 150 mg daily for 24 weeks. These unique data should inform risk assessment, treatment decisions, and follow-up standards for patients receiving EPAG therapy for rSAA.
Methods
Study design
This article presents data from 2 investigator-initiated, phase 2 nonrandomized studies registered at www.clinicaltrials.gov (#NCT00922883, study 1; #NCT01891994, study 2) and approved by the National Heart, Lung, and Blood Institute (NHLBI) Institutional Review Board and monitored by a Data and Safety Monitoring Board. All patients or their legal guardians provided written informed consent. The authors had access to and analyzed all data. Clinical efficacy and safety results have previously been published for study 1.4,7 Study 2 was terminated early at the recommendation of the Institutional Review Board after enrollment of 40 of the planned 49 patients, due to the low probability of rejecting the null hypothesis and slowed accrual following the US Food and Drug Administration approval of EPAG for SAA in 2014. Protocol schematics for study 1 and study 2 are shown in supplemental Figure 1 (available on the Blood Web site).
Study 2 enrolled patients aged ≥2 years diagnosed with SAA21 and having failed at least one cycle of rabbit or horse ATG with CSA, with persistence of multilineage or unilineage cytopenias (platelet count <30 × 109/L or platelet transfusion dependence, absolute neutrophil count [ANC] <0.5 × 10⁹/L, and/or hemoglobin <9.0 g/dL or red blood cell transfusion dependence) for at least 6 months after initiation of ATG/CSA. Patients with Fanconi anemia, family history or other signs of inherited bone marrow failure syndromes, severe liver impairment, or abnormal bone marrow cytogenetics performed within 12 weeks of study entry were excluded. No patients aged <18 years eligible for transplant and with an available matched sibling donor were enrolled. EPAG was administered for 6 months at a dose of 150 mg daily in patients ≥12 years of age, 75 mg daily for patients 6 to 11 years of age, and 2.5 mg/kg per day for children 2 to 5 years of age, and reduced by one-half for patients of East or Southeast Asian ancestry.22 Responses were assessed after 3 and 6 months of treatment. Responding patients could continue on EPAG on an extension phase of the protocol until all criteria for robust response were fulfilled (platelet count >50 × 109/L, hemoglobin >10 g/dL, ANC >1 × 10⁹/L, and transfusion independence), or until counts stabilized without further improvement for >6 months. At that time, EPAG was discontinued, and counts were monitored for 3 years. EPAG could be reinitiated in the case of relapse during this time period. Bone marrow aspiration and biopsy with cytogenetics was performed at baseline, after 12 and 24 weeks of treatment, and then every 6 months in responding patients remaining on EPAG. Marrow morphology was assessed by a hematopathologist who was blinded to treatment and response status.
The primary end point for study 2 was the proportion of EPAG responders, as defined by improvements in one or more blood lineages meeting protocol inclusion criteria in that lineage (see earlier) after 24 weeks of treatment: (1) platelet count increase of ≥20 × 109/L above baseline, or stable platelet counts with transfusion independence for ≥8 consecutive weeks before response assessment in platelet transfusion–dependent patients; (2) hemoglobin increase of ≥1.5 g/dL, or for transfusion-dependent patients, a reduction in the units of packed red blood cells transfused by at least 50% during the 8 consecutive weeks before response assessment compared with the 8 weeks before study entry; and/or (3) ≥100% increase in ANC or an ANC increase of >0.5 × 10⁹/L. Secondary end points were responses as defined earlier at 12 weeks of treatment, relapse, frequency and paroxysmal nocturnal hemoglobinuria (PNH) clone size of glycosylphosphatidylinositol negative (GPIneg) neutrophils, incidence of abnormal marrow karyotypes, progression to MDS or acute leukemia, survival, and health-related quality of life.
The supplemental Methods provide details on targeted deep sequencing and whole-exome sequencing (WES).
Statistics
Results from study 2 were analyzed on an intention-to-treat basis to determine if 24 weeks of EPAG at a fixed dose of 150 mg improved response rates in patients with rSAA compared with our previous results treating with a dose-escalation regimen for 12 to 16 weeks.4,7 Based on the anticipated response rate of at least 44%, we tested the null hypothesis H0: p0 = 44% vs the alternative H1: p1 ≠ 44% at a 2-sided significance level of 0.05 and a power of 0.80. The goal was to detect a 20% improvement in response rate (p1-p0). The sample size of 49 evaluable patients to achieve the significance level and power was determined by using a 2-sided binomial test.5
Results
Clinical results and safety
Compared with patients entered into our previous clinical trial of EPAG for rSAA (study 1), patients in study 2 had received fewer prior immunosuppressive therapies, and fewer patients were receiving platelet transfusions at study entry (Table 1). Other demographic and clinical characteristics were similar. Median follow-up was 27.5 months (range, 3.0-46.7 months). No previously unknown adverse events possibly or probably related to EPAG occurred in study 2. Four patients experienced temporary grade 3 elevations in liver enzyme levels (supplemental Table 1). One patient (unique patient number 19 [UPN19]) with profound cytopenias and no interpretable bone marrow metaphases at study entry was diagnosed with AML at an outside hospital after 10 weeks of EPAG administration, and he died of sepsis during induction chemotherapy. Rare undifferentiated blasts were detectable in his baseline marrow upon reanalysis. No other patients died on study.
Patient characteristics at baseline
| Characteristic | Study 1 (N = 43*) | Study 2 (N = 40) | P |
|---|---|---|---|
| Age, y | |||
| Median | 45 | 50 | .399 |
| Range | 17-77 | 4-79 | |
| Age category, n (%) | |||
| <18 y | 2 (4.7) | 9 (22.5) | |
| 18-64 y | 27 (62.8) | 25 (62.5) | |
| ≥65 y | 14 (32.6) | 6 (15.0) | |
| Sex, n (%) | |||
| Female | 19 (44.2) | 19 (47.5) | .766 |
| Male | 24 (55.8) | 21 (52.5) | |
| Ethnicity, n (%) | |||
| Asian | 1 (2.3) | 5 (12.5) | |
| Black | 13 (30.2) | 4 (10.0) | |
| Hispanic | 9 (20.9) | 4 (10.0) | |
| White | 20 (46.5) | 27 (67.5) | |
| Other | 0 (0) | 0 (0) | |
| Previous treatments | |||
| No. of ISTs, average | 2.3 | 1.5 | <.001 |
| No. of ISTs, median (range) | 2 (1-4) | 1 (1-4) | |
| Time since last IST, median (range), mo | 9 (6-120) | 10 (6-68) | |
| Time since first IST, median (range), mo | 21 (7-189) | 13 (7-198) | |
| Laboratory parameters | |||
| Neutrophil count, ×109/L | |||
| Median | 0.57 | 0.70 | .202 |
| Range | 0.07-2.81 | 0.01-3.10 | |
| Reticulocyte count, ×109/L | |||
| Median | 24.0 | 32.3 | .224 |
| Range | 2.20-100.00 | 1.90-130.40 | |
| Platelet count, ×109/L | |||
| Median | 13.00 | 14.50 | .646 |
| Range | 5.00-65.00 | 2.00-53.00 | |
| Hemoglobin, g/dL | |||
| Median | 8.40 | 8.65 | .540 |
| Range | 6.00-13.30 | 5.90-12.40 | |
| Disease status, n (%)† | |||
| Severe AA | 36 (84) | 32 (80) | .778 |
| Super SAA | 6 (14) | 3 (9) | .485 |
| Transfusion dependency, n (%) | |||
| Platelets | 42 (98) | 30 (76.9) | .005 |
| Red cells | 40 (93) | 35 (89.7) | .703 |
Total number of patients enrolled 44. One patient withdrew from study before the first dose of EPAG.
Disease status based on blood cell count criteria at entry; those with a super severe ANC (<0.2 × 10⁹/L) also included in SAA category. Remainder of patients were qualified based on history of prior SAA and blood count/transfusion criteria as described in Methods.
Twenty (50%) of 40 study 2 patients achieved hematologic response at the 24-week primary end point (Figure 1). Pediatric (4 of 9) and adult (16 of 31) patients responded at similar rates. Although the response rate was higher in study 2 compared with study 1, the initial null hypothesis of at least a 20% increase in response compared with study 1 was rejected, and thus accrual was halted based on futility after enrollment of 40 evaluable patients. Five (25%) of 20 responding patients did not achieve response criteria at 12 weeks but did by 24 weeks (Figure 1; supplemental Table 2). Responses at 12 weeks were primarily unilineage (65%), whereas the majority of responses became bilineage (45%) or trilineage (35%) by 24 weeks (supplemental Figure 2). Therefore, the number of multilineage responses nearly doubled with an additional 3 months of EPAG treatment (41% vs 79%; P = .04). Although this comparison was not a study end point, ANC between baseline and 12 weeks was increased significantly in study 2 vs study 1 (supplemental Table 3). Absolute reticulocyte count (ARC) exhibited a similar trend, with a larger mean increase in ARC value at 12 weeks on study 2 than in study 1. In sum, these data support initial treatment at the full dose of 150 mg/d and continuation for at least 24 weeks as resulting in faster count improvement and salvage of patients between 12 and 24 weeks, compared with gradual dose escalation and discontinuation at 12 to 16 weeks in nonresponders.
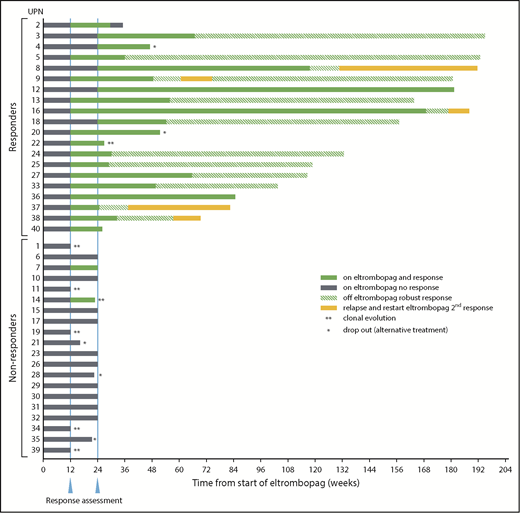
Response summary and timelines. Twenty of 40 patients on study 2 met primary response criteria at the defined end point of 24 weeks on EPAG (solid green bars after 24-week response assessment). Note that 5 patients achieved response only after the 12-week interim assessment (UPN3, UPN4, UPN8, UPN12, and UPN18; gray bars between first and second response assessments). UPN7 achieved response criteria at 12 weeks but not at the primary end point of 24 weeks. UPN14 reached response criteria at 12 weeks but was taken off study at that time point due to clonal evolution, and thus was a nonresponder at the primary end point of 24 weeks. Nineteen responders continued EPAG on the extension arm of the protocol. EPAG administration was stopped in 14 patients for robust response and one when blood cell counts appeared to reach a plateau (UPN16), with continuing response off EPAG designated by the green striped bars. The drug was restarted in 5 patients for declining blood cell counts off EPAG, and all responded a second time (UPN8, UPN9, UPN16, UPN37, and UPN38; solid yellow bars). *Off study for patient choice. **Off study for cytogenetic evolution.
Response summary and timelines. Twenty of 40 patients on study 2 met primary response criteria at the defined end point of 24 weeks on EPAG (solid green bars after 24-week response assessment). Note that 5 patients achieved response only after the 12-week interim assessment (UPN3, UPN4, UPN8, UPN12, and UPN18; gray bars between first and second response assessments). UPN7 achieved response criteria at 12 weeks but not at the primary end point of 24 weeks. UPN14 reached response criteria at 12 weeks but was taken off study at that time point due to clonal evolution, and thus was a nonresponder at the primary end point of 24 weeks. Nineteen responders continued EPAG on the extension arm of the protocol. EPAG administration was stopped in 14 patients for robust response and one when blood cell counts appeared to reach a plateau (UPN16), with continuing response off EPAG designated by the green striped bars. The drug was restarted in 5 patients for declining blood cell counts off EPAG, and all responded a second time (UPN8, UPN9, UPN16, UPN37, and UPN38; solid yellow bars). *Off study for patient choice. **Off study for cytogenetic evolution.
A PNH clone was considered present if GPIneg neutrophils exceeded 1% according to flow cytometry. At baseline, 8 of 40 patients had a PNH clone; 7 of the 8 were EPAG responders. PNH clone size increased by >20% in 4 of the 8 patients and plateaued or slightly increased in another 4 patients after 6 months of treatment (supplemental Figure 3). One patient without a detectable PNH clone at baseline had 1.2% PNH neutrophils at the 24-week primary end point. No other new PNH clones were detected on study, including in responding patients remaining on EPAG long term in the extension arm.
In contrast to study 1,7 in both univariate and multivariate analyses, ARC at study entry was not a predictor for response at 12 weeks in study 2 (supplemental Table 4). Similarly, ARC, ANC, age-adjusted telomere length, time from first and last IST, number of rounds of IST, or presence of >1% GPI-deficient neutrophils were not predictors for response at 24 weeks in study 2. In multivariate analysis of combined 12-week data from study 1 and study 2, patients with higher ARC, previously shown to be the single most predictive factor for response to initial IST,23 and shorter duration from first IST were more likely to respond to EPAG (ARC, P < .022; time from first IST to start EPAG, P < .009). These variables may reflect a higher residual HSPC pool.
Nineteen of 20 study 2 responders continued EPAG beyond 24 weeks (Figure 1); the exception was UPN22, who had EPAG stopped for cytogenetic evolution at 24 weeks. All responding patients were fully transfusion independent at the primary end point or soon thereafter. Nine patients eventually reached complete response criteria as defined in previous SAA trials (platelets >100 × 109/L, hemoglobin >10 g/dL, ANC >1 × 10⁹/L). Only 1 patient (UPN2) lost hematologic response during EPAG administration.
EPAG was discontinued in 13 (72%) of 18 responding patients upon reaching protocol-defined robust or stable trilineage response criteria (robust ANC >1 × 10⁹/L, hemoglobin >10 g/dL, and platelets >50 × 109/L for >8 weeks or stable counts with transfusion independence for >6 months) after a median time on drug of 11.6 months (range, 6.2-27.5 months) (supplemental Table 2). EPAG was restarted in 5 of 13 patients for falling blood cell counts a median of 172 days (range, 64-279 days) after EPAG discontinuation, and 5 of 5 achieved a second response. EPAG was successfully tapered a second time in 1 patient (UPN9), and robust blood cell counts have been maintained without drug for 3 years (Figure 1).
Clonal evolution and somatic mutations
Clonal evolution, defined as abnormalities on standard metaphase analysis of bone marrow or overt clinical transformation to MDS/AML, occurred in 18% of patients in study 2, comparable to our previous results with long-term follow-up of patients in study 1.7 All were adults. Combining study 1 and study 2, a total of 16 (18%) of 83 patients developed new cytogenetic abnormalities (n = 15) or overt MDS/AML without available cytogenetics (n = 1, UPN19 [as described earlier]) (Figure 2; supplemental Table 5). The karyotype at evolution in 7 patients involved complete or partial loss of chr7, and 6 of 7 patients were nonresponders to EPAG. Acquisition of monosomy 7 or 7q abnormalities have been specifically associated with poor outcome in SAA and MDS.11,24 Of note, all 7 patients in the current study had chr7 cytogenetic abnormalities detected early after EPAG initiation, in 6 cases at 12 weeks and in 1 case at 24 weeks. Four patients had repeat cytogenetics 1 month later, off EPAG, and all had persistent chr7 abnormalities. No responding patient on either study 1 or study 2 who remained on EPAG (n = 36) developed chr7 abnormalities at later time points.
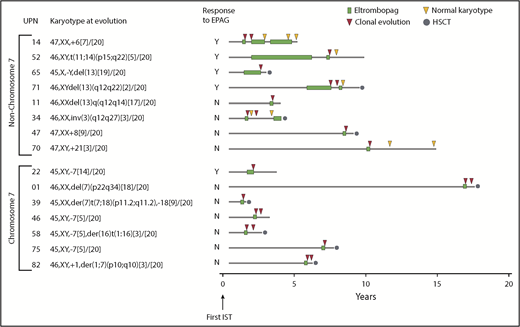
Clonal cytogenetic evolution. Results from all 83 patients treated with EPAG on both study 1 and study 2. Patients are grouped according to presence or absence of chr7 abnormalities. Timing of cytogenetic evolution is shown in relation to initial treatment with IST as well as EPAG treatment. Further details are given in supplemental Table 5. Cytogenetic evaluations after initial clonal progression were performed off-study and in some cases not at the study site. HSCT, hematopoietic stem cell transplantation.
Clonal cytogenetic evolution. Results from all 83 patients treated with EPAG on both study 1 and study 2. Patients are grouped according to presence or absence of chr7 abnormalities. Timing of cytogenetic evolution is shown in relation to initial treatment with IST as well as EPAG treatment. Further details are given in supplemental Table 5. Cytogenetic evaluations after initial clonal progression were performed off-study and in some cases not at the study site. HSCT, hematopoietic stem cell transplantation.
Nine patients, including 4 responders, developed non-chr7 abnormalities, which have correlated with better outcomes in SAA compared with chr7 abnormalities.11 In 6 patients, non-chr7 cytogenetic aberrations were detected in the week 12 bone marrow in 6 patients, and at later time points (range, 9-66 months) in the remaining 3 patients, in contrast to lack of later chr7 progression as discussed earlier. Of note, 5 of 9 cases had a subsequent normal marrow karyotype, 3 after EPAG was discontinued (UPN34, UPN52, and UPN70), and 2 despite continued EPAG treatment off protocol (UPN14 and UPN71) (Figure 2; supplemental Table 5). In 3 (UPN14, UPN34, and UPN71) of 5 patients, these normal karyotypes were confirmed on at least one additional marrow sample years later.
None of the patients with cytogenetic evolution transformed to leukemia, and dysplastic features sufficient to be diagnosed as MDS according to World Health Organization criteria were present in only 1 patient with cytogenetic progression (UPN22) (Figure 2; supplemental Table 5). However, because 9 patients eventually underwent allogeneic transplantation and 3 nonresponding patients died of sepsis, only 3 evolving patients (all non-chr7) are still being followed. Two patients who had undergone transplantation died of transplant-related complications. The remaining 7 transplanted patients are engrafted, and none has relapsed with AA/MDS or AML. In multivariate analysis, no baseline factors, including age, ARC, ANC, telomere length, time from first and last IST, number of ISTs, or presence of GPIneg neutrophils, predicted clonal evolution (supplemental Tables 6 and 7).
We analyzed the somatic mutation profile obtained by targeted deep sequencing of 63 “candidate” genes associated with myeloid malignancies25 and/or AA (supplemental Table 8),14 and also performed WES on a subset of patients to examine overall somatic mutation occurrence and clonality. Bone marrow mononuclear cells collected at baseline and at the primary end point of 12 weeks (study 1) or 24 weeks (study 2) were assessed for a total of 64 patients with samples available at both time points, including 12 patients sampled at the time of cytogenetic evolution. We set a variant allele frequency (VAF) threshold of >0.025 to define valid mutations for both WES and targeted sequencing, and a more conservative threshold of VAF >0.05 for somatic mutations in all other genes on WES. For a subset of samples (n = 15), both WES and targeted sequencing were performed, and there was very good correlation (r = 0.6) between the 2 approaches for the VAF of candidate genes, although targeted sequencing was more sensitive. Thus, for samples analyzed by using both methods, targeted sequencing results were used for further analyses of candidate gene mutations.
Candidate myeloid malignancy/AA gene mutations were detected at baseline in 29 of 64 patients; of these individuals,10 of 26 became responders, 14 of 26 were nonresponders, and 5 of 12 underwent clonal evolution (Figure 3; supplemental Table 8); there were no significant differences in the frequency of somatic mutations between groups (P > .1 for all comparisons). The overall prevalence of somatic candidate gene mutations in 45% of these patients in the current study is similar to that previously reported in patients with SAA at presentation.14 At the primary end point, new mutations were detected in 8 responding patients and 6 nonresponding patients. Conversely, in 8 responding and 9 nonresponding patients, candidate gene mutations present at baseline were no longer detectable at the primary end point, resulting in a prevalence of 45%, identical to baseline. The majority of appearing or disappearing mutations were present at VAFs near to the limit of detection.
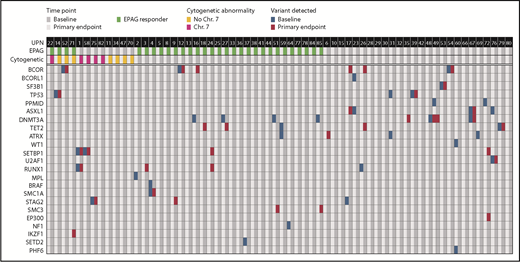
Acquired somatic mutations in myeloid cancer and AA-related genes in relation to EPAG treatment. Targeted deep sequencing and/or WES was performed on bone marrow cells from 64 patients. Detection of acquired variants in a panel of genes with somatic mutations associated with myeloid cancer or AA are shown. Each row indicates a specific MC/AA gene and each column a patient, with results shown for baseline and primary end point (3 months for study 1, 6 months for study 2). The panel of MC/AA genes is given in the supplemental Methods, and the mutations detected are listed in supplemental Table 8.
Acquired somatic mutations in myeloid cancer and AA-related genes in relation to EPAG treatment. Targeted deep sequencing and/or WES was performed on bone marrow cells from 64 patients. Detection of acquired variants in a panel of genes with somatic mutations associated with myeloid cancer or AA are shown. Each row indicates a specific MC/AA gene and each column a patient, with results shown for baseline and primary end point (3 months for study 1, 6 months for study 2). The panel of MC/AA genes is given in the supplemental Methods, and the mutations detected are listed in supplemental Table 8.
The size of clonal contributions from HSPCS with candidate gene mutations did not change significantly between baseline and primary end point when all 64 patients were analyzed together, or when responders, nonresponders, or cytogenetic evolvers were analyzed separately (Figure 4). However, a marked increase in VAF for deleterious variants in both SETBP1 and RUNX1 did occur in UPN1, coincident with detection of deletion 7q in 18 of 20 metaphases (Figure 5A). Otherwise, cytogenetic evolution was not coincident with an increase in VAF of mutations. For instance, UPN58 and UPN75 had no increases in VAF for clones with infrequent mutations in ASXL1 and STAG2, respectively, despite new chr7 cytogenetic abnormalities in 16 of 20 and 5 of 20 metaphases, suggesting that the mutations were likely not present in the cytogenetically abnormal clones (supplemental Table 8). New mutations in SETBP1 and RUNX1 were detected at the time of response in UPN24 in the absence of cytogenetic evolution, and this patient has maintained excellent blood cell counts and normal marrow morphology now for 2 years after EPAG discontinuation for a robust response (Figures 1 and 5B). Three patients had a total of 4 TP53 mutations detected: UPN14 had disappearance of 1 mutation and appearance of another, UPN31 had disappearance of the TP53 mutation, and UPN39 showed stable mutation levels. None exhibited dysplasia at the primary end point. UPN14 had transient trisomy 6, remained on EPAG off-protocol, and 4 years later continues with excellent blood cell counts and normal marrow morphology. UPN31, a nonresponder with normal cytogenetics, proceeded to transplantation 6 months later, as did UPN39, with a chr7 abnormality detected at the primary end point. Neither developed dysplasia pretransplant or relapsed posttransplant.

Impact of EPAG treatment on candidate gene mutations. The percentage of variant alleles is shown on the y-axis at baseline and the primary end point (3 months for study 1, 6 months for study 2) for mutations detected in 63 candidate genes in all analyzed patients (n = 64; A), responding patients (n = 26; B), cytogenetic evolvers (n = 12; C), and nonresponding patients (n = 26; D). P values for paired Student t tests comparing baseline and end point are shown.
Impact of EPAG treatment on candidate gene mutations. The percentage of variant alleles is shown on the y-axis at baseline and the primary end point (3 months for study 1, 6 months for study 2) for mutations detected in 63 candidate genes in all analyzed patients (n = 64; A), responding patients (n = 26; B), cytogenetic evolvers (n = 12; C), and nonresponding patients (n = 26; D). P values for paired Student t tests comparing baseline and end point are shown.
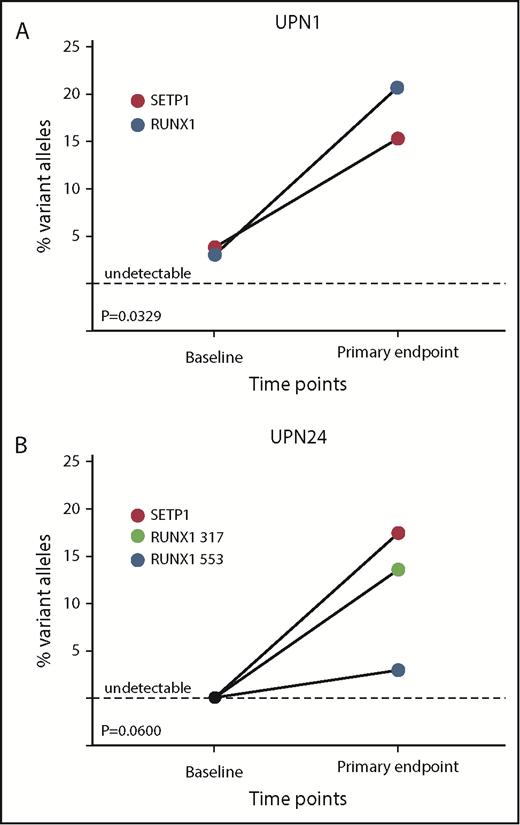
Individual patient-mutated clone size in response to EPAG. (A) UPN1, a 30-year-old woman diagnosed 8 years before EPAG treatment and failing multiple IST cycles, had mutations in SETBP1 and RUNX1 detected at baseline before EPAG. At the time of detection of monosomy 7 at 3 months, the percentage of variant alleles for both genes increased concurrently with the monosomy 7 clone, suggesting the transformed monosomy 7 clone also harbored the abnormal genetic variants. (B) UPN24, an 8-year-old boy with super SAA, responded to EPAG and remained stable. Analysis at baseline did not detect mutations, but at the primary end point of 6 months, 2 RUNX1 mutations and 1 SETBP1 mutation were detected. Bone marrow morphology and karyotype have remained normal for >3 years, including after EPAG was discontinued for a robust response.
Individual patient-mutated clone size in response to EPAG. (A) UPN1, a 30-year-old woman diagnosed 8 years before EPAG treatment and failing multiple IST cycles, had mutations in SETBP1 and RUNX1 detected at baseline before EPAG. At the time of detection of monosomy 7 at 3 months, the percentage of variant alleles for both genes increased concurrently with the monosomy 7 clone, suggesting the transformed monosomy 7 clone also harbored the abnormal genetic variants. (B) UPN24, an 8-year-old boy with super SAA, responded to EPAG and remained stable. Analysis at baseline did not detect mutations, but at the primary end point of 6 months, 2 RUNX1 mutations and 1 SETBP1 mutation were detected. Bone marrow morphology and karyotype have remained normal for >3 years, including after EPAG was discontinued for a robust response.
We also performed longitudinal analysis of candidate gene mutations in 12 responding patients at the longest time point on continuous EPAG (median, 15 months; range, 12-54 months) and at the longest time point after discontinuation of EPAG in robust responders (median, 41 months; range, 12-92 months). There was no relationship between mutation detection and EPAG treatment, and no consistent expansion of clones over time (Figure 6; supplemental Table 8).
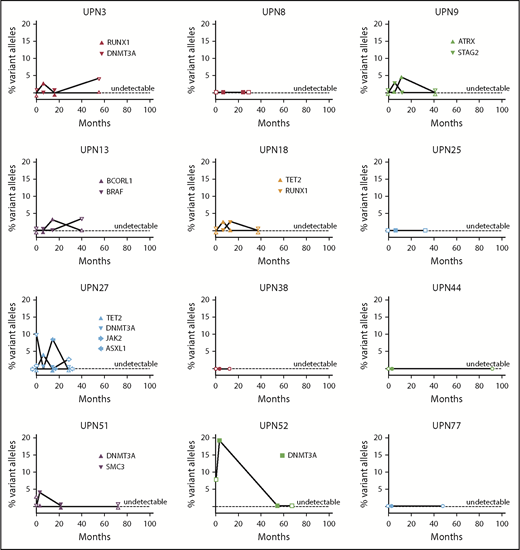
Longitudinal follow-up of mutated clone size in responding patients on and off EPAG. Candidate gene mutations were analyzed at baseline, primary end point, the longest time point on continuous EPAG, and the longest time point after EPAG was discontinued for robust response in 12 responding patients. Each panel shows the results in a single patient, with mutated clone size off EPAG (at baseline and at longest follow-up time point off EPAG after robust response) designated by open symbols, and clone size on EPAG (at primary end point and at longest follow-up on EPAG) designated by closed symbols. Specific mutations are listed in supplemental Table 8.
Longitudinal follow-up of mutated clone size in responding patients on and off EPAG. Candidate gene mutations were analyzed at baseline, primary end point, the longest time point on continuous EPAG, and the longest time point after EPAG was discontinued for robust response in 12 responding patients. Each panel shows the results in a single patient, with mutated clone size off EPAG (at baseline and at longest follow-up time point off EPAG after robust response) designated by open symbols, and clone size on EPAG (at primary end point and at longest follow-up on EPAG) designated by closed symbols. Specific mutations are listed in supplemental Table 8.
For 21 responding patients and 12 cytogenetic evolvers, WES was analyzed for the presence of somatic coding gene single nucleotide variants and/or indels to assess more generally for the clonality of hematopoiesis. By this measure, clonal hematopoiesis was present in most patients at baseline (supplemental Figures 4 and 5), consistent with our previous data.14 On the assumption that single nucleotide variants and indels were surrogates for the number of contributing HSPC clones, it is of interest that we detected no overall significant change in clonality comparing evolver vs nonevolver and baseline vs post-EPAG samples.
Discussion
This prospective phase 2 study confirms the activity of EPAG in improving blood cell counts in patients with rSAA and promoting recovery of HSPCs. In our initial trial, a time point for response was chosen without previous clinical experience of EPAG in rSAA. In the current report, one-quarter of responders benefited from continuing treatment of at least 6 months, as they improved hematologically between 3 and 6 months on drug. At least a 6-month trial of EPAG is therefore recommended for patients with rSAA before discontinuation for nonresponse. The lack of dose escalation and the more prolonged duration of EPAG administration in study 2 compared with study 1 did not affect EPAG’s favorable toxicity profile.4,7 After achieving a sustained robust clinical response, EPAG was able to be discontinued in more than three-quarters of patients; the majority maintained stable blood cell counts off-drug long term, and those with a decline in blood cell counts all regained responses when EPAG was restarted. A recent French nationwide survey of EPAG use and response in patients with AA treated off-protocol also reported stability of response after discontinuation of EPAG in some patients.6
Clonal evolution and progression to MDS/AML are major concerns in rSAA.11 Cytokine stimulation of HSPC self-renewal and proliferation could potentially increase the risk of clonal evolution and consequent malignant transformation. The rate of clonal evolution after EPAG treatment in study 2 was comparable to that reported previously in study 1.7 Considering all 83 patients with rSAA treated on the 2 consecutive EPAG studies, we note that clonal evolution is almost always an early event: 13 (87%) of 15 occurred within 6 months of EPAG initiation, including all with chr7 abnormalities. The striking kinetics of these events in relation to EPAG treatment suggests a direct link.26,27 Later clonal evolution was less frequent, whether patients required continued EPAG or were taken off drug for robust response; however, follow-up remains relatively short, particularly given the previously reported many-year window of risk for clonal evolution in SAA.8 Although overt dysplastic changes or leukemia accompanied cytogenetic progression in only 1 patient, patient numbers were small, and allogeneic transplantation or death from cytopenias in nonresponding patients precluded further investigation of progression to MDS/AML in the majority. Chromosomal aberrations involving the complete or partial loss (long arm) of chr7 have been linked to refractory disease and poor prognosis in SAA8,11 ; however, the clinical significance of other abnormal karyotypes is less clear. Although the observed frequency of clonal progression is concerningly high, the literature provides very little relevant information on the expected incidence specifically in patients with rSAA (as detailed in the Introduction).
The rapid appearance of chr7 abnormalities in particular suggests that abnormal HSPCs present at baseline but not detected by conventional cytogenetics may be preferentially stimulated by EPAG to proliferate. One potential explanation is that the loss of sterile α-domain 9 (SAMD9) and sterile α-domain 9–like (SAMD9L) genes located at chr7q21.3 confers hypersensitivity to EPAG. In mice, heterozygous loss of these genes resulted in hypersensitivity to thrombopoietin, stem cell factor, and G-CSF. SAMD9L-deficient hematopoietic cells were shown to be defective in homotypic endosome fusion, resulting in delayed processing of ligand-bound cytokine receptors and hyperactive cytokine signaling.28 Hypersensitivity of chr7-deleted vs normal HSPCs to MPL signaling would explain the rapid detection of such clones in patients after initiating EPAG. chr7-deleted clones frequently develop in several congenital acquired and congenital disorders characterized by loss of HSPCs, suggesting that these clones do not have an advantage in the setting of normal HSPC numbers but emerge in the setting of HSPC deficiency.10 It is also possible that the proliferative pressure exerted by EPAG when limited numbers of HSPC attempt to support blood cell counts could result in genomic instability through accelerated telomere attrition, leading to the rapid emergence of cytogenetically abnormal clones.
The incidence of clonal evolution in treatment-naive patients with SAA receiving combination therapy with horse ATG/CSA/EPAG was comparable to historical cohorts treated with IST alone.8 EPAG monotherapy has not been associated with an increase in disease progression in patients with MDS/AML; however, follow-up in these studies was very short.29-31 Concerningly, a recent large study comparing azacytidine with or without EPAG for patients with intermediate- or high-risk MDS was terminated prematurely due to a lower response rate in the EPAG arm, in addition to a trend toward a higher rate of progression to AML.32 Characteristics of clonal progression in patients with rSAA and severely reduced persistent HSPC reserve may not apply to EPAG treatment in other clinical settings.
Malignant transformation is believed to be an evolutionary process whereby an initiating genetic event leads to clonal selection, followed by acquisition of additional genetic or epigenetic aberrations eventually resulting in malignant transformation. Recent high-throughput sequencing studies identified a set of genes commonly mutated in MDS and AML.33-36 Some of these mutations have been detected commonly in aged individuals without evidence of progression to myeloid malignancies.17,25 More than 40% of patients had myeloid malignancy candidate gene mutations in the pre-EPAG samples, at a similar incidence in EPAG responders, nonresponders, and cytogenetic evolvers. Although the patient population in this study was heavily pretreated and had experienced significant pancytopenia for years, the incidence of candidate gene mutations was similar compared with our report on mutations at diagnosis of SAA.14 Only 1 patient (UPN1, with mutations in RUNX1 and SETBP1) had a coincident increase in VAF of these mutations accompanying cytogenetic evolution, suggesting that genetic and chromosomal changes occurred in the same clone. In all other cytogenetic evolvers, the VAF for candidate gene–mutated clones pre- and post-EPAG did not match the appearance or fraction of cytogenetic abnormalities. Twelve responding patients remaining on EPAG for 12 to 54 months experienced no expansion of mutated clones. Our data further support previous findings in SAA that the presence of myeloid candidate gene mutations is insufficient for malignant transformation and only weakly predictive of clonal evolution.37
Conclusions regarding the impact of EPAG on the overall risk of cytogenetic progression, clonal evolution, and/or clinical progression to MDS/AML in patients with SAA require much longer follow-up and larger patient numbers. The ongoing randomized controlled trial assessing the impact of EPAG when added to standard IST for treatment-naive patients with SAA should provide relevant information in directly comparable groups; however, our data showing rapid cytogenetic evolution after initiation of EPAG in a subset of patients with rSAA is concerning. All patients on EPAG, particularly soon after drug initiation, should be followed up carefully, with marrow examinations and cytogenetics every 6 months. Patients should be monitored for clonal progression long term, even after discontinuation of EPAG. Providers and patients should carefully weigh the potential risks and benefits of EPAG therapy compared with other options such as allogeneic transplantation or additional IST.
De-identified individual patient data can be obtained by contacting the corresponding author (dunbarc@nhlbi.nih.gov).
The online version of this article contains a data supplement.
The publication costs of this article were defrayed in part by page charge payment. Therefore, and solely to indicate this fact, this article is hereby marked “advertisement” in accordance with 18 USC section 1734.
Acknowledgments
The authors thank the National Institutes of Health Intramural Sequencing Center, the NHLBI DNA Sequencing and Genomics Core Facility, NHLBI clinical protocol support personnel, and all National Institutes of Health physicians, nurses, and other patient care providers involved in the care of these patients, particularly Kinneret Broder, Marlene Peters Lawrence, Olga Rios, and Ma Evette Barranta.
This research was funded by the Intramural Research Program of the NHLBI.
Authorship
Contribution: T.W., R.D., J.C., X.F., N.S.Y., and C.E.D. designed studies; T.W., X.F., J.C., P.S., and M.D. performed laboratory studies and clinical analyses; T.W., R.D., D.J.Y., D.M.T., S.G., J.V., J.L., A.L., N.S.Y., and C.E.D. provided clinical care; K.R.C. provided pathologic interpretations; R.N.S., X.F., and C.W. performed statistical analyses; and T.W., J.C., X.F., N.S.Y., and C.E.D. wrote and edited the manuscript.
Conflict-of interest disclosure: EPAG was provided by GlaxoSmithKline and Novartis under a Clinical Trials Agreement with NHLBI. N.S.Y. and C.E.D. receive research funding from Novartis for additional studies. The remaining authors declare no competing financial interests.
Correspondence: Cynthia E. Dunbar, NHLBI, NIH, Building 10-CRC, Room 4E-5132, 10 Center Dr, Bethesda, MD 20892; e-mail: dunbarc@nhlbi.nih.gov; or Neal S. Young, NHLBI, NIH, Building 10-CRC, Room 3E-5140, 10 Center Dr, Bethesda, MD 20892; e-mail: youngns@nhlbi.nih.gov.

This feature is available to Subscribers Only
Sign In or Create an Account Close Modal