

TO THE EDITOR:
Increased fetal hemoglobin (HbF) leads to diminished severity of sickle cell disease (SCD), as HbF disrupts deoxygenated sickle hemoglobin polymerization.1 Many efforts have been made to identify an effective way to increase HbF in adults that include using chemical inducers,2 repressing silencers of the HbF genes,3-8 and manipulating nuclear receptors.9-11 Hydroxyurea (HU) is approved for clinical use. However, because of the heterogeneity of response, more effective HbF therapeutics are needed.
We previously found that inhibition of lysine-specific histone demethylase 1 (LSD1) using RNA interference or by application of the monoamine oxidase inhibitor tranylcypromine (TC) in primary human erythroid progenitor CD34+ cell cultures induced HbF to levels that should be efficacious in treating SCD.12 Subsequently, we found that LSD1 inhibitor RN-1 treatment of SCD mice resulted in increased γ-globin induction and HbF synthesis and led to improvement of many aspects of disease pathology.13,14 RN-1 also recapitulated the fetal pattern of hemoglobin induction in baboons (Papio anubis).15
Here, we evaluated the effects of multiple commercially available small molecule chemical inhibitors of LSD1 on HbF synthesis and erythroid physiology in SCD mice, in human primary erythroid progenitor CD34+ cells, and in induced pluripotent stem cells (iPSC) derived from SCD patients. Two of these agents, GSK-LSD1 and OG-L002, increased the percentage of F cells after 4 weeks of treatment in SCD mice, which was accompanied by a reduction of both sickled red blood cells (RBCs) and reticulocytes. These effects were mirrored by in vitro studies of CD34+ cells or erythroid progeny of sickle iPSCs. These findings suggest that LSD1 is a potentially useful molecular target for therapeutic intervention in treating SCD.
SCD mice (hα/hα::βS/βS, Townes model) experiments were approved by Boston University's Institutional Animal Care and Use Committee. Human CD34+ cells and sickle iPSC-derived erythroblasts were cultured and treated with different concentrations of LSD1 inhibitors (supplemental Methods, available on the Blood Web site).
Following intraperitoneal injection with chemical inhibitors of LSD1 for 4 consecutive weeks (supplemental Table 1), the percent of F cells was enumerated. In control animals treated with vehicle only (dimethyl sulfoxide [DMSO]), F cells comprised ∼2.5% of total erythrocytes; animals treated with LSD1-C12, LSD1-C76, or S2101 were similar to controls, and mice exposed to GSK-LSD1 or OG-L002 had 8% and 6% F cells, respectively (P < .05) (Figure 1A). Furthermore, in GSK-LSD1– or OG-L002–treated animals, γ-globin messenger RNA (mRNA) expression was induced up to 6.3- or 4.4-fold, and total HbF% was enhanced from 0.2% (control animals) to either 0.53% or 0.37%, whereas β-globin mRNA expression was insignificantly altered (supplemental Figure 1).

In vivo effects of LSD1 inhibition in SCD mice. (A) SCD mice were treated with GSK-LSD1, OG-L002, or LSD1-C12 at a concentration of 1 μg/g body weight per day, or LSD1-C76 (0.5 μg/g body weight per day), or S2101 (5 μg/g body weight per day) for 4 weeks. DMSO was injected as a negative control. Whole blood from SCD mice was stained with anti-human HbF antibody. Statistical analysis of the percentage of HbF-high cells (F cells) by flow cytometry averaged over all samples. Statistically significant differences between small chemical inhibitor-treated and control DMSO-treated SCD mice are indicated (*P < .05). Bar graph data are presented as the mean ± standard deviation, n = 3 mice per group. (B) The percentage of reticulocytes was measured by flow cytometry after thiazole orange staining of whole blood. The number shown above the horizontal bar in each box represents the mean fractional percentage of reticulocytes among the total cells in each group, n = 3 mice per group. (*P < .05 vs control DMSO-treated SCD mice). (C) Peripheral blood cells were stained with anti-mouse CD71 and Ter119 antibodies to assess the erythroid differentiation profiles of RBCs in chemical inhibitor–treated or control DMSO-treated SCD mice.23 Stained cells were sorted into 3 stages (I, immature; II, maturing; III, mature). The numbers in each rectangle represent the mean fractional percentages of cells at that developmental stage in each group, n = 3 mice per group. (D) Wright-Giemsa staining (oxidized eosin Y, methylene blue, and azure B; original magnification ×40) of peripheral blood smears of SCD mice after 4 weeks of treatment.
In vivo effects of LSD1 inhibition in SCD mice. (A) SCD mice were treated with GSK-LSD1, OG-L002, or LSD1-C12 at a concentration of 1 μg/g body weight per day, or LSD1-C76 (0.5 μg/g body weight per day), or S2101 (5 μg/g body weight per day) for 4 weeks. DMSO was injected as a negative control. Whole blood from SCD mice was stained with anti-human HbF antibody. Statistical analysis of the percentage of HbF-high cells (F cells) by flow cytometry averaged over all samples. Statistically significant differences between small chemical inhibitor-treated and control DMSO-treated SCD mice are indicated (*P < .05). Bar graph data are presented as the mean ± standard deviation, n = 3 mice per group. (B) The percentage of reticulocytes was measured by flow cytometry after thiazole orange staining of whole blood. The number shown above the horizontal bar in each box represents the mean fractional percentage of reticulocytes among the total cells in each group, n = 3 mice per group. (*P < .05 vs control DMSO-treated SCD mice). (C) Peripheral blood cells were stained with anti-mouse CD71 and Ter119 antibodies to assess the erythroid differentiation profiles of RBCs in chemical inhibitor–treated or control DMSO-treated SCD mice.23 Stained cells were sorted into 3 stages (I, immature; II, maturing; III, mature). The numbers in each rectangle represent the mean fractional percentages of cells at that developmental stage in each group, n = 3 mice per group. (D) Wright-Giemsa staining (oxidized eosin Y, methylene blue, and azure B; original magnification ×40) of peripheral blood smears of SCD mice after 4 weeks of treatment.
We next determined whether the increase in F cells associated with GSK-LSD1 and OG-L002 administration altered the abnormal hematology of SCD mice. Reticulocytes were quantified by flow cytometric analyses of thiazole orange–stained peripheral blood. Control animals had >50% reticulocytes, reflecting hemolytic anemia; reticulocytes in LSD1-C12–, LSD1-C76–, and S2101-treated animals were similar to controls; GSK-LSD1– or OG-L002–treated animals had 13% or 22% reticulocytes, respectively (Figure 1B). Complete blood counts showed that both RBC numbers and hematocrits increased in GSK-LSD1– and OG-L002–treated animals, suggesting that decreased reticulocyte count was a consequence of an improvement in anemia (supplemental Table 2).
We next examined the effects of these LSD1 inhibitors on erythroid differentiation by flow cytometric analyses of whole blood cells stained with antibodies against transferrin receptor (CD71) and the erythroid-specific marker, Ter119. Compared with control DMSO-treated SCD mice, the number of mature erythroid cells (CD71−Ter119+) increased from ∼24.3% to 33% in DMSO and LSD1-C12–, LSD1-C76–, and S2101-treated animals to 66% and 54% in animals exposed to GSK-LSD1 or OG-L002, respectively (Figure 1C). Cell morphology was examined by Wright Giemsa staining, and the number of sickled RBCs was apparently reduced in SCD mice treated with GSK-LSD1 or OG-L002 (Figure 1D). RBC distribution width from complete blood count results was significantly reduced after GSK-LSD1 or OG-L002 treatment, suggesting that the size of circulating RBCs was more uniform in treated animals (supplemental Table 2).
To study the HbF inductive effect of GSK-LSD1 and OG-L002 in human erythroid cells, we isolated and cultured CD34+ cells from the peripheral blood of normal donors. Following culture in expansion and differentiation media, cells were treated for 5 days with GSK-LSD1 or OG-L002 along with controls (phosphate-buffered saline [PBS], DMSO, HU, TC, or RN-1). The percentage of F cells significantly increased to 47.2% at 0.05 µM and 57.1% at 0.1 µM OG-L002 as well as to 56.5% at 0.0015 µM and 42.6% at 0.003 µM GSK-LSD1 (Figure 2A-B). The HbF inductive effect of OG-L002 and GSK-LSD1 was superior to that of 50 µM HU (39.3%) and comparable to the LSD1 inhibitors TC (49.3% at 2 µM, 55.3% at 4 µM) or RN-1 (36.1% at 0.05 µM, 30.1% at 0.1 µM). The mean fluorescence intensity of F cells in OG-L002– or GSK-LSD1–treated samples was higher than in controls, suggesting that their treatment not only increased the number of F cells but also increased the concentration of HbF in F cells (Figure 2C-D). Consistent with the increase in F-cell numbers, γ-globin mRNA expression was significantly induced, whereas β-globin changed only slightly in OG-L002– or GSK-LSD1–treated cells (supplemental Figure 2). Prolonged treatment of 9 days at the tested concentrations of OG-L002 and GSK-LSD1 did not alter cell viability (supplemental Figure 3).
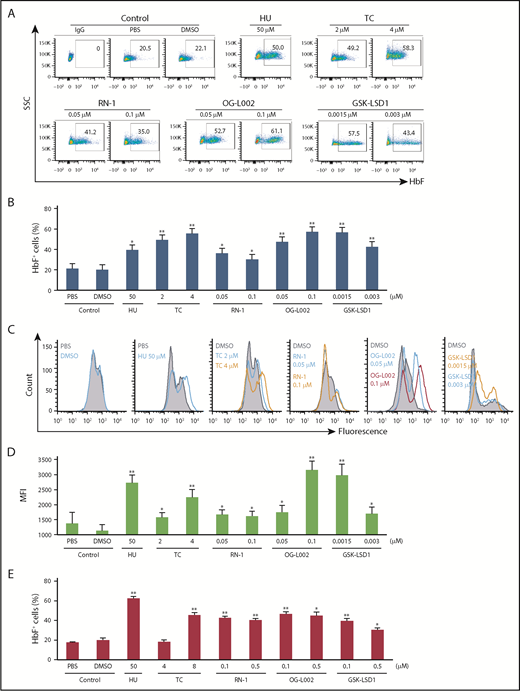
LSD1 inhibitors increase HbF in primary human erythroid progenitor CD34+cells and in sickle iPSC-derived erythroblasts (SS24 cells). (A) Representative flow cytometry plots of HbF-stained cultured CD34+ cells treated with LSD1 inhibitors. After 7 days of expansion and 3 days in differentiation phase, cells were treated with 0.05 and 0.1 μM OG-L002 or 0.02 and 0.1 μM GSK-LSD1 along with controls (50 μM HU, 2 and 4 μM TC, 0.05 and 0.1 μM RN-1, PBS, or DMSO) for a further 5 days in differentiation culture. (B) CD34+ cells flow cytometry data shown as bar graphs. Representative histograms showed the fluorescence (C), and mean fluorescence intensity (D), of the treated CD34+ cells compared with controls. (E) SS24 cells were recovered in expansion media for 3 days and then treated with 0.1 and 0.5 μM OG-L002 or 0.1 and 0.5 μM GSK-LSD1 along with controls (50 μM HU, 4 and 8 μM TC, 0.1 and 0.5 μM RN-1, PBS, or DMSO) for 3 additional days in expansion media. Flow cytometry data of HbF-stained cultured cells treated with drugs or controls shown as bar graphs. (All data represent the average of 3 independent biological replicates. All statistical analyses were calculated using an unpaired 2-tailed Student t test. *P < .005 and **P < .0005.)
LSD1 inhibitors increase HbF in primary human erythroid progenitor CD34+cells and in sickle iPSC-derived erythroblasts (SS24 cells). (A) Representative flow cytometry plots of HbF-stained cultured CD34+ cells treated with LSD1 inhibitors. After 7 days of expansion and 3 days in differentiation phase, cells were treated with 0.05 and 0.1 μM OG-L002 or 0.02 and 0.1 μM GSK-LSD1 along with controls (50 μM HU, 2 and 4 μM TC, 0.05 and 0.1 μM RN-1, PBS, or DMSO) for a further 5 days in differentiation culture. (B) CD34+ cells flow cytometry data shown as bar graphs. Representative histograms showed the fluorescence (C), and mean fluorescence intensity (D), of the treated CD34+ cells compared with controls. (E) SS24 cells were recovered in expansion media for 3 days and then treated with 0.1 and 0.5 μM OG-L002 or 0.1 and 0.5 μM GSK-LSD1 along with controls (50 μM HU, 4 and 8 μM TC, 0.1 and 0.5 μM RN-1, PBS, or DMSO) for 3 additional days in expansion media. Flow cytometry data of HbF-stained cultured cells treated with drugs or controls shown as bar graphs. (All data represent the average of 3 independent biological replicates. All statistical analyses were calculated using an unpaired 2-tailed Student t test. *P < .005 and **P < .0005.)
Finally, the effects of GSK-LSD1 and OG-L002 were examined in iPSC-derived erythroblasts (SS24) from a patient with sickle cell anemia.16 With our optimized differentiation protocol,17 differentiated SS24 cells contain <20% F cells, which is similar to that observed in in vitro differentiated CD34+ cells (which have 10% to 20% more F cells than observed in vivo). SS24 cells exhibited a robust increase in the number of F cells (Figure 2E) and HbF levels (supplemental Figure 4) following 3 days of exposure to the LSD1 inhibitors OG-L002, GSK-LSD1, TC, and RN-1 and to HU when compared with PBS- or DMSO-treated cells. The effective response of SS24 cells may represent a significant advance that could be useful in the evaluation of different HbF-inducing strategies.
Recently, a successful phase 1 clinical trial targeting DNMT1 inhibition was published,18 and another trial targeting BCL11A in autologous CD34+ cells from SCD patients has been initiated (www.clinicaltrials.gov, #NCT03282656). However, the difficulties of therapeutically targeting transcription factors and the lack of small molecule chemical inhibitors that inactivate HBG DNA binding repressors have to date resulted in only very few lead HbF inducers with the potential for widespread use.
The development of pharmacological inhibitors of LSD1 has been focused on its unusually abundant expression in many human malignancies.19-21 TC was the first Food and Drug Administration–approved drug reported to inhibit LSD1.22 Inhibition of LSD1 by TC or its derivative RN-1 promoted HbF synthesis in human primary CD34+ cells, SCD mice, and baboons, indicating the potential therapeutic value of targeting this pathway.12-15
Inhibitors with lower LSD1 half inhibitory concentration and structures similar to RN-1 were chosen for additional study in SCD mice. Two compounds, OG-L002 and GSK-LSD1, increased HbF and improved anemia (Figure 1). OG-L002 and GSK-LSD1 also showed similar efficacy in inducing HbF in human primary CD34+ cells and sickle iPSC-derived erythroblasts (Figure 2), whereas other inactive compound did not (supplemental Figures 5 and 6). Those findings provide substantial evidence to support the concept that LSD1 may comprise a useful molecular target for possible therapeutic intervention in treating SCD.
The online version of this article contains a data supplement.
Acknowledgments
The authors are grateful to their colleagues for many insightful comments on the manuscript.
This work was supported by an American Heart Association Scientist Development grant 13SDG16950062 and American Society of Hematology Scholar Awards (S.C.), and by National Institutes of Health, National Heart, Lung, and Blood Institute research grants R01HL24415 (J.D.E.), U01HL117658 (J.D.E.), U01HL107443 (M.H.S., D.H.K.C., and G.J.M.), and R01HL133350-01A1 (G.J.M. and M.H.S.).
Authorship
Contribution: C.Q.L. and S.C. designed, performed, and analyzed experiments and wrote the paper; G.M., N.J., and A.H. performed experiments; and G.J.M., D.H.K.C., M.H.S., and J.D.E. analyzed experiments and wrote the paper.
Conflict-of-interest disclosure: The authors declare no competing financial interests.
Correspondence: Shuaiying Cui, Boston University School of Medicine, 650 Albany St, Room 426A, Boston, MA 02118; e-mail: shuaiyin@bu.edu.

This feature is available to Subscribers Only
Sign In or Create an Account Close Modal