

Key Points
PHF6 is a tumor suppressor, and loss of PHF6 synergizes with ectopic TLX3 expression to cause rapid-onset fully penetrant leukemia.
Loss of PHF6 leads to sustained and robust HSC reconstitution beyond quaternary transplants and promotes progenitor production.

Abstract
Somatically acquired mutations in PHF6 (plant homeodomain finger 6) frequently occur in hematopoietic malignancies and often coincide with ectopic expression of TLX3. However, there is no functional evidence to demonstrate whether these mutations contribute to tumorigenesis. Similarly, the role of PHF6 in hematopoiesis is unknown. We report here that Phf6 deletion in mice resulted in a reduced number of hematopoietic stem cells (HSCs), an increased number of hematopoietic progenitor cells, and an increased proportion of cycling stem and progenitor cells. Loss of PHF6 caused increased and sustained hematopoietic reconstitution in serial transplantation experiments. Interferon-stimulated gene expression was upregulated in the absence of PHF6 in hematopoietic stem and progenitor cells. The numbers of hematopoietic progenitor cells and cycling hematopoietic stem and progenitor cells were restored to normal by combined loss of PHF6 and the interferon α and β receptor subunit 1. Ectopic expression of TLX3 alone caused partially penetrant leukemia. TLX3 expression and loss of PHF6 combined caused fully penetrant early-onset leukemia. Our data suggest that PHF6 is a hematopoietic tumor suppressor and is important for fine-tuning hematopoietic stem and progenitor cell homeostasis.
Introduction
The X-linked PHF6 (plant homeodomain finger 6) gene is one of the most frequently mutated genes in T-cell acute lymphoblastic leukemia (T-ALL), with somatic loss-of-function mutations occurring in 16% of pediatric cases and 38% of adult cases.1 PHF6 mutations also occur in myeloid neoplasms, including in 3% of acute myeloid leukemia2 and 2.5% of chronic myeloid leukemia.3 Recently, PHF6 mutations were reported in 16% to 55% of mixed phenotype acute leukemia,4-6 3% of high-grade B-cell lymphoma,7 and in pediatric B-progenitor acute lymphoblastic leukemia,8 suggesting that PHF6 may exert a tumor-suppressive role in multiple hematopoietic lineages. However, there is no direct functional evidence demonstrating whether these mutations contribute to pathogenesis.
Although PHF6 mutations reported in human malignancies are inactivating mutations, suggesting a tumor-suppressor function, PHF6 has conversely been shown to have tumor-promoting roles in mice. Specifically, cells with knockdown of Phf6 were selected against in murine Eµ-MYC lymphoma and BCR-ABL B-cell leukemia in vivo.9 Likewise, knockout of Phf6 in a BCR-ABL B-cell leukemia extended survival after transplantation into mice.10 These findings raise the question of whether PHF6 is a tumor suppressor or oncoprotein and suggest that it may have context-specific roles.
PHF6 is a nuclear protein involved in chromatin-mediated transcriptional regulation10,11 and is conserved among vertebrates, with 97.5% identity between humans and mice.12 PHF6 contains 2 atypical plant-homeodomain (PHD) zinc fingers. Canonical PHD fingers mediate protein localization to chromatin through binding to histones.13-16 The atypical PHD fingers of PHF6 share sequence similarity with a number of chromatin-associated proteins, including the atypical PHD of the mixed-lineage leukemia protein.11 The direct binding targets of the PHF6 PHD fingers are unknown, but PHF6 associates with histones, including H3,10 H1.2, H2B.1, H2A.Z, and H3.1.17
Germline PHF6 mutations cause the Börjeson–Forssman–Lehmann X-linked intellectual disability syndrome (BFLS).11 Of 50 male BFLS patients reported in the literature, T-ALL and Hodgkin lymphoma have each been reported in 1 patient.18,19 Although these numbers are too low to draw conclusions about whether BFLS is a cancer-predisposition syndrome, the existence of patients with PHF6 mutations who have not developed hematological malignancy raises the question of whether PHF6 mutations are driving events in leukemogenesis or could merely be passenger mutations. Although Phf6 is expressed throughout blood cell differentiation,1,2,20 its role in normal hematopoiesis has not been examined. To determine the requirement of PHF6 in hematopoiesis and in cancer, we examined the effects of loss of function of PHF6 in mice.
Materials and methods
Mice
The Phf6 targeted construct was generated using the approaches described in supplemental Methods, available on the Blood Web site.21-23 Experiments were performed with the approval of the Walter and Eliza Hall Institute for Medical Research (WEHI) Animal Ethics Committee and according to the Australian code of practice for the care and use of animals for scientific purposes.
Western blotting
Protein lysates from thymocytes were probed with anti-PHF6 (clone 4B1B6),12 anti–α-Tubulin (Sigma; T5168), and anti-mouse IgG-HRP (Sigma; NA931). Signals were detected using chemiluminescence (Luminata Forte).
Quantitative PCR
Quantitative PCR was performed using SensiMix SYBR Hi-ROX Kit (Bioline) and a LightCycler 480 System (Roche) using genomic DNA or complementary DNA (synthesized using a Tetro cDNA Synthesis Kit; Bioline) and the primers described in supplemental Tables 2 and 3. Samples were heated to 95°C for 10 minutes, followed by 40 cycles of 95°C for 20 seconds, 60°C for 20 seconds, and 72°C for 30 seconds.
Flow cytometry
Cells were stained with the antibodies listed in supplemental Table 4 and Fluoro-Gold (Sigma). Data were collected on a LSR II or Fortessa flow cytometer (BD) and analyzed using FlowJo v10.07 (TreeStar). Cells were counted using an ADVIA 120 (Bayer) or CASY (Scharfe) automated cell counting system. For Ki67 analysis, after cell surface marker staining, cells were fixed with BD Cytofix/Cytoperm, stained with Ki67 antibody (BD) overnight at 4°C, and resuspended in 1 µg/mL 4′,6-diamidino-2-phenylindole (DAPI) prior to analysis. 5-bromo-2′-deoxyuridine (BrdU; BD) was injected intraperitoneally (10 µg/g body weight) and then mice were given drinking water containing 1 mg/mL BrdU (Sigma) for 24 hours. Cells were prepared using a BrdU-FITC staining kit (BD).
Culture
For Numb staining, sorted HSCs were cultured on gelatin-coated 8-well chamber slides in StemSpan media containing FLT3L (30 ng/mL; WEHI), stem cell factor (30 ng/mL; PeproTech), l-glutamine, and penicillin/streptomycin for 24 hours prior to the addition of 20 nM nocodazol. After an additional 24 hours, cells were fixed in 4% paraformaldehyde and stained with anti-Numb (Cell Signaling Technology; C28G11), anti-Rabbit–Alexa Fluor 488 (Invitrogen; 21206), and DAPI. See supplemental Methods for analysis details. In vitro colony assays were performed as previously described24 and detailed in supplemental Methods.
Tlx3 construct
Primers 5′-AGTTTCAGTGCGACTGGAGG-3′ and 5′-GGCAGCGATCCGTAGCTAC-3′ were used to amplify the Tlx3 coding complementary DNA sequence (National Center for Biotechnology Information accession number AK141870.1), which was cloned into the murine stem cell virus (MSCV)-IRES-GFP plasmid and confirmed by sequencing. MSCV retrovirus was harvested from the supernatants of HEK293T cells transfected with MSCV-IRES-GFP plasmids using FuGENE 6 (Promega).
Histology
Tissues/tumors were fixed in formalin and embedded in paraffin; 10-µM sections were cut and stained with hematoxylin and eosin or with anti-F4/80 (WEHI) or a VECTASTAIN ABC HRP Kit (Vector Laboratories; catalog number PK-4000).
Cytokines
The Mouse IFN α All Subtype ELISA Kit, High Sensitivity (PBL Assay Science) was used for IFN-α detection in plasma isolated from 12-week-old mice. The Bio-Plex Pro Mouse Cytokine 8-plex Assay #m60000007a (Bio-Rad) was used to quantify other cytokines in plasma from 6-week-old mice.
Statistical analysis
Student t tests, analysis of variance, χ2 test, and the Gehan-Breslow-Wilcoxon test were performed using Prism 7. Enzyme-linked immunosorbent assay standard curves were plotted using R Version 3.3.3 (drc package).25 Details about arcsine-square transformation are in supplemental Methods.
RNA sequencing
Sample preparation is described in supplemental Methods. Statistical analysis was performed using previously described approaches,26-32 as detailed in supplemental Methods. The RNA sequencing data reported in this article have been deposited in the Gene Expression Omnibus database (accession number GSE126316).
Results
Loss of PHF6 results in earlier onset hematopoietic neoplasms
We generated a conditional Phf6 allele by flanking exons 4 and 5 with loxP sites (Phf6lox; supplemental Figure 1A). Germline deletion33 of Phf6 on a C57BL/6 background resulted in perinatal lethality in males (hemizygous for the X-linked Phf6), whereas heterozygous females (Phf6+/−) survived to adulthood. To test whether PHF6 acts as a tumor suppressor, we monitored the survival of a cohort of Phf6+/− females, expected to lack PHF6 in a subset of cells due to X chromosome inactivation of the remaining wild-type Phf6 allele. After a long latency, we identified an earlier onset of hematopoietic neoplasms in Phf6+/− females compared with control (Phf6+/+) neoplasms that spontaneously occur in C57BL/6 mice (Figure 1A). In mice of both genotypes, hematopoietic tumors were localized to the liver, spleen, and/or lymph nodes, with a significant increase in spleen weight in Phf6+/− mice compared with control mice (Figure 1B-C). Tumors expressed T-cell, B-cell, or myeloid/erythroid cell surface markers or displayed aberrant expression of markers from multiple hematopoietic lineages (Figure 1D; supplemental Figure 1B). Two thirds of Phf6+/+ and Phf6+/− tumors were transplantable (Figure 1E).

Development of leukemia in mice with targeted Phf6 deletion. (A) Kaplan-Meier survival curve showing deaths due to hematopoietic neoplasm in Phf6+/− mice vs Phf6+/+ control mice. Note, a proportion (42% in the female cohort described here) of aged wild-type C57BL/6 mice develop spontaneous hematopoietic neoplasms. A vertical dash on the survival curve indicates deaths due to other causes. Data were analyzed using the Gehan–Breslow–Wilcoxon test. (B) Representative disease-free wild-type control spleen and spleens from Phf6+/+ control mice and Phf6+/− mice with hematopoietic malignancy. (C) Spleen weight of Phf6+/− mice (n = 10) compared with sick Phf6+/+ mice (n = 9), both with hematopoietic malignancy. Data were analyzed using the 2-tailed Student t test and are displayed as individual data points with mean ± standard error of the mean (SEM). (D) Table showing immunophenotype of Phf6+/− and control tumors. There was no significant effect of Phf6 heterozygous mutation. Data were analyzed using the χ2 test. (E) Outcome of transplantation of malignant splenocytes from Phf6+/− and Phf6+/+ mice and photographs of spleens from Rag1−/− recipient mice. Scale bars, 1 cm.
Development of leukemia in mice with targeted Phf6 deletion. (A) Kaplan-Meier survival curve showing deaths due to hematopoietic neoplasm in Phf6+/− mice vs Phf6+/+ control mice. Note, a proportion (42% in the female cohort described here) of aged wild-type C57BL/6 mice develop spontaneous hematopoietic neoplasms. A vertical dash on the survival curve indicates deaths due to other causes. Data were analyzed using the Gehan–Breslow–Wilcoxon test. (B) Representative disease-free wild-type control spleen and spleens from Phf6+/+ control mice and Phf6+/− mice with hematopoietic malignancy. (C) Spleen weight of Phf6+/− mice (n = 10) compared with sick Phf6+/+ mice (n = 9), both with hematopoietic malignancy. Data were analyzed using the 2-tailed Student t test and are displayed as individual data points with mean ± standard error of the mean (SEM). (D) Table showing immunophenotype of Phf6+/− and control tumors. There was no significant effect of Phf6 heterozygous mutation. Data were analyzed using the χ2 test. (E) Outcome of transplantation of malignant splenocytes from Phf6+/− and Phf6+/+ mice and photographs of spleens from Rag1−/− recipient mice. Scale bars, 1 cm.
To examine the effects of PHF6 loss in male hematopoietic cells, we used the Phf6lox strain and the Tie2-cre transgene (Tie2-creTg)34 to generate a Phf6-null mutation in hematopoietic and endothelial cells. Phf6 deletion in hematopoietic organs of Phf6lox/Y;Tie2-creTg/+ mice was confirmed at the DNA level (supplemental Figure 2A) and at the protein level (Figure 2A). Similar to the female cohort, loss of PHF6 in Phf6lox/Y;Tie2-creTg/+ mice resulted in a modestly accelerated onset of spontaneous hematopoietic malignancy (supplemental Figure 2B). Presentation of disease was similar to the female cohort (supplemental Figure 2C-H). These results show that loss of PHF6 accelerates the onset of hematopoietic neoplasm after germline or somatic mutation.
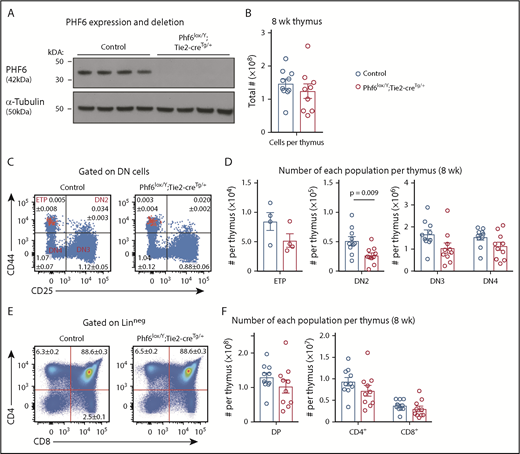
Perturbation in early T-cell differentiation caused by loss of PHF6. (A) Western blot of whole-cell lysates from Phf6lox/Y;Tie2-creTg/+ or control (Phf6+/Y) thymi probed with anti-PHF6 antibody, followed by an anti–α-tubulin antibody. Each lane represents thymocytes from 1 animal; a total of 8 animals is shown. (B) Thymocytes per 8-week-old thymus. (C) Gating strategy of early T-cell development. ETP (early thymic progenitor) cells are cKIThi cells within the CD44+CD25neg quadrant and are overlaid in red. DN2, DN3, and DN4 populations are defined by CD44 and CD25 expression, as indicated. Mean percentages ± SEM of each population as a proportion of thymocytes are displayed within the plots. There was a significant decrease in the percentage of DN2 and DN3 cells (P = .006 and P = .0009, respectively). (D) Quantification of each T-cell population indicated per thymus. (E) Gating strategy for late T-cell development showing mean percentages ± SEM for each population in the plot as a proportion of thymocytes. Linneg refers to lack of CD19, B220, MAC1, GR1, and TER119 expression. (F) Quantification of the numbers of thymic double-positive (DP), CD4+, or CD8+ cells. In panels B-F, n = 10 controls (Phf6+/Y;Tie2-creTg/+) and n = 9 Phf6lox/Y;Tie2-creTg/+ mice for all other populations, with the exception of the ETP population (n = 4 per genotype). The color corresponding to genotype is shown in (B). Data are from 8-week-old mice and were analyzed using the 2-tailed Student t test. Bar graphs are presented as individual data points (each circle represents 1 animal), with mean ± SEM.
Perturbation in early T-cell differentiation caused by loss of PHF6. (A) Western blot of whole-cell lysates from Phf6lox/Y;Tie2-creTg/+ or control (Phf6+/Y) thymi probed with anti-PHF6 antibody, followed by an anti–α-tubulin antibody. Each lane represents thymocytes from 1 animal; a total of 8 animals is shown. (B) Thymocytes per 8-week-old thymus. (C) Gating strategy of early T-cell development. ETP (early thymic progenitor) cells are cKIThi cells within the CD44+CD25neg quadrant and are overlaid in red. DN2, DN3, and DN4 populations are defined by CD44 and CD25 expression, as indicated. Mean percentages ± SEM of each population as a proportion of thymocytes are displayed within the plots. There was a significant decrease in the percentage of DN2 and DN3 cells (P = .006 and P = .0009, respectively). (D) Quantification of each T-cell population indicated per thymus. (E) Gating strategy for late T-cell development showing mean percentages ± SEM for each population in the plot as a proportion of thymocytes. Linneg refers to lack of CD19, B220, MAC1, GR1, and TER119 expression. (F) Quantification of the numbers of thymic double-positive (DP), CD4+, or CD8+ cells. In panels B-F, n = 10 controls (Phf6+/Y;Tie2-creTg/+) and n = 9 Phf6lox/Y;Tie2-creTg/+ mice for all other populations, with the exception of the ETP population (n = 4 per genotype). The color corresponding to genotype is shown in (B). Data are from 8-week-old mice and were analyzed using the 2-tailed Student t test. Bar graphs are presented as individual data points (each circle represents 1 animal), with mean ± SEM.
PHF6 is dispensable for the production of mature blood cells but affects early T-cell differentiation
Because PHF6 mutations are associated with hematopoietic malignancies, we hypothesized that PHF6 may regulate hematopoiesis. In 8- to 12-week-old mice, loss of PHF6 had no effect on the numbers of developing B cells or myeloid cells or on mature blood cell populations (supplemental Figure 3). Since PHF6 mutations are primarily associated with T-ALL, we examined the effect of PHF6 loss on T-cell development. There was no effect on thymus cellularity or on early thymic progenitor (ETP) number. In contrast, Phf6lox/Y;Tie2-creTg/+ mice had only 55% double-negative precursor stage 2 (DN2) cells compared with controls (Figure 2B-D). The percentages of Phf6-deleted DN3 cells were reduced (Figure 2C), but their total number was not significantly reduced (Figure 2D). The numbers and percentages of downstream populations were not altered in Phf6lox/Y;Tie2-creTg/+ thymi compared with controls (Figure 2C-F).
Loss of PHF6 affects hematopoietic stem and progenitor cell homeostasis
To examine whether PHF6 played a role in earlier stages of hematopoietic differentiation, we analyzed bone marrow stem/progenitor cell subsets. Although there was no difference in bone marrow cellularity (supplemental Figure 4A), the number of cells within the LinnegSCA1+cKIT+ (LSK) stem and progenitor cell–enriched population was increased by 27% in Phf6lox/Y;Tie2-creTg/+ mice vs controls (supplemental Figure 4B-C). Analysis of LSK subsets35,36 showed a reduced number of hematopoietic stem cells (HSCs), as well as an increase in the heterogeneous progenitor cell population HPC-1 in Phf6lox/Y;Tie2-creTg/+ mice. The numbers of multipotent progenitor cells (MPPs) and HPC-2 populations were not significantly different (Figure 3A-B). Within the HPC-1 population, the percentage of FLT3hi cells was increased (supplemental Figure 4D), suggesting that an increase in lymphoid-biased cells underlies the expansion of this population. Consistently, there was an 85% increase in the numbers of common lymphoid progenitor cells (CLPs) in Phf6lox/Y;Tie2-creTg/+ mice compared with controls (Figure 3C; supplemental Figure 4E). The reduction in HSCs and increase in HPC-1 cells were sustained in aging Phf6lox/Y;Tie2-creTg/+ mice (supplemental Figure 4F).
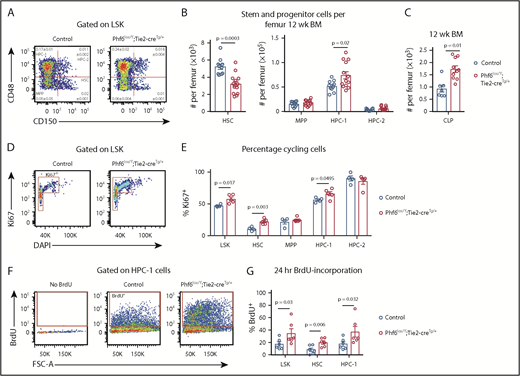
Loss of PHF6 affects HSC and lymphoid progenitor cell populations. (A) Bone marrow LSK cells subdivided based on CD48/CD150 expression, showing HSC, MPP, HPC-1, and HPC-2 cells. The mean percentage ± SEM of each population as a proportion of live bone marrow cells is shown within the plots. The percentage of HSC and HPC-1 cells was significantly different between genotypes (n = as in panel B; P = .0003 and P = .03, respectively). (B) Quantification of the total numbers of HSC, MPP, HPC-1, and HPC-2 cells per femur. n = 10 controls (9 Phf6+/Y;Tie2-creTg/+ and 1 Phf6+/Y); n = 13 Phf6lox/Y;Tie2-creTg/+ mice from 3 experiments combined. (C) Quantification of the numbers of CLPs per femur (CLPs: LinnegSCA1INTcKITINTIL7Rα+). n = 7 controls (6 Phf6+/Y;Tie2-creTg/+, 1 Phf6+/Y), n = 10 Phf6lox/Y;Tie2-creTg/+. Data are from 2 experiments combined. (D) Representative plot showing Ki67 and DAPI staining. (E) Quantification of the percentages of Ki67+ cells among LSK cells and each indicated subpopulation. n = 4 controls (Phf6+/Y;Tie2-creTg/+), n = 5 Phf6lox/Y;Tie2-creTg/+. (F) Plots showing gating for BrdU incorporation after 24 hours of BrdU treatment. (G) BrdU incorporation in HSCs and the indicated progenitor populations over a 24-hour period. n = 6 controls (Phf6+/Y;Tie2-creTg/+), n = 6 Phf6lox/Y;Tie2-creTg/+. Data in panels A-E were analyzed with a 2-tailed Student t test. Data in panel G were analyzed with a 1-tailed Student t test. All bar graphs are presented as individual data points (each circle represents 1 animal), with mean ± SEM.
Loss of PHF6 affects HSC and lymphoid progenitor cell populations. (A) Bone marrow LSK cells subdivided based on CD48/CD150 expression, showing HSC, MPP, HPC-1, and HPC-2 cells. The mean percentage ± SEM of each population as a proportion of live bone marrow cells is shown within the plots. The percentage of HSC and HPC-1 cells was significantly different between genotypes (n = as in panel B; P = .0003 and P = .03, respectively). (B) Quantification of the total numbers of HSC, MPP, HPC-1, and HPC-2 cells per femur. n = 10 controls (9 Phf6+/Y;Tie2-creTg/+ and 1 Phf6+/Y); n = 13 Phf6lox/Y;Tie2-creTg/+ mice from 3 experiments combined. (C) Quantification of the numbers of CLPs per femur (CLPs: LinnegSCA1INTcKITINTIL7Rα+). n = 7 controls (6 Phf6+/Y;Tie2-creTg/+, 1 Phf6+/Y), n = 10 Phf6lox/Y;Tie2-creTg/+. Data are from 2 experiments combined. (D) Representative plot showing Ki67 and DAPI staining. (E) Quantification of the percentages of Ki67+ cells among LSK cells and each indicated subpopulation. n = 4 controls (Phf6+/Y;Tie2-creTg/+), n = 5 Phf6lox/Y;Tie2-creTg/+. (F) Plots showing gating for BrdU incorporation after 24 hours of BrdU treatment. (G) BrdU incorporation in HSCs and the indicated progenitor populations over a 24-hour period. n = 6 controls (Phf6+/Y;Tie2-creTg/+), n = 6 Phf6lox/Y;Tie2-creTg/+. Data in panels A-E were analyzed with a 2-tailed Student t test. Data in panel G were analyzed with a 1-tailed Student t test. All bar graphs are presented as individual data points (each circle represents 1 animal), with mean ± SEM.
The reduction in HSCs could be driven by increased cell death, increased differentiating cell divisions, or decreased self-renewal. No changes in cell death were observed in HSC or progenitor populations (supplemental Figure 4G-I). We observed increased percentages of Ki67+ cycling cells within the HSC, HPC-1, and overall LSK populations of Phf6-deleted mice (Figure 3D-E). Consistently, higher percentages of Phf6-deleted HSCs, HPC-1 cells, and LSK cells incorporated BrdU over a 24-hour period (Figure 3F-G).
Increased competitive hematopoietic reconstitution caused by loss of PHF6
To functionally test Phf6-deleted HSC and progenitor cells, we performed serial whole bone marrow transplantation (Figure 4A). Analysis of peripheral white blood cells (WBCs) in primary hosts 4 weeks after transplantation revealed an increased contribution by Phf6-deleted cells, reflecting increased short-term reconstituting progenitor activity (supplemental Figure 5A). At 4 months, there were increased multi-lineage (B, T, and myeloid) contributions from Phf6-deleted cells (Figure 4B; supplemental Figure 5B), suggesting enhanced long-term reconstituting stem cell activity in the absence of PHF6. In the thymus of Phf6-deleted compared with control primary transplants, there were fewer DN2 and DN3 cells as a percentage of CD45.2+ cells (supplemental Figure 5C), recapitulating the T-cell development defects observed in the steady-state (Figure 2).

Bone marrow cells lacking PHF6 repopulate the hematopoietic system more efficiently and retain stem cell capacity through serial transplantations. (A) Schematic diagram showing the experimental design for competitive serial hematopoietic transplantation. (B) Percentages of donor cell contribution to long-term reconstitution 4 months after transplantation in each round of serial transplantation. n = 5 control (Phf6+/Y;Tie2-creTg/+), n = 6 Phf6lox/Y;Tie2-creTg/+ donors. All donors were 8 weeks old. Data were arcsine transformed and averaged by donor prior to analysis with a 2-tailed Student t test and are displayed as mean ± SEM. BM, bone marrow.
Bone marrow cells lacking PHF6 repopulate the hematopoietic system more efficiently and retain stem cell capacity through serial transplantations. (A) Schematic diagram showing the experimental design for competitive serial hematopoietic transplantation. (B) Percentages of donor cell contribution to long-term reconstitution 4 months after transplantation in each round of serial transplantation. n = 5 control (Phf6+/Y;Tie2-creTg/+), n = 6 Phf6lox/Y;Tie2-creTg/+ donors. All donors were 8 weeks old. Data were arcsine transformed and averaged by donor prior to analysis with a 2-tailed Student t test and are displayed as mean ± SEM. BM, bone marrow.
The repopulating potential of wild-type bone marrow declines over serial transplantation.37 Accordingly, we observed a decrease in the percentage of CD45.2+Phf6-intact cells in control transplants. In contrast, CD45.2+Phf6-deficient bone marrow cells showed sustained contribution over 5 rounds of transplantation and retained their competitive advantage (Figure 4B; supplemental Figure 5B). Several recipient mice transplanted with control bone marrow died from bone marrow failure in the fourth or fifth transplantation round. In contrast, only 1 recipient transplanted with Phf6-deleted cells died from bone marrow failure, whereas another died from a donor-derived leukemia (supplemental Figure 5D). Bone marrow analysis showed increased CD45.2+ contributions to progenitors in Phf6-deleted compared to control transplants, in particular to the HPC-1 and FLT3hiLSK populations. However, there was no statistically significant increase in the contribution to HSCs from Phf6-deleted CD45.2+ cells (supplemental Figure 5E). PHF6 loss did not affect the ratios of donor cells 18 hours after bone marrow transplantation, indicating no effect of PHF6 on homing ability (supplemental Figure 5F-G).
Enhanced hematopoietic reconstitution caused by PHF6 loss is due to increased production of differentiated progeny
To examine the ability of individual Phf6-deleted HSC and progenitor populations to self-renew and to produce progeny, we transplanted 100 sorted HSC, MPP, HPC-1, and HPC-2 cells with 2 × 10⁵ competitor cells (Figure 5A). Phf6-deleted HSCs demonstrated an enhanced contribution to peripheral blood at 12 and 16 weeks posttransplant (Figure 5B). We found limited reconstitution from control and Phf6-deleted HPC-1 and HPC-2 populations (supplemental Figure 6A-B). Consistent with previous reports that a fraction of wild-type MPPs are long-term reconstituting,36 control MPPs produced 17% of peripheral blood leukocytes. Remarkably, the Phf6-deleted MPP population produced 60% of peripheral leukocytes at 16 weeks posttransplant (Figure 5C). Importantly, there were few CD45.2+ HSCs in MPP-transplanted mice of both genotypes, demonstrating that the effect observed in MPP transplants could not be explained by impurity of sorting or dedifferentiation of MPPs to HSCs (supplemental Figure 6C).
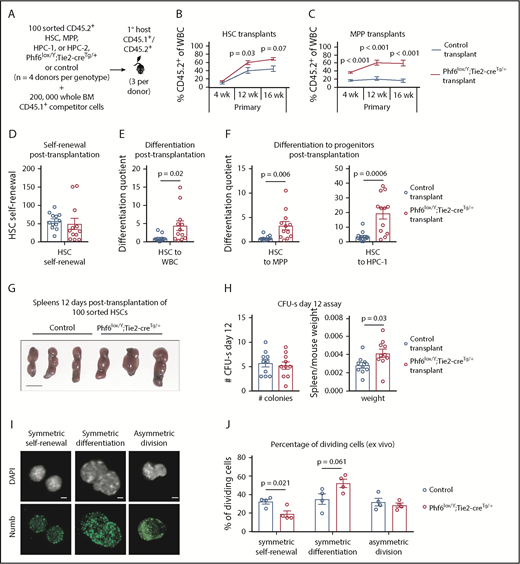
Enhanced hematopoietic reconstitution caused by loss of PHF6 is due to increased production of differentiated progeny. (A) Experimental design for transplants of each indicated population. (B) Contribution of CD45.2+ HSCs to peripheral blood. (C) Contribution of CD45.2+ MPP cells to peripheral blood. (D) Self-renewal of transplanted CD45.2+ HSCs, as calculated by dividing the final number of CD45.2+ HSCs per femur primary transplants by the input (100). (E) Differentiation of transplanted CD45.2+ HSCs to WBCs, calculated by dividing the final number of CD45.2+ WBCs per microliter of blood by the final number of CD45.2+ HSCs per femur. (F) Differentiation of transplanted CD45.2+ HSCs to progenitor populations, calculated by dividing the final number of each CD45.2+ progenitor population per femur by the final number of CD45.2+ HSCs per femur. (G) Representative images of spleens 12 days posttransplantation of 100 control or Phf6lox/Y;Tie2-creTg/+ HSCs. Scale bars, 1 cm. (H) Number of colonies counted on spleens and spleen weight (divided by host mouse weight) 12 days posttransplantation of control or Phf6lox/Y;Tie2-creTg/+ HSCs. (I) Images showing example of symmetric self-renewal (low Numb expression), symmetric differentiation (high Numb expression), and asymmetric differentiation (asymmetric Numb distribution). Scale bars, 2 µm. (J) Frequency of symmetric self-renewing, symmetric differentiating, and asymmetric divisions, as determined by Numb staining in control vs Phf6lox/Y;Tie2-creTg/+ HSCs, cultured for 48 hours, with addition of the mitosis inhibitor nocodazole after 24 hours. n = 4 control (3 Phf6+/Y;Tie2-creTg/+, 1 Phf6+/Y), n = 4 Phf6lox/Y;Tie2-creTg/+ donors in panels A-F. n = 3 control (Phf6+/Y;Tie2-creTg/+), n = 3 Phf6lox/Y;Tie2-creTg/+ donors in panels G-H. n = 4 control (2 Phf6+/Y;Tie2-creTg/+, 1 Phf6+/Y, 1 Phf6lox/Y), n = 4 Phf6lox/Y;Tie2-creTg/+ mice in panels I-J. All donors were 12 weeks old. Data in panels B-C were arcsine transformed prior to being analyzed by the 2-tailed Student t test and are displayed as mean ± SEM. Data in panels D-F,H were analyzed by the 2-tailed Student t test and are mean ± SEM, with individual data points shown for each transplant recipient. Data in panel J were analyzed by the 2-tailed Student t test and are mean ± SEM.
Enhanced hematopoietic reconstitution caused by loss of PHF6 is due to increased production of differentiated progeny. (A) Experimental design for transplants of each indicated population. (B) Contribution of CD45.2+ HSCs to peripheral blood. (C) Contribution of CD45.2+ MPP cells to peripheral blood. (D) Self-renewal of transplanted CD45.2+ HSCs, as calculated by dividing the final number of CD45.2+ HSCs per femur primary transplants by the input (100). (E) Differentiation of transplanted CD45.2+ HSCs to WBCs, calculated by dividing the final number of CD45.2+ WBCs per microliter of blood by the final number of CD45.2+ HSCs per femur. (F) Differentiation of transplanted CD45.2+ HSCs to progenitor populations, calculated by dividing the final number of each CD45.2+ progenitor population per femur by the final number of CD45.2+ HSCs per femur. (G) Representative images of spleens 12 days posttransplantation of 100 control or Phf6lox/Y;Tie2-creTg/+ HSCs. Scale bars, 1 cm. (H) Number of colonies counted on spleens and spleen weight (divided by host mouse weight) 12 days posttransplantation of control or Phf6lox/Y;Tie2-creTg/+ HSCs. (I) Images showing example of symmetric self-renewal (low Numb expression), symmetric differentiation (high Numb expression), and asymmetric differentiation (asymmetric Numb distribution). Scale bars, 2 µm. (J) Frequency of symmetric self-renewing, symmetric differentiating, and asymmetric divisions, as determined by Numb staining in control vs Phf6lox/Y;Tie2-creTg/+ HSCs, cultured for 48 hours, with addition of the mitosis inhibitor nocodazole after 24 hours. n = 4 control (3 Phf6+/Y;Tie2-creTg/+, 1 Phf6+/Y), n = 4 Phf6lox/Y;Tie2-creTg/+ donors in panels A-F. n = 3 control (Phf6+/Y;Tie2-creTg/+), n = 3 Phf6lox/Y;Tie2-creTg/+ donors in panels G-H. n = 4 control (2 Phf6+/Y;Tie2-creTg/+, 1 Phf6+/Y, 1 Phf6lox/Y), n = 4 Phf6lox/Y;Tie2-creTg/+ mice in panels I-J. All donors were 12 weeks old. Data in panels B-C were arcsine transformed prior to being analyzed by the 2-tailed Student t test and are displayed as mean ± SEM. Data in panels D-F,H were analyzed by the 2-tailed Student t test and are mean ± SEM, with individual data points shown for each transplant recipient. Data in panel J were analyzed by the 2-tailed Student t test and are mean ± SEM.
We transplanted 5 million cells from MPP primary transplants into secondary recipients. We observed increased short-term, but variable long-term, contributions from Phf6-deleted MPPs (supplemental Figure 6D), indicating that it is unlikely that the Phf6-deleted MPP population underlies the sustained serial repopulating capacity of Phf6-deleted bone marrow. On the other hand, a stringent HSC secondary transplantation test showed enhanced long-term reconstitution by Phf6-deleted HSCs (supplemental Figure 6E).
Using methods described by Goodell and colleagues,38 we calculated HSC self-renewal and differentiation quotients (see the legend of Figure 5 and supplemental Methods). There was no effect of Phf6 on HSC self-renewal (Figure 5D); however, Phf6-deleted HSCs displayed enhanced differentiation to WBCs compared with control HSCs (Figure 5E). To assess whether this effect occurred early in differentiation, we calculated the differentiation quotient from HSCs to each progenitor population. Phf6-deleted HSC transplants displayed enhanced differentiation to the MPP and HPC-1 stages (Figure 5F). Thus, it appears that HSCs lacking PHF6 have enhanced competitive repopulating ability due to increased differentiation.
An equal number of spleen colony-forming units, individual cells capable of myeloid and lymphoid production,39,40 were present 12 days after injection of 100 control or Phf6-deleted HSCs, consistent with equivalent homing between genotypes. Recipients of Phf6-deleted HSCs had larger spleens per body weight compared with control recipients, indicating larger colonies and corroborating the findings of increased progeny output from Phf6-deleted HSCs (Figure 5G-H).
The finding of an unaltered self-renewal quotient posttransplantation poses an apparent contradiction with the reduced number of steady-state HSCs in Phf6lox/Y;Tie2-creTg/+ mice. To investigate the effect of Phf6 on self-renewal using an alternate method, we cultured HSCs for 48 hours and performed immunostaining for Numb, the distribution and intensity of which enable discrimination among symmetric self-renewal, symmetric differentiation, and asymmetric division.41-43 Loss of PHF6 resulted in a reduced proportion of self-renewing symmetric divisions and a trend toward a higher proportion of differentiating divisions (Figure 5I-J). Similarly, a reduced proportion of blast colonies and an increased proportion of differentiated colonies were produced from Phf6-deleted bone marrow in vitro (supplemental Figure 6F-G).
Upregulation of IFN response genes in Phf6-deleted HSCs and progenitors
RNA sequencing of HSC, MPP, and HPC-1 populations, comparing Phf6lox/Y;Tie2-creTg/+ with Phf6+/Y;Tie2-creTg/+ control cells followed by gene-set enrichment analysis revealed that the reactome interferon (IFN) α/β signaling signature was upregulated in the absence of PHF6 (Figure 6A-B; supplemental Figure 7A-B).
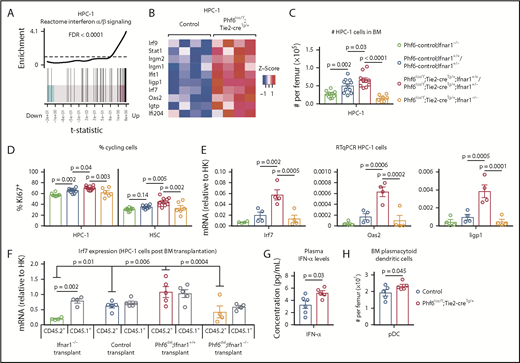
PHF6 regulates ISG expression in hematopoietic stem and progenitor cells. (A) Barcode enrichment plots showing positive correlation between the reactome IFN α/β signaling pathway and the gene-expression changes in Phf6-deleted vs control HPC-1 cells. The horizontal axis shows t statistics for all genes in the Phf6-deleted dataset, whereas vertical lines represent genes in the reactome IFN α/β signaling pathway. Red and blue shaded areas indicate genes that are upregulated and downregulated, respectively, in the Phf6-deleted cells, and worms show the relative enrichment of the IFN signature. The IFN signature is enriched among upregulated genes on the right of the plot. (B) Heat maps of a subset of IFN-stimulated genes comparing Phf6-deleted HPC-1 cells with control HPC-1 cells. Each column represents 1 animal. n = 4 controls (Phf6+/Y;Tie2-creTg/+), n = 4 Phf6lox/Y;Tie2-creTg/+. (C) Number of HPC-1 cells in the bone marrow. n = 10 Phf6-control;Ifnar1−/− (3 Phf6+/Y;Tie2-creTg/+;Ifnar1−/−, 5 Phf6lox/Y;Ifnar1−/−, 2 Phf6+/Y;Ifnar1−/−), n = 11 controls (6 Phf6+/Y;Tie2-creTg/+;Ifnar1+/+, 1 Phf6+/Y;Ifnar1+/+, 1 Phf6lox/Y;Ifnar1+/+, 3 Phf6+/Y;Tie2-creTg/+;Ifnar1+/−), n = 6 Phf6lox/Y;Tie2-creTg/+;Ifnar1+/+, n = 4 Phf6lox/Y;Tie2-creTg/+;Ifnar1+/−, and n = 7 Phf6lox/Y;Tie2-creTg/+;Ifnar1−/−. (D) Percentage of Ki67+ cells in the indicated populations. n = 8 Phf6-control;Ifnar1−/− (3 Phf6+/Y;Tie2-creTg/+;Ifnar1−/−, 3 Phf6lox/Y;Ifnar1−/−, 2 Phf6+/Y;Ifnar1−/−), n = 10 controls (6 Phf6+/Y;Tie2-creTg/+;Ifnar1+/+, 1 Phf6+/Y;Ifnar1+/+, 1 Phf6lox/Y;Ifnar1+/−, 2 Phf6+/Y;Tie2-creTg/+;Ifnar1+/−), n = 7 Phf6lox/Y;Tie2-creTg/+;Ifnar1+/+, n = 3 Phf6lox/Y;Tie2-creTg/+;Ifnar1+/−, and n = 6 Phf6lox/Y;Tie2-creTg/+;Ifnar1−/−. Genotype colors are shown in panel C. (E) RT-qPCR analysis showing mRNA levels of Irf7, Oas2, and Iigp1 in HPC-1 cells of the indicated genotypes relative to mRNA levels in housekeeping genes (HK; Gapdh, Actb, and Pgk1). n = 4 Phf6+/Y;Tie2-creTg/+;Ifnar1−/−, n = 4 Phf6+/Y;Tie2-creTg/+;Ifnar1+/+, n = 4 Phf6lox/Y;Tie2-creTg/+;Ifnar1+/+, and n = 4 Phf6lox/Y;Tie2-creTg/+;Ifnar1−/−. Genotype colors are shown in panel C. (F) RT-qPCR analysis showing mRNA levels of Irf7 in CD45.1+ and CD45.2+ HPC-1 cells isolated from irradiated CD45.1+ host mice 4 months posttransplantation with 2.5 million whole bone marrow cells of the indicated genotype, along with 2.5 million CD45.1+ wild-type competitor cells. n = 4 Phf6+/Y;Tie2-creTg/+;Ifnar1−/− donors, n = 5 control donors (2 Phf6+/Y;Tie2-creTg/+;Ifnar1+/+, 2 Phf6+/Y;Ifnar1+/+, 1 Phf6lox/Y;Ifnar1+/+), n = 5 Phf6lox/Y;Tie2-creTg/+;Ifnar1+/+ donors, and n = 4 Phf6lox/Y;Tie2-creTg/+;Ifnar1−/− donors. Average expression of donors was calculated prior to statistical analysis. Note that 1 host mouse transplanted with control cells was excluded from the analysis because expression of Irf7 was >3 standard deviations above the values of the other control transplants in CD45.1+ and CD45.2+ cells (values of 7.1 and 5.2 arbitrary units relative to HK, respectively). Thus, the average of the other 2 host mice receiving bone marrow from the same donor was used. (G) Concentration of IFN-α in plasma of untreated mice. n = 6 controls (3 Phf6+/Y;Tie2-creTg/+, 3 Phf6+/Y) and n = 5 Phf6lox/Y;Tie2-creTg/+. (H) Number of pDCs in the bone marrow of control mice (n = 5 Phf6+/Y;Tie2-creTg/+) compared with Phf6lox/Y;Tie2-creTg/+ mice (n = 5), as defined by cell surface expression of PDCA1 and Siglec H. (A-B) See “Materials and methods” for details on RNA sequencing analysis. Data in panels C-F were analyzed by 1-way analysis of variance and are individual data points with mean ± SEM showing significant results from multiple comparisons using the Fisher’s least significant difference test. Data in panels G-H were analyzed by the 2-tailed Student t test and are shown as individual points for each animal with mean ± SEM.
PHF6 regulates ISG expression in hematopoietic stem and progenitor cells. (A) Barcode enrichment plots showing positive correlation between the reactome IFN α/β signaling pathway and the gene-expression changes in Phf6-deleted vs control HPC-1 cells. The horizontal axis shows t statistics for all genes in the Phf6-deleted dataset, whereas vertical lines represent genes in the reactome IFN α/β signaling pathway. Red and blue shaded areas indicate genes that are upregulated and downregulated, respectively, in the Phf6-deleted cells, and worms show the relative enrichment of the IFN signature. The IFN signature is enriched among upregulated genes on the right of the plot. (B) Heat maps of a subset of IFN-stimulated genes comparing Phf6-deleted HPC-1 cells with control HPC-1 cells. Each column represents 1 animal. n = 4 controls (Phf6+/Y;Tie2-creTg/+), n = 4 Phf6lox/Y;Tie2-creTg/+. (C) Number of HPC-1 cells in the bone marrow. n = 10 Phf6-control;Ifnar1−/− (3 Phf6+/Y;Tie2-creTg/+;Ifnar1−/−, 5 Phf6lox/Y;Ifnar1−/−, 2 Phf6+/Y;Ifnar1−/−), n = 11 controls (6 Phf6+/Y;Tie2-creTg/+;Ifnar1+/+, 1 Phf6+/Y;Ifnar1+/+, 1 Phf6lox/Y;Ifnar1+/+, 3 Phf6+/Y;Tie2-creTg/+;Ifnar1+/−), n = 6 Phf6lox/Y;Tie2-creTg/+;Ifnar1+/+, n = 4 Phf6lox/Y;Tie2-creTg/+;Ifnar1+/−, and n = 7 Phf6lox/Y;Tie2-creTg/+;Ifnar1−/−. (D) Percentage of Ki67+ cells in the indicated populations. n = 8 Phf6-control;Ifnar1−/− (3 Phf6+/Y;Tie2-creTg/+;Ifnar1−/−, 3 Phf6lox/Y;Ifnar1−/−, 2 Phf6+/Y;Ifnar1−/−), n = 10 controls (6 Phf6+/Y;Tie2-creTg/+;Ifnar1+/+, 1 Phf6+/Y;Ifnar1+/+, 1 Phf6lox/Y;Ifnar1+/−, 2 Phf6+/Y;Tie2-creTg/+;Ifnar1+/−), n = 7 Phf6lox/Y;Tie2-creTg/+;Ifnar1+/+, n = 3 Phf6lox/Y;Tie2-creTg/+;Ifnar1+/−, and n = 6 Phf6lox/Y;Tie2-creTg/+;Ifnar1−/−. Genotype colors are shown in panel C. (E) RT-qPCR analysis showing mRNA levels of Irf7, Oas2, and Iigp1 in HPC-1 cells of the indicated genotypes relative to mRNA levels in housekeeping genes (HK; Gapdh, Actb, and Pgk1). n = 4 Phf6+/Y;Tie2-creTg/+;Ifnar1−/−, n = 4 Phf6+/Y;Tie2-creTg/+;Ifnar1+/+, n = 4 Phf6lox/Y;Tie2-creTg/+;Ifnar1+/+, and n = 4 Phf6lox/Y;Tie2-creTg/+;Ifnar1−/−. Genotype colors are shown in panel C. (F) RT-qPCR analysis showing mRNA levels of Irf7 in CD45.1+ and CD45.2+ HPC-1 cells isolated from irradiated CD45.1+ host mice 4 months posttransplantation with 2.5 million whole bone marrow cells of the indicated genotype, along with 2.5 million CD45.1+ wild-type competitor cells. n = 4 Phf6+/Y;Tie2-creTg/+;Ifnar1−/− donors, n = 5 control donors (2 Phf6+/Y;Tie2-creTg/+;Ifnar1+/+, 2 Phf6+/Y;Ifnar1+/+, 1 Phf6lox/Y;Ifnar1+/+), n = 5 Phf6lox/Y;Tie2-creTg/+;Ifnar1+/+ donors, and n = 4 Phf6lox/Y;Tie2-creTg/+;Ifnar1−/− donors. Average expression of donors was calculated prior to statistical analysis. Note that 1 host mouse transplanted with control cells was excluded from the analysis because expression of Irf7 was >3 standard deviations above the values of the other control transplants in CD45.1+ and CD45.2+ cells (values of 7.1 and 5.2 arbitrary units relative to HK, respectively). Thus, the average of the other 2 host mice receiving bone marrow from the same donor was used. (G) Concentration of IFN-α in plasma of untreated mice. n = 6 controls (3 Phf6+/Y;Tie2-creTg/+, 3 Phf6+/Y) and n = 5 Phf6lox/Y;Tie2-creTg/+. (H) Number of pDCs in the bone marrow of control mice (n = 5 Phf6+/Y;Tie2-creTg/+) compared with Phf6lox/Y;Tie2-creTg/+ mice (n = 5), as defined by cell surface expression of PDCA1 and Siglec H. (A-B) See “Materials and methods” for details on RNA sequencing analysis. Data in panels C-F were analyzed by 1-way analysis of variance and are individual data points with mean ± SEM showing significant results from multiple comparisons using the Fisher’s least significant difference test. Data in panels G-H were analyzed by the 2-tailed Student t test and are shown as individual points for each animal with mean ± SEM.
To test whether the phenotype caused by Phf6 deletion was dependent on IFN-α signaling, we examined the effects of deleting the IFN-α receptor gene, Ifnar1, on the abnormalities caused by loss of PHF6. The increase in HPC-1 and LSK cells observed in response to loss of PHF6 alone was recapitulated in Phf6lox/Y;Tie2-creTg/+;Ifnar1+/+ mice and Phf6lox/Y;Tie2-creTg/+;Ifnar1+/− mice compared with controls. Homozygous deletion of Ifnar1 (Phf6lox/Y;Tie2-creTg/+;Ifnar1−/−) reversed the increased numbers of HPC-1 and LSK cells caused by loss of PHF6 (Figure 6C; supplemental Figure 7C). Although the effects of PHF6 on the number of HSCs was not affected by loss of Ifnar1, the reduction in the proportion of HSCs within the LSK population was reversed (supplemental Figure 7C-D). Furthermore, the increased cycling of PHF6-deficient HPC-1 and HSC populations was reversed by Ifnar1 deletion (Figure 6D).
Quantitative reverse transcription PCR (RT-qPCR) showed increased messenger RNA (mRNA) expression in IFN-stimulated genes (ISGs) Irf7, Oas2, and Iigp1 in Phf6-deleted cells compared with control HPC-1 cells, validating the RNA sequencing results. These gene-expression differences were restored to control levels by loss of Ifnar1 (Figure 6E).
To examine whether the upregulation of ISGs caused by loss of PHF6 was cell intrinsic, we transplanted 2.5 million CD45.2+ bone marrow cells from Ifnar1−/− mice, Phf6+/Y;Tie2-creTg/+;Ifnar1+/+ mice, Phf6lox/Y;Tie2-creTg/+;Ifnar1+/+ mice, and Phf6lox/Y;Tie2-creTg/+;Ifnar1−/− mice with 2.5 million wild-type CD45.1+ bone marrow cells. The competitive repopulation advantage caused by Phf6 deletion was still present in Phf6lox/Y;Tie2-creTg/+;Ifnar1−/− transplants (supplemental Figure 7F-G), indicating that this aspect of the Phf6-deleted phenotype was IFNAR1 independent. However, the frequencies of CD45.2+ HPC-1 cells and other progenitor subsets, as a proportion of total bone marrow, were increased by Phf6 deletion and restored to control levels by Ifnar1 deletion (supplemental Figure 7H). The increased expression of Irf7 in Phf6-deleted HPC-1 cells compared with controls, which was reversed by loss of Ifnar1, was recapitulated posttransplantation. Interestingly, Irf7 expression was also increased in CD45.1+ competitor cells transplanted with CD45.2+Phf6-deleted cells (Figure 6F), indicating that progenitor cell–extrinsic mechanisms contribute to gene-expression changes.
We assayed cytokine levels in the plasma of Phf6lox/Y;Tie2-creTg/+ mice vs control mice and found a modest increase in IFN-α (Figure 6G). We did not detect any changes in the levels of IFN-γ or other cytokines (supplemental Figure 7I), demonstrating that PHF6 does not have a general effect on cytokine production. Notably, we found that the numbers of plasmacytoid dendritic cells (pDCs), the major producers of IFN-α,44 were increased in Phf6lox/Y;Tie2-creTg/+ bone marrow (Figure 6H).
TLX3 overexpression synergizes with PHF6 loss to cause leukemia
Our data show that PHF6 loss results in perturbations in the hematopoietic system, as well as a moderately accelerated onset of hematopoietic neoplasms. The long latency of the neoplasms observed suggests that cooperating mutations are required for malignant transformation. Therefore, we tested the effects of T-ALL–associated mutations in combination with loss of PHF6.
In human T-ALL, loss of PHF6 frequently cooccurs with aberrant expression of the homeobox transcription factors TLX1 or TLX3.1 The effect of ectopic Tlx3 expression has not been demonstrated experimentally. Therefore, we tested the possibilities of leukemia induction by TLX3 and cooperation between loss of PHF6 and TLX3 expression. We overexpressed TLX3 using a GFP-tagged retrovirus in Phf6lox/Y;Tie2-creTg/+ and control fetal liver cells and transplanted these into lethally irradiated CD45.1+ hosts. Mice transplanted with control cells expressing Tlx3-GFP developed leukemia at 49% penetrance within 1 year, with illness occurring from 125 days to 351 days posttransplant. Strikingly, 100% of the mice transplanted with Phf6lox/Y;Tie2-creTg/+;Tlx3-GFP cells developed leukemia between 62 days and 147 days posttransplant (Figure 7A).
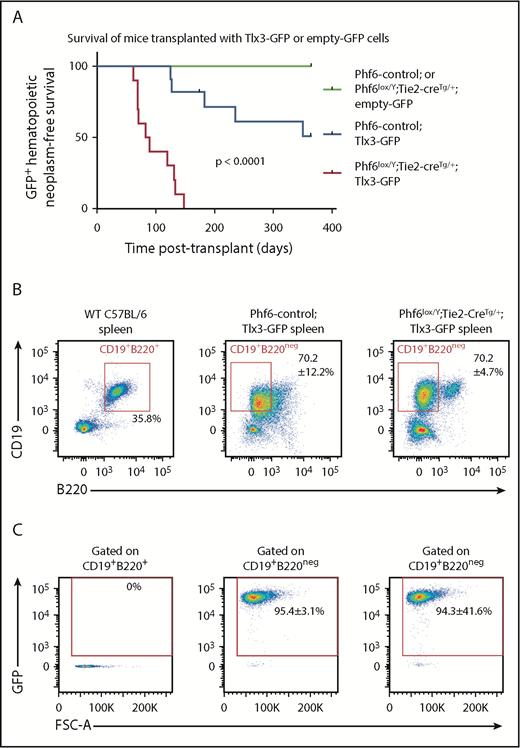
Loss of PHF6 synergizes with ectopic TLX3 expression to drive leukemogenesis. (A) Kaplan-Meier survival curve of host mice transplanted with Phf6-deleted or Phf6 control cells expressing MSCV-empty-GFP (empty-GFP) or MSCV-Tlx3-GFP (Tlx3-GFP) retrovirus. n = 11 Phf6-control;Tlx3-GFP, n = 10 Phf6lox/Y;Tie2-creTg/+;Tlx3-GFP, n = 6 Phf6-control;empty-GFP, and n = 6 Phf6lox/Y;Tie2-creTg/+;empty-GFP from 4 donors per genotype. Data were analyzed using the Gehan–Breslow–Wilcoxon test. (B) Cell surface phenotype of Tlx3-GFP tumors of indicated Phf6 genotype with comparison with wild-type spleen cells, showing expression of CD19 and B220. (C) Plots showing no GFP expression in normal B cells of a wild-type spleen and GFP+CD19+B220neg cells in Tlx3-GFP transplants. (B-C) The phenotype and quantification ± standard error of the mean are representative of all analyzed Tlx3-GFP tumors (n = 3 Phf6-control;Tlx3-GFP, n = 10 Phf6lox/Y;Tie2-creTg/+;Tlx3-GFP).
Loss of PHF6 synergizes with ectopic TLX3 expression to drive leukemogenesis. (A) Kaplan-Meier survival curve of host mice transplanted with Phf6-deleted or Phf6 control cells expressing MSCV-empty-GFP (empty-GFP) or MSCV-Tlx3-GFP (Tlx3-GFP) retrovirus. n = 11 Phf6-control;Tlx3-GFP, n = 10 Phf6lox/Y;Tie2-creTg/+;Tlx3-GFP, n = 6 Phf6-control;empty-GFP, and n = 6 Phf6lox/Y;Tie2-creTg/+;empty-GFP from 4 donors per genotype. Data were analyzed using the Gehan–Breslow–Wilcoxon test. (B) Cell surface phenotype of Tlx3-GFP tumors of indicated Phf6 genotype with comparison with wild-type spleen cells, showing expression of CD19 and B220. (C) Plots showing no GFP expression in normal B cells of a wild-type spleen and GFP+CD19+B220neg cells in Tlx3-GFP transplants. (B-C) The phenotype and quantification ± standard error of the mean are representative of all analyzed Tlx3-GFP tumors (n = 3 Phf6-control;Tlx3-GFP, n = 10 Phf6lox/Y;Tie2-creTg/+;Tlx3-GFP).
In contrast, we found no effect of the loss of PHF6 on malignancies driven by overexpression of the Notch1 intracellular domain45 (supplemental Figure 8A), despite the high frequency of NOTCH1 mutations46 and reports of comutation of PHF6 and NOTCH1 in human T-ALL.47,48 Mutations in Tp53 are found in 4% to 11% of patients with T-ALL49,50 ; however, we did not find any cooperation between loss of PHF6 and p5351 mutation (supplemental Figure 8B). PHF6 mutation can co-occur with aberrant expression of basic-helix loop-helix/LMO family oncogenes.1,52 In mice developing LMO2-driven53 lymphoma, deletion of Phf6 only modestly accelerated disease (supplemental Figure 8C). Therefore, the strong synergy appears to be specific to loss of PHF6 and overexpression of TLX3.
Mice with Phf6-deleted and Phf6-intact Tlx3 leukemia had high WBC counts, enlarged spleens (supplemental Figure 8B), enlarged lymph nodes, and hind leg paralysis, suggesting central nervous system infiltration. Leukemic cells were CD19+, indicating a B-cell lineage origin, but they expressed low levels of the B-cell marker B220 (Figure 7B) and the pan-hematopoietic marker CD45 (supplemental Figure 8E). GFP expression confirmed a donor origin (Figure 7C). Further phenotypic analysis revealed low expression of mature B-cell markers IgD and IgM, lack of CD138 and FAS, and high expression of CXCR4 and CD98 (supplemental Figure 8E-F). Three of 3 tumors from each genotype recapitulated disease upon transplantation (supplemental Figure 8G). These results demonstrate that loss of PHF6 and overexpression of Tlx3 synergize to cause lymphoid neoplasms in mice.
Discussion
The balance between self-renewal and differentiation is mediated by cell-intrinsic and cell-extrinsic processes. The IFN signaling pathway integrates external cues to regulate HSC and progenitor behavior in response to high IFN levels.54 Deletion of Ifnar1, or Jak1, a mediator of IFNAR signaling, results in increased HSC quiescence, suggesting that basal IFN signaling contributes to the maintenance of HSC and progenitor homeostasis.54,55 Here, we show that loss of PHF6 results in an upregulation of ISGs in hematopoietic stem and progenitor cells. The impact of PHF6 on this pathway is functionally relevant, because deletion of Ifnar1 restored the number of HPC-1 cells and the cycling status of Phf6-deleted HSC and HPC-1 cells. The upregulation of ISGs includes a cell-extrinsic mechanism that is likely mediated by pDCs and IFN-α. Thus, the complex phenotype of Phf6-deleted HSCs and progenitors is controlled, in part, by feedback from mature hematopoietic cells.
Certain phenotypes resulting from PHF6 loss, including the competitive transplantation advantage, were independent of IFNAR1, indicating that PHF6 must also control other pathways. The findings of a reduced HSC number in the steady-state and a reduced proportion of self-renewing divisions ex vivo in Phf6-deleted HSCs suggest that loss of PHF6 may tip the balance of HSCs toward differentiation over self-renewal. Nonetheless, posttransplantation, loss of PHF6 did not impact the HSC self-renewal quotient, despite an increase in differentiation. These seemingly discordant results likely reflect fundamental differences between native and transplant hematopoiesis.56 Furthermore, we emphasize that the self-renewal quotient described here reflects the accumulation of HSCs, rather than the duration of their self-renewal ability. At least a subset of Phf6-deleted HSCs must have extended self-renewal potential to protect host mice from bone marrow failure across serial transplantation.
Alterations in hematopoietic homeostasis in mice lacking PHF6 provide insight into how loss of PHF6 could predispose to hematopoietic malignancy. Stimulation of HSCs to cycle, including via activation of the IFN signaling pathway, results in increased DNA damage.57 Thus, the increased cycling within Phf6-deleted HSC and progenitor cells may increase the likelihood of acquiring mutations. The combination of enhanced cell output and sustained self-renewal of Phf6-deleted stem and progenitor cell populations, together with a partial block at or prior to the DN2 stage of T-cell differentiation in the thymus, could create conditions favorable for the development of T-ALL.
An intriguing question is why there is a lineage bias of PHF6 mutations in T-lineage leukemia compared with other lineages in humans. Meacham and colleagues hypothesized that PHF6 plays lineage-specific roles, because knock-down of Phf6 was selected against in BCR-ABL and Eµ-MYC B-cell lymphomas, favored in mixed-lineage leukemia–AF9 acute myeloid leukemia, and neutral in Trp53−/− T-ALL.9 Our results suggest that PHF6 does not act in a strictly lineage-dependent manner. Rather, loss of PHF6 appears to cooperate with specific additional oncogenic mutations. Loss of PHF6 had no effect on the Trp53+/− or ICN1-driven T-cell malignancies, but it accelerated LMO2-driven thymic T-cell lymphoma. Additionally, although PHF6 has been reported to play tumor-promoting roles in BCR-ABL/Eµ-MYC–driven B-cell lymphomas,9 we demonstrated that PHF6 can also act as a tumor suppressor in the B-cell lineage when combined with expression of TLX3. Thus, the effect of PHF6 may depend on the specific molecular pathways driving each tumor.
The retroviral model reported here is the first in vivo demonstration of an oncogenic function of TLX3. In our model, TLX3 is expressed from the HSC stage, whereas the translocations that occur in humans most frequently place TLX3 under the control of the T-cell–restricted BCL11b regulatory elements,58 restricting expression to T cells. Although we demonstrate here that TLX3 overexpression is oncogenic in the murine B lineage, translocations permissive to its expression may occur infrequently in human B cells. Because loss of PHF6 and TLX3 expression has a synergistic effect, the exclusivity of TLX3 mutations to human T-ALL may explain the high frequency of PHF6 mutations in leukemia of the T-cell lineage. Notwithstanding, we expect the basis for synergy between loss of PHF6 and TLX3 overexpression in our mouse model and in human T-ALL to be similar. TLX3 regulates transcription of thousands of genes.59 We suggest that PHF6 may result in a chromatin state that potentiates the oncogenic effects of TLX3.
We found that loss of PHF6 accelerates the onset of hematopoietic tumors in males and females. Therefore, females heterozygous for PHF6 mutations, as well as males with BFLS, may be at risk for hematopoietic malignancy and, thus, should be monitored to enable early detection. Together, our results demonstrate that (1) PHF6 regulates hematopoietic stem and progenitor cell homoeostasis, in part via regulation of IFN signaling, (2) PHF6 is a tumor suppressor in vivo, (3) TLX3 is oncogenic in vivo, and (4) loss of PHF6 strongly and specifically synergizes with Tlx3 overexpression to cause lymphoid neoplasms.
Note added in proof
While the manuscript was under revision a study reporting similar results was published online.60
The data reported in this article have been deposited in the Gene Expression Omnibus database (accession number GSE126316).
The online version of this article contains a data supplement.
The publication costs of this article were defrayed in part by page charge payment. Therefore, and solely to indicate this fact, this article is hereby marked “advertisement” in accordance with 18 USC section 1734.
Acknowledgments
The authors thank F. Dabrowski, M. Pritchard, J. Gilbert, E. Sutherland, L. Johnson, and WEHI Bioservices for animal work; S. Eccles, J. McManus, J. Corbin, E. Tsui and WEHI Histology; S. Monard and the WEHI FACS facility; L. Whitehead, and V. Wimmer for excellent technical support; D. Quilci, T. Nikolaou, and K. Weston for irradiation services; C. Hyland, H. Abdulla, and R. Alserihi for advice on flow cytometry antibodies and staining protocols; M. Blewitt, J. Heath, and S. Davidson for helpful discussions; T. De Jong-Curtain and K. Morgan for proofreading the manuscript; and L. Coultas and B. Kile for providing mice essential for this work.
This work was supported by an Australian Postgraduate Award (H.M.M.), National Health and Medical Research Council (NHMRC) Project grants 1029481 and 1084248, NHMRC Program grants (1016701 [A.S.] and 1113577 [W.S.A.]), NHMRC Research Fellowships (1003435 [T.T.], 575512 and 1081421 [A.K.V.], 1020363 [A.S.], and 1058344 [W.S.A.]), Independent Research Institutes Infrastructure Support Scheme from the Australian Government’s NHMRC, and a Victorian State Government Operational Infrastructure Support Grant.
Authorship
Contribution: H.M.M. planned and performed experiments, analyzed and interpreted data, and wrote the manuscript; A.L.G. and Y.H. analyzed RNA sequencing datasets and produced images for data visualization; M.P.D. and M.A.C. designed and made the targeted Phf6 construct; R.E.M. cloned the TLX3 construct; M.T.W., W.C., B.N.S., A.J.K., T.A.N., K.M., R.G., L.D.R., and A.P. assisted with planning and performing experiments and analysis of data and contributed to interpretation of data; B.J.A. and A.S. contributed to interpretation of data; S.W. contributed to design of the RNA sequencing experiment and performed sequencing of libraries; M.P.M., A.K., E.D.H., W.S.A., and D.H.D.G. contributed to the design of experiments and interpretation of data; J.G. contributed to the production of the Phf6 floxed mice; G.K.S. supervised the analysis of RNA sequencing datasets; T.T. and A.K.V. conceived the project and contributed to experimental design, data interpretation, and planning the manuscript; and all authors contributed to writing or editing the manuscript.
Conflict-of-interest disclosure: The authors declare no competing financial interests.
Correspondence: Tim Thomas, The Walter and Eliza Hall Institute, 1G Royal Pde, Parkville, VIC 3052, Australia; e-mail: tthomas@wehi.edu.au;and Anne K. Voss, The Walter and Eliza Hall Institute, 1G Royal Pde, Parkville, VIC 3052, Australia; e-mail: avoss@wehi.edu.au.
