

Key Points
Chr5 and chr21 gains co-occurred with IDH2R172 mutation in AITL, whereas IDH2 wild-type cases had deletions targeting PI3K–AKT–mTOR.
PTCL-NOS molecular subgroups (PTCL-GATA3 and PTCL-TBX21) had distinct genetic aberrations, and CDKN2A loss showed prognostic significance.

Abstract
Peripheral T-cell lymphoma (PTCL) is a group of complex clinicopathological entities, often associated with an aggressive clinical course. Angioimmunoblastic T-cell lymphoma (AITL) and PTCL-not otherwise specified (PTCL-NOS) are the 2 most frequent categories, accounting for >50% of PTCLs. Gene expression profiling (GEP) defined molecular signatures for AITL and delineated biological and prognostic subgroups within PTCL-NOS (PTCL-GATA3 and PTCL-TBX21). Genomic copy number (CN) analysis and targeted sequencing of these molecular subgroups revealed unique CN abnormalities (CNAs) and oncogenic pathways, indicating distinct oncogenic evolution. PTCL-GATA3 exhibited greater genomic complexity that was characterized by frequent loss or mutation of tumor suppressor genes targeting the CDKN2A/B-TP53 axis and PTEN-PI3K pathways. Co-occurring gains/amplifications of STAT3 and MYC occurred in PTCL-GATA3. Several CNAs, in particular loss of CDKN2A, exhibited prognostic significance in PTCL-NOS as a single entity and in the PTCL-GATA3 subgroup. The PTCL-TBX21 subgroup had fewer CNAs, primarily targeting cytotoxic effector genes, and was enriched in mutations of genes regulating DNA methylation. CNAs affecting metabolic processes regulating RNA/protein degradation and T-cell receptor signaling were common in both subgroups. AITL showed lower genomic complexity compared with other PTCL entities, with frequent co-occurring gains of chromosome 5 (chr5) and chr21 that were significantly associated with IDH2R172 mutation. CN losses were enriched in genes regulating PI3K–AKT–mTOR signaling in cases without IDH2 mutation. Overall, we demonstrated that novel GEP-defined PTCL subgroups likely evolve by distinct genetic pathways and provided biological rationale for therapies that may be investigated in future clinical trials.
Introduction
Peripheral T-cell lymphoma (PTCL) accounts for 10% to 15% of non-Hodgkin lymphomas (NHLs) in the western world and ∼20% of NHLs in Asia or Central and South America.1 The current World Health Organization (WHO) classification recognizes ∼30 distinct PTCL entities, including angioimmunoblastic T-cell lymphoma (AITL), anaplastic large cell lymphoma (ALCL), adult T-cell leukemia/lymphoma (ATLL) and extranodal NK/T-cell lymphoma of nasal type with distinct clinicopathological characteristics.1 PTCL patients exhibit poor response to standard chemotherapy,2 with the exception of ALK- and DUSP22-translocated ALCL cases.3 AITL is the most common PTCL entity, with distinct clinicopathological features,4,5 including a dysregulated immune system evidenced by polyclonal hypergammaglobulinemia and autoimmune manifestations, while also displaying strong immunosuppression in the tumor with the frequent presence of Epstein-Barr virus–infected B cells.4 We and other investigators have demonstrated T follicular helper (TFH) cells as the cell of origin and characteristic activation of the NF-κB pathway.6-8 AITL has frequent mutations of genes regulating the epigenome (TET2, IDH2R172, and DNMT3A) and proximal T-cell receptor (TCR) and costimulatory signaling pathways.9-13 However, the complex underlying pathobiology of AITL remains poorly defined.
Approximately 30% to 50% of PTCL cases cannot be further classified and are designated PTCL-not otherwise specified (PTCL-NOS).1,2 Thus, PTCL-NOS includes a heterogeneous group of cases that is difficult to diagnose and treat.2 Using gene expression profiling (GEP), we identified diagnostic and prognostic molecular signatures for major PTCL entities and identified 2 novel molecular subgroups within PTCL-NOS.7,8,14 These subgroups were characterized by differential expression of master T helper 1 (TH1) or TH2 cell-differentiation regulators (TBX21 or GATA3, respectively) with corresponding target genes8,15 and significant differences in oncogenic transcriptional signatures and clinical outcome.8 Although these subgroups have been alluded to in the 2017 WHO classification scheme,1 the genetic basis of this distinction is unknown. We investigated the genetic etiology of the subgroups using extensive GEP, genomic copy number (CN) analysis, and mutation analysis of candidate driver genes within abnormal loci. Furthermore, we evaluated potential therapeutic targets affecting oncogenic pathways in these molecular subgroups.
Materials and methods
Detailed materials and methods can be found in supplemental Materials and methods (available on the Blood Web site).
Patient material and cell lines
Data for AITL (n = 35) and PTCL-NOS (n = 69) are shown in supplemental Table 1. We removed PTCL-TFH cases16 (n = 15) from PTCL-NOS using messenger RNA (mRNA) or protein (immunohistochemistry [IHC]) markers of TFH cells (Figure 1A-B; supplemental Table 1). A total of 114 (of 119) PTCL cases were reviewed by ≥2 hematopathologists for consensus diagnosis. All but 14 cases have been characterized previously.7,8,17,18 Genomic data from ATLL,19 ALCL,20 cutaneous T-cell lymphoma (CTCL),21 and PTCL-NOS17,22,23 were evaluated for identification of subtype-specific CN abnormalities (CNAs). Characteristics of the T-cell lines are shown in supplemental Table 2.

Characteristics of PTCL entities and subgroups. (A) Gene expression data of predefined gene signatures for AITL, the PTCL-GATA3 and PTCL-TBX218 subgroups, and PTCL-TFH17 using fresh-frozen RNA on the HG-U133 Plus2 platform (Affymetrix). (B) Average expression of the PTCL-TFH signature17 in PTCL subgroups (left panel), the probe sets for 6 genes listed by the WHO to classify PTCL-TFH (middle panel), and the AITL molecular signature8 (right panel). (C) Kaplan-Meier curves comparing OS between the PTCL subgroups with available data. (D) Comparison of percent aberrant genome in PTCL subgroups (PTCL-TFH, AITL, PTCL-TBX21, ALK+ ALCL,20 ALK− ALCL,20 and PTCL-GATA3).
Characteristics of PTCL entities and subgroups. (A) Gene expression data of predefined gene signatures for AITL, the PTCL-GATA3 and PTCL-TBX218 subgroups, and PTCL-TFH17 using fresh-frozen RNA on the HG-U133 Plus2 platform (Affymetrix). (B) Average expression of the PTCL-TFH signature17 in PTCL subgroups (left panel), the probe sets for 6 genes listed by the WHO to classify PTCL-TFH (middle panel), and the AITL molecular signature8 (right panel). (C) Kaplan-Meier curves comparing OS between the PTCL subgroups with available data. (D) Comparison of percent aberrant genome in PTCL subgroups (PTCL-TFH, AITL, PTCL-TBX21, ALK+ ALCL,20 ALK− ALCL,20 and PTCL-GATA3).
Genomic CN analysis
Affymetrix SNP-250K (n = 12), SNP 6.0 (n = 8), OncoScan (n = 71), and Agilent SurePrint17 (n = 25) arrays were used (supplemental Table 1). CNAs were analyzed with Nexus Copy Number (BioDiscovery). To ensure appropriate platform integration, 6 cases were profiled on both the SNP-250K and OncoScan platforms, and highly concordant CN profiles were observed. Tumor content was assessed by the ABSOLUTE algorithm24 based on single nucleotide polymorphism hybridization and by morphologic review of the percentage of pleomorphic neoplastic T cells in cases with material available for review. We did not detect significant correlation between high or low aberrant genomes and tumor content, suggesting that detection of fewer CNAs cannot be explained simply by low tumor content (supplemental Table 1).
Molecular classification of cases with RNA-seq and FFPE-derived GEP data
A predefined GEP signature for AITL8 was used to evaluate pathological AITL cases with RNA sequencing (RNA-seq) data. Eight cases with RNA-seq data were molecularly classified as AITL with >80% probability using a Bayesian algorithm (supplemental Figure 2A). A similar analysis was performed for PTCL-GATA3 and PTCL-TBX21 subtyping for formalin-fixed paraffin-embedded (FFPE) samples7,8 (supplemental Figure 2B).
Integrative analysis of CNAs and GEP
mRNA expression and CN status were compared using a 1-sided Student t test. Ingenuity pathway analysis and DAVID were used for integrated pathway analysis of the genes within aberrant loci.
Unsupervised hierarchical clustering
Unsupervised hierarchical clustering (HC) of PTCL-NOS cases by the CN status of recurrent abnormalities (≥10% frequency in PTCL-GATA3 or PTCL-TBX21) was performed with Cluster 3.0.
Target gene sequencing and analysis
A SureSelect panel (Agilent) targeting 334 genes mutated in NHLs and encompassing aberrant loci was used for mutational analysis. Libraries were sequenced using an Illumina system. Data analysis was described previously.25
Results
Clinical characteristics and molecular classification of PTCL
PTCL cases were classified using our predefined GEP signatures.7,8 These included fresh-frozen (FF) tissues (n = 94) profiled by HG-U133 Plus2,7,8,17 FFPE tissues (n = 17) profiled using DASL (Illumina),18 and 8 AITL cases with RNA-seq data (supplemental Figure 2). PTCL-TFH cases (n = 15), a provisional entity according to the 2017 WHO classification,1 were identified primarily by morphological assessment and the expression of the WHO-defined IHC markers.1 However, 6 cases lacking tissue for IHC were identified based on a recently described PTCL-TFH GEP signature,17 which showed mRNA expression similar to known PTCL-TFH samples (Figure 1A-B). When we examined the TFH signature17 in the entire set, it was found to be enriched in only AITL or PTCL-TFH (Figure 1B). After excluding PTCL-TFH cases, PTCL-NOS cases were subclassified into PTCL-GATA3 (n = 31) and PTCL-TBX21 (n = 30) subgroups using GEP, and 5 cases remained unclassifiable.7,8 PTCL-TFH cases were used only for comparative analysis (supplemental Figure 1E). There was no significant difference in age between cohorts (supplemental Table 3). PTCL-GATA3 showed inferior overall survival (OS) compared with other groups (Figure 1C), as previously demonstrated.8,15
Integrated genomic analysis of molecularly defined AITL
AITL had the least abnormal genome (mean = 7%), with CN gains more frequent than CN losses and with a percent aberrant genome comparable to PTCL-TFH and PTCL-TBX21 (Figure 1D). Cases with low aberrant genomes showed no significant difference in tumor content compared with highly aberrant cases, as estimated by the ABSOLUTE algorithm based on single nucleotide polymorphism hybridization,24 as well as by morphologic review of the percentage of neoplastic T cells. This suggests that detection of fewer CNAs was not due to low tumor content (supplemental Table 1).
Of the most frequent CNAs (Figure 2A), chromosome 5 (chr5) gain (43%; 15/35) and chr21 gain (23%; 8/35) significantly co-occurred (P = .01). Gain of chr7/7q, chr11, chr19, or chr22q occurred in ≥10% (4/35) of AITL cases, consistent with a recent study.17 Integration of CN status and GEP data identified 597 upregulated (P < .05) candidate target genes, which were enriched in biological processes involving RNA/protein metabolism, mitochondrial dysfunction, and cell cycle regulation using DAVID analysis (supplemental Table 4).

CN analysis in AITL. (A) Frequency of chromosomal gains and losses in AITL tumors quantified using Nexus Copy Number. Candidate genes within aberrant loci are indicated. (B) Heat map of differentially expressed genes (P < .05) located on chr5 between cases with and without a chr5 gain. (C) Percent aberrant genome segregated on mutation status of IDH2R172 in AITL cases. Asian and Western cohorts are distinguished by color, whereas CN state of chr5 is indicated by shape. (D) Genes involved in the PI3K–AKT–mTOR pathway that are deleted in ≥10% of AITL cases and their association with frequent CNAs and mutations, which are indicated below. (E) PI3K–AKT–mTOR schematic diagram with striped patterned genes deleted in AITL at a frequency ≥ 10%. Genes in red are negative regulators, and genes in green are positive regulators. (F) Matrix of Pearson correlation coefficients for co-occurring genomic abnormalities and mutations in AITL.
CN analysis in AITL. (A) Frequency of chromosomal gains and losses in AITL tumors quantified using Nexus Copy Number. Candidate genes within aberrant loci are indicated. (B) Heat map of differentially expressed genes (P < .05) located on chr5 between cases with and without a chr5 gain. (C) Percent aberrant genome segregated on mutation status of IDH2R172 in AITL cases. Asian and Western cohorts are distinguished by color, whereas CN state of chr5 is indicated by shape. (D) Genes involved in the PI3K–AKT–mTOR pathway that are deleted in ≥10% of AITL cases and their association with frequent CNAs and mutations, which are indicated below. (E) PI3K–AKT–mTOR schematic diagram with striped patterned genes deleted in AITL at a frequency ≥ 10%. Genes in red are negative regulators, and genes in green are positive regulators. (F) Matrix of Pearson correlation coefficients for co-occurring genomic abnormalities and mutations in AITL.
Chr5 gain in AITL is distinctive, because other hematological malignancies exhibit chr5 loss.26,27 Examination of chr5 genes in cases with GEP showed that 95 were significantly (P ≤ .05) upregulated in the cases with chr5 gain, including IL4, IL13, and MAPK9, which affect cell cycle regulation and T-cell differentiation.28 Many of these genes showed an expression pattern similar to IL12-activated normal CD4+ T cells (Figure 2B). Genes related to cell cycle (P = .004; false discovery rate [FDR], 4.21%) and T-cell activation (P = .035; FDR, 24.0%) were also significantly upregulated in cases with chr5 gain (supplemental Table 5). Gene-set enrichment analysis indicated marginal enrichment of oxidative phosphorylation–associated genes (P = .048; FDR = not significant [NS]). Chr5 gain was significantly associated with IDH2R172 mutation (P = .01) but not with recurrent mutations in DNMT3A, RHOAG17V, or TET2. AITL cases without chr5 gain showed enrichments of NF-κB (P = .009, FDR, 11.1%) and PI3K-AKT (P = .008; FDR, 0.47%) pathway signatures according to DAVID, suggesting alternative oncogenic pathways in these cases (supplemental Table 6). A similar gene-signature association was observed in IDH2WT cases. Interestingly, a marginally higher percent aberrant genome was associated with IDH2R172 mutation in AITL (Figure 2C).
Compared with the entire chromosome/arm gains, more focal deletions were observed and included a number of loci located at 1p36.33, 9q34.11, 13q22.3, 16p13.3, 16q24.3, 17p13.1, and 19q13.2-4. We identified frequently deleted genes (≥10%, 4/35) and analyzed only genes expressed (≥ 1 fragments per kilobase of transcript per million mapped reads) in normal TFH cells.29 Genes in deleted loci having significant loss of mRNA expression included genes involved with ubiquitylation/proteolysis (FBXO44 and PSMB3), microtubule organization (SLAIN1), and mitoribosome stability (MRPL28 and MPV17L2). Association with the PI3K–AKT–mTOR pathway was observed in genes lost in ≥4 cases (supplemental Table 7) and included negative regulators (STK11, PPP2R2D, PHLPP1, and TSC2),30 PI3K regulatory subunit PIK3R2 (p85β), and genes regulating amino acid sensing in the mTORC1 signaling pathway (WDR24) (Figure 2D-E). The positive regulator of PI3K-AKT signaling, PDPK130 (16p13.3), which is mutated in 6% of AITL,9 is also deleted in AITL. CN loss of several PI3K-AKT phosphatases (PHLPP1 and/or PPP2R2D) showed a trend of mutual exclusivity with IDH2R172 mutations (P = .057; CoMEt_exact_test31 ), whereas DNMT3A mutations showed a negative correlation with other key regulators of the PI3K-AKT pathway, with some genes showing a marginal trend (eg, PIK3R2 and PKN3; P = .08), whereas other genes (eg, STK11, YWHAE, and PPP2R2D; P = .12 to .26) did not show statistical significance, probably because of the small number of cases available for analysis. These findings suggest alternative oncogenic mechanisms in mutant cases (Figure 2F). Examination of TCR signaling showed that 12% of AITL had CD28 gain/amplification, in addition to mutations and fusions observed in AITL.9,32,33
Integrated genomic analysis of molecularly defined PTCL subgroups
PTCL-GATA3 exhibited a more aberrant genome (mean, 23%) than PTCL-TBX21 (mean, 8%; P < .001) (Figure 1D), with frequent partial/complete chr7 gain (48%; 15/31), partial/complete chr8q gain (45%; 14/31), and chr17q gain (42%; 13/31) (Figure 3A). MYC (8q24.21) was gained/amplified in 52% (16/31) with concomitant higher mRNA expression (3.7-fold; P < .001) (Figure 3B), along with an enrichment of MYC target genes (P < .05; FDR < 10%).8 Chr17q gain encompassed STAT3 and was associated with elevated mRNA (2.4-fold, P < .001) (Figure 3B). Interestingly, 9 of 11 cases with a STAT3 gain had an MYC gain. Evaluation of MYC and phosphorylated STAT3 expression by IHC in available cases indicated a trend of higher protein expression with CN gain (supplemental Figure 3). Focal gain/amplification encompassing REL (2p16.1) was associated with increased mRNA (2.5-fold, P = .005) (Figure 1A-B; supplemental Figure 3B).

CN and expression analysis in molecular subgroups of PTCL. (A) Frequency of chromosomal gains and losses found in PTCL-GATA3 and PTCL-TBX21 tumors. Candidate genes in focal regions are indicated. (B). The relative mRNA expression (n = 157, previously molecularly classified PTCL-NOS7,8 ) and median-centered log2 mRNA expression (n = 47, CN cases with Affymetrix HG-U133 Plus2 gene expression data) of select recurrently aberrant genes with differential gene expression relative to DNA CN status. In the relative mRNA expression plots (left panel), colored bars (except gray) indicate cases included in the present CN analysis. Kaplan-Meier curves comparing specific gene aberrations in the PTCL-NOS entity, PTCL-GATA3 subgroup, and combined with a previously published PTCL-NOS series23 are included for CDKN2A, which tended to be associated with poor OS. (C) Validation of genes within recurrent loci observed in the PTCL-GATA3 subgroup using the NanoString Cancer CNV assay. (D) Kaplan-Meier curves comparing the upper vs lower halves of CDKN2A mRNA expression from all molecular PTCL-NOS cases with GEP and outcome data (n = 125) from (B) (left panel) and only in PTCL-GATA3 (n = 52; right panel). (E) Frequency plots of chr6 and chr14 alterations, which have differential regions of abnormality in PTCL-GATA3 and PTCL-TBX21 subgroups. Candidate target genes within the regions are noted.
CN and expression analysis in molecular subgroups of PTCL. (A) Frequency of chromosomal gains and losses found in PTCL-GATA3 and PTCL-TBX21 tumors. Candidate genes in focal regions are indicated. (B). The relative mRNA expression (n = 157, previously molecularly classified PTCL-NOS7,8 ) and median-centered log2 mRNA expression (n = 47, CN cases with Affymetrix HG-U133 Plus2 gene expression data) of select recurrently aberrant genes with differential gene expression relative to DNA CN status. In the relative mRNA expression plots (left panel), colored bars (except gray) indicate cases included in the present CN analysis. Kaplan-Meier curves comparing specific gene aberrations in the PTCL-NOS entity, PTCL-GATA3 subgroup, and combined with a previously published PTCL-NOS series23 are included for CDKN2A, which tended to be associated with poor OS. (C) Validation of genes within recurrent loci observed in the PTCL-GATA3 subgroup using the NanoString Cancer CNV assay. (D) Kaplan-Meier curves comparing the upper vs lower halves of CDKN2A mRNA expression from all molecular PTCL-NOS cases with GEP and outcome data (n = 125) from (B) (left panel) and only in PTCL-GATA3 (n = 52; right panel). (E) Frequency plots of chr6 and chr14 alterations, which have differential regions of abnormality in PTCL-GATA3 and PTCL-TBX21 subgroups. Candidate target genes within the regions are noted.
CN deletions in PTCL-GATA3 included deletion of chr17p (del-17p), del-13q, del-10q, del-9p21.3, del-5q, del-6q21, and del-1q, which affected well-characterized tumor suppressors (TSs) (TP53 [58% heterozygous], PTEN [35%; 10 heterozygous, 1 homozygous], FAS [32%; 8 heterozygous, 2 homozygous], CDKN2A/B [45%; 7 heterozygous, 7 homozygous], and PRDM1 [23%; heterozygous]). Of these, CDKN2A (P = .03) and FOXO1 (P = .02) mRNA significantly decreased with CN deletion (Figure 3B). Several genes within CNAs were validated using an nCounter Cancer CN Assay (Figure 3C). CDKN2A loss was associated with poorer OS in the PTCL-NOS (P = .001) and PTCL-GATA3 (P = .004) (Figure 3B) subgroups. PTEN and TP53 loss and MYC and STAT3 gain demonstrated a trend of inferior OS in PTCL-NOS, but these likely reflect the inferior survival of PTCL-GATA3 compared with PTCL-TBX21, because these CNAs are more common in PTCL-GATA3 (supplemental Figure 4). We validated OS associations of CDKN2A in combination with an independent series23 and observed similar survival trends (Figure 3B). Furthermore, low CDKN2A mRNA expression associated with poor OS in the series of PTCL-NOS (P = .007) and a trend in PTCL-GATA3 (Figure 3D). Genes within aberrant loci were significantly enriched in biological processes involving splicing, ubiquitination, and signaling pathways (PI3K/mTOR, FAS, and TCR). When mRNA expression of these genes was examined, the expected changes in expression were observed (supplemental Table 8).
PTCL-TBX21 had fewer CNAs and a less aberrant genome (8%), with 23% of cases having gains along the q-arms of chr1 and chr3. These loci included immune-regulatory genes (CD244, CD247, FASLG) at chr1q23 and cell cycle regulators (TP63, TPRG1) at chr3q28, with significantly increased mRNA expression (P < .05) in cases with a respective CN gain. Six cases (20%) had a gain encompassing BCL11B (14q32.2; Figure 3E), a negative regulator of GATA3 and the TH2 expression program.34 Five cases (17%) showed BCL6 gain at 3q27.3 but did not show any change in mRNA expression. Recurrent losses were infrequent compared with PTCL-GATA3, but focal deletions were observed on chr6, chr10, chr16, chr17, and chr19. chr6q was affected by deletions in PTCL-GATA3 and PTCL-TBX21; however, the deletions were more telomeric in PTCL-TBX21 (Figure 3D) and included newly identified TS-related (LATS1 and ZC3H12D) or TCR-related (FYN and IBTK) genes and TNFAIP3, with concordant low mRNA expression associated with CN deletion. Chr10 deletion included the proapoptotic gene BNIP3, TH2-related gene PRKCQ,35 and cell polarity–related gene PARD3. Genes within CNAs were enriched in cytotoxicity-mediating pathways and processes related to RNA splicing (supplemental Table 9).
Validation of subgroup-specific CNAs and comparative analysis with other major PTCL entities
Because genomic profiles were distinct between PTCL-GATA3 and PTCL-TBX21, we examined whether CNAs could delineate these 2 subgroups. Using unsupervised HC of CNAs present in ≥10% of either PTCL-GATA3 or PTCL-TBX21, we observed 2 distinct clusters enriched in PTCL-GATA3 or PTCL-TBX21 cases. Analysis of genomic CN profiles from 2 available PTCL-NOS cohorts22,23 showed similar abnormalities (supplemental Figure 1C-D), with 2 major HC clusters of cases characterized by similar CNAs (data not shown). Expression of CCR4 (GATA3 target gene) and CXCR3 (TBX21 target gene)37 was available in 1 series23 and was used as surrogate markers for the 2 subgroups, because GATA3/CCR4 and TBX21/CXCR3 showed a positive correlation at the protein and mRNA levels (Figure 4A-B).38 The CCR4+ group had a higher than average aberrant genome compared with CXCR3/CCR3+ cases, an observation concordant with PTCL-GATA3 vs PTCL-TBX21 (Figure 4C). Meta-analysis of all series (n = 159) showed distinct clusters with comparable percent aberrant genome distributions and enrichment in either of the molecular subgroups with significant differences in CNAs (Figure 4D). This large cohort allowed for correlative association of CNAs. TP53 loss significantly (Fisher’s exact test) co-occurred with loss of PTEN (P < .001), PRDM1 (0.002), and CDKN2A (P < .001), but it had no or a negative correlation with CNAs present in PTCL-TBX21 (Figure 4E).

Unsupervised HC of CNAs in PTCL. (A) IHC staining of GATA3, TBX21, CCR4, and CXCR3 in a molecularly classified case of PTCL-TBX21 (upper panels) or PTCL-GATA3 (lower panels). Original magnification of ×200 with an inset magnification of ×400. (B) Positive correlation of TBX21 and CXCR3 mRNA expression in the PTCL-TBX21 subgroup (upper panel) and GATA3 and CCR4 mRNA expression in the PTCL-GATA3 subgroup (lower panel). (C) Histograms (left panels) and boxplots (right panels) of the percent aberrant genome of PTCL-GATA3 and PTCL-TBX21 molecularly classified cases, along with PTCL-GATA3–like and PTCL-TBX21–like cases, from 2 published series.22,23 (D) Unsupervised HC of 3 PTCL-NOS series22,23 by recurrent CNAs observed in the PTCL-GATA3 or PTCL-TBX21 molecular subgroups at a frequency ≥10%. The molecular PTCL-GATA3/GATA3–like cases (blue shades) dominate the central clusters, whereas the outside clusters, which tend to lack frequent CNAs, are predominately molecular PTCL-TBX21/TBX21–like cases (red shades). The frequency of these aberrations in the molecularly classified PTCL-NOS subgroups from the present study are depicted to the right of the cluster. (E) Matrix of Pearson correlation coefficients for co-occurring CNAs. Abnormalities depicted in blue type are more frequent in PTCL-GATA3, whereas abnormalities depicted in red type are more frequent in PTCL-TBX21. The black type (6p-Gain) represents a CNA that was observed at near-equal frequencies in the 2 molecular subgroups.
Unsupervised HC of CNAs in PTCL. (A) IHC staining of GATA3, TBX21, CCR4, and CXCR3 in a molecularly classified case of PTCL-TBX21 (upper panels) or PTCL-GATA3 (lower panels). Original magnification of ×200 with an inset magnification of ×400. (B) Positive correlation of TBX21 and CXCR3 mRNA expression in the PTCL-TBX21 subgroup (upper panel) and GATA3 and CCR4 mRNA expression in the PTCL-GATA3 subgroup (lower panel). (C) Histograms (left panels) and boxplots (right panels) of the percent aberrant genome of PTCL-GATA3 and PTCL-TBX21 molecularly classified cases, along with PTCL-GATA3–like and PTCL-TBX21–like cases, from 2 published series.22,23 (D) Unsupervised HC of 3 PTCL-NOS series22,23 by recurrent CNAs observed in the PTCL-GATA3 or PTCL-TBX21 molecular subgroups at a frequency ≥10%. The molecular PTCL-GATA3/GATA3–like cases (blue shades) dominate the central clusters, whereas the outside clusters, which tend to lack frequent CNAs, are predominately molecular PTCL-TBX21/TBX21–like cases (red shades). The frequency of these aberrations in the molecularly classified PTCL-NOS subgroups from the present study are depicted to the right of the cluster. (E) Matrix of Pearson correlation coefficients for co-occurring CNAs. Abnormalities depicted in blue type are more frequent in PTCL-GATA3, whereas abnormalities depicted in red type are more frequent in PTCL-TBX21. The black type (6p-Gain) represents a CNA that was observed at near-equal frequencies in the 2 molecular subgroups.
We compared the AITL, PTCL-TBX21, and PTCL-GATA3 genomic profiles with other PTCL entities (Figure 5A-B), including ALCL,20 ATLL,19 and systemic CTCL.21 PTCL-TBX21 has a low-complexity genome similar to AITL, whereas PTCL-GATA3 showed a highly aberrant genome more comparable to ATLL and ALK− ALCL (Figure 5C). Several CNAs were distinct among entities (Figure 5D). Co-occurring gains of chr5 and chr21 were unique to AITL. CDKN2A, PRDM1, and TP53 deletions were comparable between PTCL-GATA3 and ATLL, but PTEN deletions were uncommon in ATLL.19 Del-5q, del-9, del-12, del-13q, del-15q, and chr7 gain were more frequently associated with PTCL-GATA3. PTCL-TBX21 had few CNAs; the most recurrent were del-10p and chr1q gain, the latter of which was also observed in ATLL, ALCL, and PTCL-GATA3 but not in AITL or CTCL.19-21
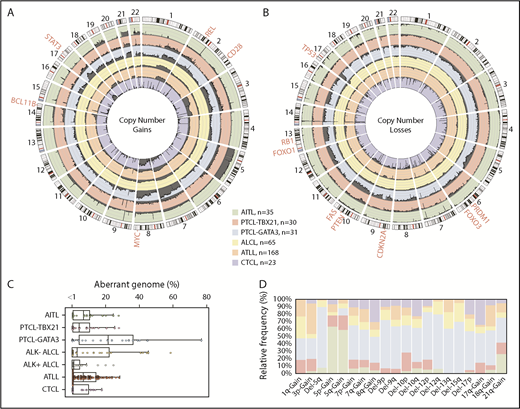
Comparison of CNAs found in PTCL entities/subgroups. Circos plots comparing the frequency of gains (A) and losses (B) found in PTCL entities/subgroups (AITL, PTCL-TBX21, PTCL-GATA3, ALCL, ATLL, and CTCL). The dark gray shading denotes aberrant regions. The scale lines represent 20% increments. (C) Boxplot of the aberrant genome in PTCL entities/subgroups. The dot plot overlay represents the aberrant genome of individual samples separated into 1% bins. (D) Relative frequency distribution of CNAs presenting at a frequency ≥25% in ≥1 PTCL entity or subgroup.
Comparison of CNAs found in PTCL entities/subgroups. Circos plots comparing the frequency of gains (A) and losses (B) found in PTCL entities/subgroups (AITL, PTCL-TBX21, PTCL-GATA3, ALCL, ATLL, and CTCL). The dark gray shading denotes aberrant regions. The scale lines represent 20% increments. (C) Boxplot of the aberrant genome in PTCL entities/subgroups. The dot plot overlay represents the aberrant genome of individual samples separated into 1% bins. (D) Relative frequency distribution of CNAs presenting at a frequency ≥25% in ≥1 PTCL entity or subgroup.
Mutational analysis of PTCL subgroups
Mutation analysis of genes within aberrant loci was performed in 31 PTCL molecular-subgroup cases and 5 PTCL-TFH cases (Figure 6A). Amplicon-sequencing data of 4 genes (CD28, DNMT3A, RHOA, and TET2) from a previous study39 were available in 9 cases. One hundred percent concordance in variant calls was observed with the custom-capture platform, demonstrating adequate coverage and robustness in variant calling.
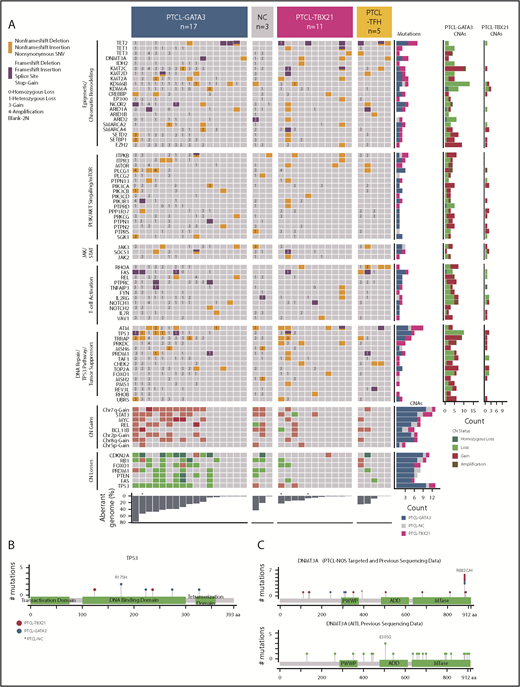
Select CNAs or genes found to be recurrently mutated in molecular PTCL subgroups. (A) The block color represents the type of mutation. Blocks with 2 colors indicate that >1 type of mutation was observed in the case. CNA status of the mutated genes are noted (3 = copy gain, 4 = amplification, 1 = copy loss, 0 = homozygous copy loss). The bar graphs to the right of the plot indicate the number of cases with the denoted mutation or CNA. The total percent aberrant genome is indicated below the plot. *Denotes 3 cases that were only included for mutation analysis, and CN status was determined by CopywriteR.61 Schematic diagrams of the location of coding mutations identified in TP53 (B) and DNMT3A (C). The DNMT3A schematic diagram combines targeted sequencing results from this study with previous amplicon sequencing data.39 The figures were generated using MutationMapper.62 MTase, methyltransferase.
Select CNAs or genes found to be recurrently mutated in molecular PTCL subgroups. (A) The block color represents the type of mutation. Blocks with 2 colors indicate that >1 type of mutation was observed in the case. CNA status of the mutated genes are noted (3 = copy gain, 4 = amplification, 1 = copy loss, 0 = homozygous copy loss). The bar graphs to the right of the plot indicate the number of cases with the denoted mutation or CNA. The total percent aberrant genome is indicated below the plot. *Denotes 3 cases that were only included for mutation analysis, and CN status was determined by CopywriteR.61 Schematic diagrams of the location of coding mutations identified in TP53 (B) and DNMT3A (C). The DNMT3A schematic diagram combines targeted sequencing results from this study with previous amplicon sequencing data.39 The figures were generated using MutationMapper.62 MTase, methyltransferase.
TP53 mutations were associated with PTCL-GATA3 (5/17) and co-occurred with CN loss (Figure 6A); thus, aberrant TP53 signaling due to mutation and CN deletion was significantly associated with PTCL-GATA3 (Fisher’s exact test, P < .001). TP53 mutations occurred in the DNA binding and tetramerization domains, including the hotspot TP53R175H (n = 2) (Figure 6B). These aberrations did not show association with mRNA expression. Other DNA repair or TP53 signaling genes (ATM and TRRAP) were mutated in both subgroups. PRDM1 mutations identified in the PTCL-GATA3 subgroup co-occurred with CN deletion. Despite recurrent deletions in other TSs (FOXO1 and PTEN), mutations were infrequent or absent; as expected, no mutation in CDKN2A was observed due to biallelic deletions. Other genes with CNAs were involved in JAK-STAT (SOCS1 and JAK3), PI3K-AKT (ITPR3 and ITPKB), and T-cell activation (PLCG1, PTPRC, FYN, and VAV1) and were mutated, with no significant difference between the subgroups (Figure 6A).
Mutations in the DNA methylation regulator TET2 were observed at near-equal frequencies in PTCL-GATA3 (4/17) and PTCL-TBX21 (3/11), but TET1, TET3, and DNMT3A mutations were enriched in PTCL-TBX21 (4/11 vs 2/17). Histone methyltransferases showed a similar mutation frequency (Figure 6A). An uncommon IDH2R172W variant was observed in 1 PTCL-TBX21 case, which harbored an RHOAG17V mutation and a DNMT3A mutation but lacked a PTCL-TFH immunophenotype upon IHC examination. Interestingly, DNMT3A mutations in PTCL-TBX21 were restricted to the MTase motif of the catalytic domain and affected DNMT3AR882 (2/2), which was also observed in our larger cohort,39 in contrast to AITL, in which only 1 of 22 cases showed DNMT3AR882 mutation (Figure 6C). PTCL-TFH cases showed a mutation profile closer to AITL cases,9,40 but without IDH2 mutation. A mutation of TET3 co-occurring with TET2 and BCL11B gain was present in 1 case; however, too few cases were studied for a definitive assessment (Figure 6A).
Discussion
Comprehensive genetic characterization of AITL and newly defined PTCL-NOS molecular subgroups validated their distinct genetic evolution and identified potential therapeutic targets. Although we used well-characterized cases supported by GEP and pathology review, there is still the possibility that the frequency of aberrations of some of the molecular entities may be underestimated due to low tumor content cases, which is commonly observed in many PTCLs. However, major CNAs in AITL were consistent with previous cytogenetic and array-comparative genomic hybridization (aCGH) studies.17,41,42 However, integrative analysis with GEP revealed that genetic changes targeted oncogenic pathways not previously identified.41-44 Comparative analysis with other major WHO-defined PTCL entities showed that AITL harbors a minimally aberrant genome. chr5 gain (43%) co-occurring with chr21 gain and IDH2R172 mutation were specifically associated with AITL. Contrary to previous studies,41,42 trisomy 3 was infrequent (1/35). This discrepancy in chr3 gain was noted in an earlier cytogenetic study (interphase 78% vs metaphase 41%)45 and also was not observed in a recent aCGH study,17 although it is possible that trisomy 3 may be present in subclones and not detected by hybridization-based platforms.44 Chr13q22 loss was observed in 14% (5/35), in agreement with previous findings,44 and it may target SLAIN1 (13q22.3), involved in microtubule reorganization. chr5 gain significantly co-occurred with chr21 gain, but the cooperative roles of these abnormalities are challenging to decipher, because they harbor epigenetic mutations and pleiotropic effects due to IDH2R172 mutation–induced increased 2-hydroxyglutarate (2-HG). 2-HG inhibits α-KG–dependent dioxygenases (eg, histone demethylases and the TET family of 5mC hydroxylases)46 and can also promote the Warburg effect by directly competing with α-KG in the tricarboxylic acid cycle, thus altering the epigenetic and metabolic programs in T cells. IDH2 mutation is associated with a more pronounced TFH signature and T-cell activation via epigenetic modification39 and tends to have a more aberrant genome compared with wild-type cases, possibly due to an inhibitory effect of 2-HG on DNA repair enzymes.47 In contrast, IDH2WT cases showed significant enrichment of PI3K-AKT activation pathways and had focal losses of negative regulators (phosphatases) of the PI3K-AKT pathway. Thus, constitutive activation of the PI3K-AKT pathway or impairment of the DNA repair pathway and disturbed metabolic pathways may be unique vulnerabilities that can be exploited in AITL, depending on the mutational status of IDH2. Wild-type cells may show a more sensitive response to PI3K-mTOR inhibitors, whereas IDH2-mutant cells may be particularly sensitive to alkylating agents,47 and PARP inhibitors may have synergistic effects.
According to the recent WHO classification of lymphoid tumors,1 PTCL-TFH is now included as a provisional entity of T-cell lymphoid neoplasms. In concordance with a previous study,17 we observed differences in the CN profiles of PTCL-TFH and AITL: specifically, chr5 gain is infrequent in PTCL-TFH, whereas loss of chr6q and chr1q gain are more common (supplemental Figure 1E). The mutation profile of PTCL-TFH identified mutations in TET2, DNMT3A, and RHOA, which are also common in AITL; however, we did not observe IDH2R172 mutations, consistent with previous reports.9,48 Although the number of PTCL-TFH cases studied to date is small, the data suggest that PTCL-TFH may be a genetically distinct entity from AITL.
We provided evidence that novel molecular subgroups8 evolve by distinct genetic pathways and are characterized by distinct genomic complexity. By GEP, PTCL-GATA3 represents a subgroup distinct from PTCL-TBX21, which may contain a noncytotoxic and a cytotoxic subgroup characterized by CD8+ T cells.8 CNAs support the GEP classification, because PTCL-GATA3 showed high genomic complexity with frequent CNAs of well-known TSs and oncogenes, some with functional consequences observed at the mRNA level and inferior survival, which are in agreement with earlier studies.8,15 A recent study demonstrated that PTCL-NOS cases classified as GATA3 expressing on a different platform trended toward poorer OS.49 In contrast, PTCL-TBX21 had low genomic complexity and did not show prominent TS deletions and mutations. TP53 signaling was a primary target in >50% of PTCL-GATA3 cases by biallelic deletion/mutation of TP53, CDKN2A/2B (p14ARF/p16INK4A), or RB1. P14ARF is a negative regulator of TP53 signaling, and p16INK4A regulates the RB-mediated G1 checkpoint. CDKN2A showed prognostic significance in PTCL-GATA3, but validation with additional cases is required. PRDM1, important in the homeostatic control of T-cell activation and proliferation, is likely the driver of del-6q21. PRDM1 loss may promote the development of PTCL-GATA3. Remarkably, del-5q was exclusive to PTCL-GATA3, whereas chr5 gain and a focal 14q32 gain encompassing BCL11B were noted more frequently in PTCL-TBX21. BCL11B is critical in T-cell differentiation at the double-negative 3/4 stage by preventing differentiation of early T cells into natural killer cells and other innate immune cell lineages, in part by repressing GATA3 expression.34 However, its role in the lymphomagenesis of PTCL-TBX21 is unclear. Genes regulating NF-κB signaling (ZC3H12DC/p3450 and TNFAIP3) and TS kinase (LATS1) were more frequently lost in PTCL-TBX21. Genomic losses observed in PTCL-TBX21 targeted genes associated with cell-mediated cytotoxicity and cellular processes involving metabolic reprogramming.51 A meta-analysis of 2 additional PTCL-NOS cohorts22,23 demonstrated that subgroup-associated CNA profiles can be validated and delineated independently, as is evident by the clustering of percent aberrant genome, specific CNA association with clinical outcome data, and/or expression of GATA3 and TBX21 target genes (CCR4 and CXCR3, respectively). Although many of the CNAs are significantly associated with a specific subgroup, as shown in Figure 5, with the exception of TP53 loss (∼50%), the majority of these CNAs do not exceed 25% to 30% and, thus, may not be usable per se as molecular subgroup classifiers; rather, they may aid in the molecular diagnosis in challenging PTCL-NOS cases.
Although MYC–CDKN2A–TP53 signaling axis deregulation is often observed in NHLs, co-occurrence of impaired TP53 signaling and PTEN loss is uncommon in neoplasms, because studies have shown that functional interdependence and mutations are often mutually exclusive.52 TP53 directly regulates PTEN mRNA expression53 and PTEN stabilizes TP53 by inhibiting MDM2 translocation to the nucleus54 and can directly bind and stabilize TP53 in the nucleus.55 TP53 and PTEN codeletions are significantly associated with PTCL-GATA3 but not with PTCL-TBX21 or other T-cell NHLs. Thus, their cooperative role in T-cell lymphomagenesis warrants further investigation. We noted mutual exclusivity of TP53 loss and TET1/2/3 mutations, suggesting that epigenetic alterations due to TET deficiency and TP53 functional impairment may lead to distinct clonal evolution.
Recently, Horwitz et al showed clinical efficacy of a PI3K-δ,γ inhibitor (duvelisib) in a phase 1 trial of PTCL-NOS patients.56 Because of the promising response in this clinical trial and preclinical models,56 it would be essential to precisely classify PTCL cases and their genomic abnormalities for correlative studies for future multi-institutional clinical trials. Many of the CNAs (deletions of PTEN, STK11, and TSC2 and/or MYC amplification) likely converge to constitutively activate PI3K–AKT–mTOR signaling.30 The mTOR pathway is critical for the integration of costimulatory, cytokine, environmental, and metabolic cues necessary for T-cell differentiation,57 T-helper cell polarization,58 and proliferation.59 TP53 negatively regulates mTOR pathways via PTEN-AKT and the TSC2-AMPK β1 axis.60 Although preliminary, we observed that mTOR signaling pathways can be a promising target for therapeutic intervention using a number of T-cell lines (supplemental Figure 6). Because these T-cell lines are not derived from AITL or PTCL-GATA3/TBX21, the findings will need to be validated and more specifically defined using authentic PTCL cell lines or xenograft models when available.
In summary, the complexity of PTCL can be addressed with greater clarity with the integration of global genomic analyses. This study provides further evidence of the existence of the 2 separate subgroups (PTCL-GATA3 and PTCL-TBX21) previously identified8 within the PTCL-NOS group, and it has identified genetic features that are distinct between the 2. AITL cases showed a CN profile different from these 2 subgroups, and the IDH2-mutated group exhibited unique features that may indicate exploitable therapeutic vulnerabilities.
Contact Javeed Iqbal (jiqbal@unmc.edu) for original data, which will be deposited into the National Center for Biotechnology Information Gene Expression Omnibus database following publication.
The data were presented in part at the 58th annual meeting of the American Society of Hematology, San Diego, CA, 5 December 2016.
The online version of this article contains a data supplement.
The publication costs of this article were defrayed in part by page charge payment. Therefore, and solely to indicate this fact, this article is hereby marked “advertisement” in accordance with 18 USC section 1734.
Acknowledgments
The authors thank the University of Nebraska Medical Center Human Genetics Laboratory at the Munroe-Meyer Institute, Tissue Science Facility, Genomic Core Facility at City of Hope, SingHealth Tissue Repository, Advanced Molecular Pathology Laboratory at SingHealth, and Duke–National University of Singapore (NUS) Genome Biology Facility. The authors also thank Francoise Berger for contribution of cases to the International Peripheral T-Cell Lymphoma Consortium.
The work was supported in part by City of Hope Lymphoma Specialized Programs of Research Excellence grant P50 CA107399 and National Institutes of Health (NIH) National Cancer Institute (NCI) grant P30 CA033572. Partial support is from NIH NCI Eppley Cancer Center Support grant P30 CA036727, NIH National Center for Research Resources grant 5P20RR016469, and NIH National Institute for General Medical Science grant 8P20GM103427 (G.B.). F.B. is supported by Oncosuisse grant KLS-02403-02-2009, Anna Lisa Stiftung, and The GELU Foundation. J.I. is supported by the Leukemia and Lymphoma Society (TRP-6129-04), NIH NCI Eppley Cancer Center Support grant P30 CA036727 and NIH NCI grants UH2 CA206127 02 and P01 CA229100 01. W.C.C. is supported by NIH NCI Strategic Partnering to Evaluate Cancer Signatures (SPECS) II 5 UO1 CA157581-01, NIH NCI Specialized Programs of Research Excellence 1P50 CA136411-01 01A1 PP-4, and City of Hope internal funds. C.K.O. is supported by Singapore Ministry of Health’s National Medical Research Council, the Tanoto Foundation, New Century International Pte. Ltd., the Ling Foundation, Singapore National Cancer Centre Research Fund, and Oncology Academic Clinical Program (ONCO-ACP) Cancer Collaborative Scheme. The University of Nebraska DNA Sequencing Core receives partial support from NIH National Center for Research Resources (1S10RR027754-01, 5P20RR016469, RR018788-08) and NIH National Institute for General Medical Science (8P20GM103427, GM103471-09).
Authorship
Contribution: T.B.H., A.B., J.Y., W.L., C.L., W.C.C., and J.I. designed and performed the research; T.B.H., A.B., W.L., Q.G., and W.Z. analyzed and/or interpreted the data; Y.L., B.J.D., and J.M.S. collected data; M.-L.N., C.A., T.C.G., J.V., D.D.W., C.W., K.F., S.T.L., C.K.O., R.D.G., E.M., F.L., C.H., S.H., M.B.P., M.A.L., R.A.W., B.T.T., N.Y., K.O., M.S., A.R., G.O., E.C., L.M.R., E.S.J., R.M.B., F.d’A., G.I., F.B., L.M.S., L.d.L., P.G., T.W.M., S.P., and W.C.C. provided materials, conducted the pathological review, and/or contributed clinical/aCGH/GEP data; and T.B.H., A.B., and J.I. wrote the manuscript.
Conflict-of-interest disclosure: The authors declare no competing financial interests.
Correspondence: Javeed Iqbal, Department of Pathology and Microbiology, University of Nebraska Medical Center, Omaha, NE 68198-6842; e-mail:jiqbal@unmc.edu; and Wing C. Chan, Department of Pathology, City of Hope National Medical Center, Duarte, CA 91010; e-mail: jochan@coh.org.
