

Key Points
Baseline platelet count, lactate dehydrogenase, and lymphodepletion regimen impact EFS in patients in MRD-negative CR after CD19 CAR T-cell.
Allogeneic HCT after CD19 CAR T-cell therapy is well tolerated and may improve EFS.

Abstract
Autologous T cells engineered to express a CD19-specific chimeric antigen receptor (CAR) have produced impressive minimal residual disease–negative (MRD-negative) complete remission (CR) rates in patients with relapsed/refractory B-cell acute lymphoblastic leukemia (B-ALL). However, the factors associated with durable remissions after CAR T-cell therapy have not been fully elucidated. We studied patients with relapsed/refractory B-ALL enrolled in a phase 1/2 clinical trial evaluating lymphodepletion chemotherapy followed by CD19 CAR T-cell therapy at our institution. Forty-five (85%) of 53 patients who received CD19 CAR T-cell therapy and were evaluable for response achieved MRD-negative CR by high-resolution flow cytometry. With a median follow-up of 30.9 months, event-free survival (EFS) and overall survival (OS) were significantly better in the patients who achieved MRD-negative CR compared with those who did not (median EFS, 7.6 vs 0.8 months; P < .0001; median OS, 20.0 vs 5.0 months; P = .014). In patients who achieved MRD-negative CR by flow cytometry, absence of the index malignant clone by IGH deep sequencing was associated with better EFS (P = .034). Stepwise multivariable modeling in patients achieving MRD-negative CR showed that lower prelymphodepletion lactate dehydrogenase concentration (hazard ratio [HR], 1.38 per 100 U/L increment increase), higher prelymphodepletion platelet count (HR, 0.74 per 50 000/μL increment increase), incorporation of fludarabine into the lymphodepletion regimen (HR, 0.25), and allogeneic hematopoietic cell transplantation (HCT) after CAR T-cell therapy (HR, 0.39) were associated with better EFS. These data allow identification of patients at higher risk of relapse after CAR T-cell immunotherapy who might benefit from consolidation strategies such as allogeneic HCT. This trial was registered at www.clinicaltrials.gov as #NCT01865617.
Introduction
Relapsed/refractory acute lymphoblastic leukemia (ALL) in adult patients is associated with a dismal outcome, with low complete remission (CR) rates and short event-free survival (EFS) after salvage chemotherapy.1-5 Phase 1/2A single-center trials in pediatric and adult patients with relapsed/refractory B-cell ALL (B-ALL) have demonstrated that lymphodepletion chemotherapy followed by infusion of autologous chimeric antigen receptor (CAR) T cells targeting CD19 produces minimal residual disease (MRD)–negative CR rates of 63% to 93%.6-12 The US Food and Drug Administration has approved a CD19-specific CAR T-cell product, tisagenlecleucel, for use in pediatric and young adult patients with relapsed/refractory B-ALL.9,13
Although the MRD-negative CR rates after CAR T-cell therapy are impressive, reports on the durability of these responses are limited. The duration of response may be affected by the in vivo kinetics of CAR T-cell expansion and persistence, which likely differ in patients treated with CD19 CAR T cells engineered with a CAR containing either a 4-1BB or CD28 costimulatory domain.14,15 A recent study that reported outcomes in adults treated with CD19 CAR T cells in which the CAR contained a CD28 costimulatory domain demonstrated that 50% of patients with MRD-negative CR relapsed after CAR T-cell infusion.10 In addition, a study in pediatric patients who received T cells engineered with a CD19 CAR incorporating a 4-1BB costimulatory domain showed that 33% of patients relapsed after achieving CR in response to CAR T-cell infusion.9 Multivariable analyses of factors that have an impact on the duration of response were not reported in either of these studies. Clinical characteristics and biomarkers that are associated with durable EFS need to be identified so that patients who are at greater risk of relapse after CD19 CAR T-cell immunotherapy can be identified and can benefit from consolidation strategies such as allogeneic hematopoietic cell transplantation (HCT) or alternative approaches such as bispecific CAR T-cell immunotherapy.16
We have previously reported a high rate of MRD-negative CR (93%) in adult patients with relapsed/refractory B-ALL treated with lymphodepletion chemotherapy followed by infusion of CD19 CAR T cells with a 4-1BB costimulatory domain formulated in a defined CD4:CD8 1:1 ratio.6 Here, we report the long-term follow-up of adult B-ALL patients treated with CD19 CAR T cells and analysis of factors associated with durable EFS.
Patients and methods
Patient and treatment characteristics
Factors that have an impact on antitumor response and EFS were evaluated in adults (age 18 years or older) with relapsed/refractory B-ALL enrolled in a phase 1/2 clinical trial at our institution that evaluated lymphodepletion chemotherapy followed by infusion of CD19 CAR T cells. The design of the CAR transgene and CAR T-cell manufacturing from CD4+ T cells and either bulk or central memory–enriched CD8+ T cells has been previously described.6 The CAR was composed of a CD19-targeting single-chain variable fragment (scFv) derived from the FMC63 monoclonal antibody fused to an immunoglobulin-G4 (IgG4) hinge region, CD28 transmembrane domain, 4-1BB costimulatory domain, and a CD3ζ signaling sequence. The CAR was separated by a T2A ribosomal skip sequence from a truncated human epidermal growth factor receptor (EGFRt), which allowed precise enumeration of transduced CAR T cells by flow cytometry.17
Patients in the clinical trial were eligible for analysis of factors that had an impact on response and EFS if they had leukemia in the marrow identified by flow cytometry and/or extramedullary disease before CAR T-cell infusion and had received CAR T cells at or below the previously determined maximum tolerated dose of 2 × 10⁶ CAR T cells per kg. Patients received lymphodepletion chemotherapy consisting of a cyclophosphamide-based regimen with or without fludarabine (supplemental Table 1 available on the Blood Web site) followed 2 to 4 days later by infusion of CD19 CAR T cells formulated in a 1:1 ratio of CD4+:CD8+ CAR T cells and infused at 1 of 2 dose levels (DLs; DL1, 2 × 10⁵ CAR T cells per kg; DL2, 2 × 10⁶ CAR T cells per kg). The defined 1:1 ratio of CD4+:CD8+ CAR T cells for infusion was selected to improve uniformity and maximize potency of the infused product on the basis of preclinical studies.18 All patients were treated at least 12 months before the data cutoff in April 2018. The study was conducted according to the principles of the Declaration of Helsinki and with approval of the Fred Hutchinson Cancer Research Center Institutional Review Board.
Evaluation of antitumor response and toxicity
Antitumor response was initially evaluated in all patients 3 to 4 weeks after CAR T-cell infusion with high-resolution multiparameter flow cytometry (sensitivity 1:10 000) of a bone marrow aspirate and biopsy.19 Patients with extramedullary disease before CAR T-cell therapy were also assessed by positron emission tomography-computed tomography. Patients with central nervous system (CNS) leukemia identified before treatment underwent cerebral spinal fluid sampling for detection of disease by flow cytometry after CAR T-cell immunotherapy. MRD-negative CR was defined as the absence of leukemic blasts in the bone marrow by high-resolution flow cytometry and no evidence of extramedullary or CNS leukemia. Patients who had an index clone identified by high-throughput sequencing (HTS) of IGH, IGK, TRB, TRD, and/or TRG genes before CAR T-cell therapy and achieved MRD-negative CR by flow cytometry had HTS performed on the marrow sample obtained at restaging to detect any residual leukemic index clone (Adaptive Biotechnologies, Inc.). Cytokine release syndrome (CRS) was graded according to consensus criteria reported by Lee et al.20,21 Neurotoxicity was graded separately according to Common Terminology Criteria for Adverse Events v4.03, with modifications as previously described.22
Evaluation of CAR T-cell counts in blood and cytokine concentrations in serum
Blood was collected before lymphodepletion, on day 0 before CAR T-cell infusion, and at intervals after CAR T-cell infusion. Absolute CD4+ and CD8+ CAR T-cell counts were determined by multiplying the percentages of CD3+CD4+CD8–EGFRt+ and CD3+CD4–CD8+EGFRt+ events, respectively, in a viable CD45+ lymphocyte forward scatter or side scatter gate by an absolute lymphocyte count performed on the same day. CAR T cells in the blood were also monitored by quantitative polymerase chain reaction (qPCR) to detect integrated sequence (FlapEF1α) and reported as the number of transgene copies per μg of DNA. The lower limit of quantitation of the qPCR assay was 10 transgene copies per μg of DNA. Serum cytokine concentrations were evaluated by Luminex assay according to the manufacturer’s instructions. The area under the curve (AUC) of CAR T-cell counts (cells per μL or transgene copies per μg of DNA) and cytokine concentrations (pg/mL) between different time points were calculated using a trapezoidal rule computational algorithm.23
Statistical analyses
For analysis of EFS, an event was defined as no response, relapse, or death. Death was the event for analysis of overall survival (OS). Patients who did not have an event were censored at the date of last follow-up. Data were not censored when new therapy (including allogeneic HCT) was initiated in the absence of disease. Kaplan-Meier curves for EFS and OS were created, and patients in different subgroups were compared by using the log-rank test.24,25 Median follow-up was estimated by reverse Kaplan-Meier analysis.26 Univariable logistic regression analyses were performed to identify variables associated with the development of MRD-negative CR. Cox regression univariable and stepwise multivariable modeling were performed to identify factors associated with EFS. CAR T-cell kinetics were analyzed using LOESS (local polynomial regression) curve fitting.27 Data were analyzed using R (version 3.4.1) and RStudio (version 1.0.153), and figures were formatted using Adobe Illustrator CS6 (version 16.0.0).
Results
Patient characteristics
From August 2013 to April 2017, 59 patients with relapsed/refractory B-ALL underwent leukapheresis for CD19 CAR T-cell manufacturing. Two patients did not meet study-defined criteria for treatment after undergoing leukapheresis, and 4 additional patients who received lymphodepletion chemotherapy and CD19 CAR T cells were ineligible for the analyses in this report (supplemental Figure 1). Among the 53 patients in the analysis of factors that had an impact on response and EFS, the median time from leukapheresis to CAR T-cell infusion was 19 days (range, 10-466 days). Fourteen (26%) of 53 patients received systemic bridging chemotherapy between leukapheresis and lymphodepletion to control disease progression.
The median age was 39 years (range, 20-76 years), and the patients had received a median of 3 (range, 1-11) prior therapies (Table 1). Twenty-three patients (43%) had previously undergone allogeneic HCT. Eleven patients (21%) had Philadelphia chromosome–positive (Ph+) BCR-ABL, including 1 patient who initially had BCR-ABL–negative disease but had t(9;22) identified at staging before CAR T-cell therapy. Patients with a history of Ph+ B-ALL had previous exposure to a median of 2 (range, 1-4) different tyrosine kinase inhibitors. Seven patients (13%) harbored an MLL gene rearrangement, and 17 (32%) had a complex karyotype.28 Before lymphodepletion, 34 patients (64%) had morphologic disease (≥5% blasts) in the bone marrow, of whom 13 also had extramedullary disease. Seventeen patients (32%) had MRD (<5% blasts) in the bone marrow detected by high-resolution flow cytometry, and 3 of these also had extramedullary disease. Two patients had extramedullary disease without bone marrow involvement. Sites of extramedullary involvement are detailed in supplemental Table 2. Leukemic blasts were detected by flow cytometry in the cerebrospinal fluid of 5 patients. CD19 CAR T cells were manufactured to the target total cell dose for all patients. Forty patients (75%) developed CRS after CAR T-cell infusion, including 10 (19%) with grade ≥3 CRS. Grade ≥3 neurotoxicity developed in 12 patients (23%).
Patient and treatment characteristics
| Characteristic | MRD-negative CR | No response | All patients |
|---|---|---|---|
| Evaluable patients, n | 45 | 8 | 53 |
| Age, y | |||
| Median (IQR) | 39.0 (28.0-53.0) | 42.5 (30.5-54.5) | 39.0 (28.0-54.0) |
| Range | 20-76 | 22-66 | 20-76 |
| Sex, n (%) | |||
| Female | 23 (51) | 0 (0) | 23 (43) |
| Male | 22 (49) | 8 (100) | 30 (57) |
| ECOG PS, n (%) | |||
| 0 | 22 (49) | 4 (50) | 26 (49) |
| 1 | 22 (49) | 4 (50) | 26 (49) |
| 2 | 1 (2) | 0 (0) | 1 (2) |
| High-risk cytogenetics, n (%)* | |||
| t(9;22) BCR-ABL, Ph+ | 9 (20) | 2 (25) | 11 (21) |
| t(v;11) MLL rearrangement | 7 (13) | 0 (0) | 7 (13) |
| Low hypodiploidy (30-39 chromosomes) | 3 (6) | 0 (0) | 3 (6) |
| Near triploidy (60-78 chromosomes) | 2 (4) | 0 (0) | 2 (4) |
| iAMP21 | 0 (0) | 1 (13) | 1 (2) |
| Complex karyotype (≥5 abnormalities) | 14 (31) | 3 (38) | 17 (32) |
| Prior regimens, n | |||
| Median (IQR) | 3 (3-4) | 3.5 (2.5-6) | 3 (3-4) |
| Range | 1-11 | 1-7 | 1-11 |
| Prior allogeneic HCT, n (%) | |||
| Yes | 18 (40) | 5 (62) | 23 (43) |
| No | 27 (60) | 3 (38) | 30 (57) |
| Prior blinatumomab therapy, n (%) | |||
| Yes | 9 (20) | 1 (13) | 10 (19) |
| No | 36 (80) | 7 (87) | 43 (81) |
| Marrow disease burden by flow cytometry, % | |||
| Median (IQR) | 28 (0.65-74.7) | 22.9 (1.55-81.1) | 28 (1.10-79.0) |
| Range | 0.0-97.6 | 0.3-98.5 | 0.0-98.5 |
| ≥5% blasts with extramedullary disease, n (%) | 9 (20) | 4 (50) | 13 (25) |
| ≥5% blasts without extramedullary disease, n (%) | 20 (44) | 1 (13) | 21 (40) |
| <5% blasts with extramedullary disease, n (%) | 5 (11) | 0 (0) | 5 (9) |
| <5% blasts without extramedullary disease, n (%) | 11 (24) | 3 (37) | 14 (26) |
| Extramedullary disease, n (%) | |||
| Yes | 14 (31) | 4 (50) | 18 (34) |
| No | 31 (69) | 4 (50) | 35 (66) |
| CNS leukemic involvement, n (%) | |||
| Yes | 2 (4) | 3 (38) | 5 (9) |
| No | 43 (96) | 5 (62) | 48 (91) |
| Lymphodepletion, n (%) | |||
| Cyclophosphamide-based with fludarabine | 35 (78) | 7 (87) | 42 (79) |
| Cyclophosphamide-based without fludarabine | 10 (22) | 1 (13) | 11 (21) |
| Dose of CAR T cells per kg, n (%) | |||
| 2 × 10⁵ cells | 26 (58) | 7 (87) | 33 (62) |
| 2 × 10⁶ cells | 19 (42) | 1 (13) | 20 (38) |
AUC28, area under the curve from day 0 to day 28; ECOG PS, Eastern Cooperative Oncology Group performance status; iAMP21, intrachromosomal amplification of a region of chromosome 21; IQR, interquartile range .
From cytogenetic analysis performed at any time after diagnosis; some patients had >1 abnormalities identified.
EFS and OS are more durable in patients achieving MRD-negative CR
Forty-five (85%) of the 53 patients achieved MRD-negative CR by high-resolution flow cytometry, whereas 8 patients (15%) had no response. With a median follow-up of 30.9 months, EFS and OS were better in patients who achieved MRD-negative CR compared with those who did not respond (median EFS, 7.6 vs 0.8 months; P < .0001; median OS, 20.0 vs 5.0 months; P = .014; Figure 1A-B). In patients who had an identified leukemic clone by HTS before CAR T-cell immunotherapy and subsequently achieved MRD-negative CR by flow cytometry after treatment with CAR T cells (n = 28), absence of the leukemic clone by HTS in marrow 3 weeks after CAR T-cell infusion (n = 20) was associated with better EFS (median EFS, 8.4 vs 3.6 months; P = .036) and a trend toward improved OS (median OS, 26.9 vs 6.8 months; P = .14) compared with those who achieved MRD-negative CR by flow cytometry with a persistent leukemic sequence in the marrow (n = 8; Figure 1C-D). Patients who had a persistent leukemic clone at 3 weeks after CAR T-cell infusion had better EFS but similar OS compared with those who had detectable disease by flow cytometry after CAR T-cell therapy (supplemental Figure 2).
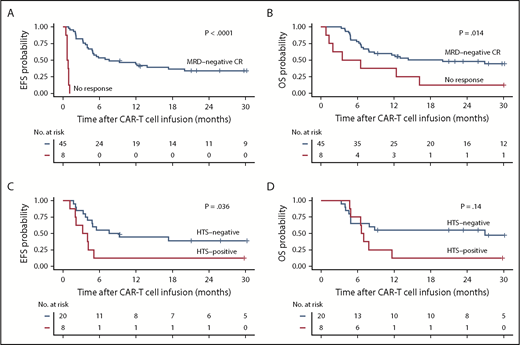
EFS and OS in B-cell ALL patients after CD19 CAR T-cell therapy. (A-B) Kaplan-Meier analyses demonstrating better EFS and OS in patients who achieve MRD-negative CR by high-resolution flow cytometry on restaging (black line, n = 45) compared with patients who do not respond (red line, n = 8; P < .0001 and P = .014, respectively; log-rank test). (C-D) In the MRD-negative CR patients who had a leukemic clone detected by HTS (n = 28) before CD19 CAR T cells, absence of the leukemic clone (black line, n = 20) after CAR T cells was associated with significantly better EFS (P = .036) and a trend toward better OS (log-rank test P = .14) compared with those with a persistent leukemic clone (red line, n = 8).
EFS and OS in B-cell ALL patients after CD19 CAR T-cell therapy. (A-B) Kaplan-Meier analyses demonstrating better EFS and OS in patients who achieve MRD-negative CR by high-resolution flow cytometry on restaging (black line, n = 45) compared with patients who do not respond (red line, n = 8; P < .0001 and P = .014, respectively; log-rank test). (C-D) In the MRD-negative CR patients who had a leukemic clone detected by HTS (n = 28) before CD19 CAR T cells, absence of the leukemic clone (black line, n = 20) after CAR T cells was associated with significantly better EFS (P = .036) and a trend toward better OS (log-rank test P = .14) compared with those with a persistent leukemic clone (red line, n = 8).
Given the substantial EFS and OS benefit from achieving MRD-negative CR, we were interested in identifying factors associated with the probability of this outcome. Because of the low number of patients who did not respond to treatment (n = 8), multivariable modeling of factors was not feasible; therefore, we performed univariable logistic regression analyses (supplemental Table 3). Robust CAR T-cell expansion was strongly associated with the probability of achieving MRD-negative CR. For each log10 increment in the integrated transgene copies per μg of DNA detected at the peak after CAR T-cell infusion or evaluated as the AUC from day 0 to day 28 (AUC28), the odds ratios of achieving MRD-negative CR were 7.47 and 17.41, respectively (Figure 2A-C). CNS leukemia before lymphodepletion was associated with no response to treatment (odds ratio, 0.08; P = .013). In patients with CNS leukemia who did not respond (n = 3), leukemic blasts were detected in the marrow at restaging. The 2 patients with active CNS leukemia before lymphodepletion who achieved MRD-negative CR relapsed at days 122 and 420 after CAR T-cell infusion.
![Figure 2. Impact of CAR T-cell in vivo expansion kinetics on achievement of MRD-negative CR. (A) CAR T-cell counts in the blood over the first 90 days after CAR T-cell infusion for patients who achieved MRD-negative CR (blue lines) compared with patients who did not respond (red lines). Each thin line represents a single patient; bold lines represent LOESS (local polynomial regression) curve fitting data approximation with the standard error shown in gray; data were censored at the time of a subsequent CAR T-cell infusion. The dashed horizontal line indicates the limit of quantitation of the qPCR assay. Patients who achieved MRD-negative CR (blue) had a higher mean peak (P = .0002 [B]) and AUC from day 0 to day 28 (AUC28; P < .0001 [C]) of CAR T cells compared with those who did not respond (red). CAR T-cell counts in the blood were measured by qPCR for FlapEF1α transgene copies per μg of DNA in all patients (n = 53).](https://ash.silverchair-cdn.com/ash/content_public/journal/blood/133/15/10.1182_blood-2018-11-883710/3/m_blood883710f2.png?Expires=1769079519&Signature=eVgTUn~HCQteYLXWKf~RCSvdBH7PfocLkexFFvs~d1RvVYSfsJd5PyRGrdy5fNnZEXxV0VMo0xPPAFY1q-hX8DZMDY~JPGbt1jDFS0iL9o8jzUML~HBYrv32R3KUwGqKdNWkGfv51HDGKTwQdtxvp5SorMH5h53S18SsBf5WeN3EZ-8qYYVhW-P9vPY7Tsj2tbIxJZrOimGeGjWyC5aWzLilQJLyAegfS~aT5U00VadPl7CnfBJz0CRI41VF6uf86YXkzuG00mSsu-1WqdDSR5xlXsqUeVNuGtd1l~li4w40q4kpHKUSkSfvVuvFjvQNts4ZSr3h3OUFc2B~X9ECFA__&Key-Pair-Id=APKAIE5G5CRDK6RD3PGA)
Impact of CAR T-cell in vivo expansion kinetics on achievement of MRD-negative CR. (A) CAR T-cell counts in the blood over the first 90 days after CAR T-cell infusion for patients who achieved MRD-negative CR (blue lines) compared with patients who did not respond (red lines). Each thin line represents a single patient; bold lines represent LOESS (local polynomial regression) curve fitting data approximation with the standard error shown in gray; data were censored at the time of a subsequent CAR T-cell infusion. The dashed horizontal line indicates the limit of quantitation of the qPCR assay. Patients who achieved MRD-negative CR (blue) had a higher mean peak (P = .0002 [B]) and AUC from day 0 to day 28 (AUC28; P < .0001 [C]) of CAR T cells compared with those who did not respond (red). CAR T-cell counts in the blood were measured by qPCR for FlapEF1α transgene copies per μg of DNA in all patients (n = 53).
Impact of CAR T-cell in vivo expansion kinetics on achievement of MRD-negative CR. (A) CAR T-cell counts in the blood over the first 90 days after CAR T-cell infusion for patients who achieved MRD-negative CR (blue lines) compared with patients who did not respond (red lines). Each thin line represents a single patient; bold lines represent LOESS (local polynomial regression) curve fitting data approximation with the standard error shown in gray; data were censored at the time of a subsequent CAR T-cell infusion. The dashed horizontal line indicates the limit of quantitation of the qPCR assay. Patients who achieved MRD-negative CR (blue) had a higher mean peak (P = .0002 [B]) and AUC from day 0 to day 28 (AUC28; P < .0001 [C]) of CAR T cells compared with those who did not respond (red). CAR T-cell counts in the blood were measured by qPCR for FlapEF1α transgene copies per μg of DNA in all patients (n = 53).
Baseline and treatment-related factors associated with durable EFS in patients who achieved MRD-negative CR
We initially performed univariable Cox regression analyses to identify baseline and therapy-related factors that were associated with better EFS in patients who achieved MRD-negative CR and could be included in subsequent multivariable analyses. Univariable analyses demonstrated better EFS in patients with lymphodepletion that incorporated fludarabine (P = .003), a lower prelymphodepletion lactate dehydrogenase (LDH) concentration (P < .0001), a higher prelymphodepletion platelet count (P = .0002), no evidence of extramedullary disease (P = .001) or high-risk cytogenetics (P = .03), lower marrow blast percentage (P = .006), no systemic bridging therapy between leukapheresis and CAR T-cell infusion (P < .0001), and changes in distinct serum cytokine concentrations during therapy (Table 2). Age, performance status, the number of previous regimens, previous blinatumomab therapy, and a history of previous allogeneic HCT were not associated with the duration of EFS.
Univariable and multivariable analyses for factors that had in impact on EFS in patients who achieved MRD-negative CR
| Variable | Univariable analysis | P | Multivariable analysis | P | ||
|---|---|---|---|---|---|---|
| HR | 95% CI | HR | 95% CI | |||
| LDH (per 100 U/L, prelymphodepletion) | 1.49 | 1.22-1.80 | <.0001 | 1.39 | 1.12-1.74 | .003 |
| Bridging systemic therapy* | 5.66 | 2.56-12.5 | <.0001 | —† | — | |
| Platelet count (per 50 000/μL, prelymphodepletion) | 0.57 | 0.42-0.76 | .0002 | 0.65 | 0.47-0.88 | .006 |
| Extramedullary disease | 3.57 | 1.66-7.65 | .001 | — | — | |
| Fludarabine added to lymphodepletion | 0.30 | 0.13-0.66 | .003 | 0.34 | 0.15-0.78 | .011 |
| IL-6 (pg/mL, prelymphodepletion) | 1.02 | 1.01-1.03 | .005 | — | — | |
| Marrow blasts by flow cytometry, % | 1.01 | 1.00-1.03 | .006 | — | — | |
| High-risk cytogenetics‡ | 2.48 | 1.12-5.50 | .03 | — | — | |
| Neutrophil count (1000/μL, prelymphodepletion) | 0.73 | 0.55-0.97 | .03 | — | — | |
| Soluble TNFRp55 (day 0), pg/mL | 4.84 | 1.07-21.8 | .04 | —§ | — | |
| IL-2 (day 0), pg/mL | 3.24 | 1.05-10.0 | .04 | — | — | |
| IL-8 (pg/mL, prelymphodepletion) | 1.78 | 1.00-3.15 | .05 | — | — | |
| Soluble TIM-3 (ng/mL; prelymphodepletion) | 1.05 | 1.00-1.11 | .06 | — | — | |
| Dose level (2 × 10⁵ vs 2 × 10⁶ CAR T cells per kg) | 0.51 | 0.24-1.11 | .09 | — | — | |
| No. of previous regimens | 1.13 | 0.97-1.32 | .1 | — | — | |
| Previous allogeneic HCT | 1.65 | 0.79-3.44 | .2 | — | — | |
| Previous blinatumomab therapy | 1.27 | 0.52-3.12 | .6 | |||
| ECOG PS | 1.18 | 0.62-2.26 | .6 | — | — | |
| Age, y | 1.00 | 0.98-1.01 | .7 | — | — | |
| Time from leukapheresis to lymphodepletion, d | 1.52 | 0.64-3.62 | .3 | |||
| CD4+:CD8+ CAR T-cell ratio (peak expansion) | 1.20 | 0.86-1.68 | .3 | |||
| CD4+:CD8+ CAR T-cell ratio (AUC from day 0 to day 28) | 1.09 | 0.76-1.55 | .6 | |||
| CD4+:CD8+ CAR T-cell ratio (fold change from infusion product to peak expansion) | 1.21 | 0.81-1.81 | .4 | |||
| CAR T-cell counts (transgene log10 copies/μg of DNA; AUC28) | 0.98 | 0.56-1.71 | .9 | — | — | |
IL-6, interleukin-6.
Between leukapheresis and CAR T-cell infusion.
Correlated strongly with LDH (P < .01) and platelet count (P = .02); therefore, it was not included in the multivariable model.
Defined as having 1 or more of the following: t(9;22) Ph+BCR-ABL t(v;11) MLL rearrangement, low hypodiploidy, near triploidy, iAMP21, or complex karyotype with ≥5 abnormalities.
Correlated strongly with platelet count; therefore, it was not included in the multivariable model.
We then performed Cox regression multivariable modeling using a stepwise approach with the identified variables that had P ≤ .05 from univariable analyses as well as clinical factors that could have an impact on survival, such as age, performance status, the number of previous regimens, a history of previous allogeneic HCT, and the peak CAR T-cell counts in the blood by qPCR. This multivariable model showed that a lower prelymphodepletion LDH (hazard ratio [HR], 1.39; 95% confidence interval [CI], 1.12-1.74 per 100 U/L increment; P = .003), a higher prelymphodepletion platelet count (HR, 0.65; 95% CI, 0.47-0.88 per 50 000 cells per μL increment increase; P = .006), and incorporation of fludarabine into the lymphodepletion regimen (HR, 0.34; 95% CI, 0.15-0.78; P = .011) were independently associated with better EFS (Table 2). When HTS status on restaging after CAR T-cell therapy was treated as an additional variable in patients who were evaluable by this method (n = 28), the 3 variables identified in the model retained their prognostic value (supplemental Table 4). In addition, the presence of a leukemic clone detected by HTS was associated with shorter EFS (HR, 5.56; P = .004).
The effects of prelymphodepletion LDH concentration and platelet count on EFS were continuous within both the normal and abnormal ranges of each parameter (Figure 3A-B). We considered that the prelymphodepletion LDH concentration and platelet count could reflect marrow disease burden. Although the percentage of marrow blasts was not selected in the multivariable model, marrow disease burden correlated with higher prelymphodepletion LDH and lower platelet count (supplemental Figure 3A). A requirement for bridging systemic therapy between leukapheresis and lymphodepletion was also associated with higher prelymphodepletion LDH concentration (P = .002) and lower platelet count (P = .007, Wilcoxon rank sum test; supplemental Figure 3B). Patients with extramedullary disease tended to have a lower platelet count (P = .08; supplemental Figure 3C), whereas high-risk cytogenetics correlated with a high LDH concentration (P = .007). These correlations suggest that the prelymphodepletion LDH concentration and platelet count reflected an aggressive tempo and increased bulk of disease that required bridging therapy.
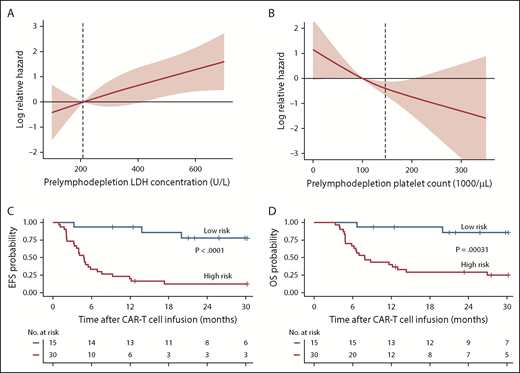
Effect of factors associated with better EFS in multivariable model. (A-B) Log relative hazard effect relationship with the prelymphodepletion serum LDH concentration and platelet count, demonstrating increasing relative hazard with higher LDH or lower platelet count, respectively. The standard error is shown in pink; dashed line indicates the upper limit of normal of LDH concentration and lower limit of normal of platelet count. (C-D) Kaplan-Meier analyses demonstrate better EFS and OS in patients with low-risk characteristics (receiving fludarabine-containing lymphodepletion with a prelymphodepletion LDH concentration in the normal range, and platelet count >100 000/μL) identified by stepwise multivariable modeling (blue line) compared with those with high-risk characteristics (red line).
Effect of factors associated with better EFS in multivariable model. (A-B) Log relative hazard effect relationship with the prelymphodepletion serum LDH concentration and platelet count, demonstrating increasing relative hazard with higher LDH or lower platelet count, respectively. The standard error is shown in pink; dashed line indicates the upper limit of normal of LDH concentration and lower limit of normal of platelet count. (C-D) Kaplan-Meier analyses demonstrate better EFS and OS in patients with low-risk characteristics (receiving fludarabine-containing lymphodepletion with a prelymphodepletion LDH concentration in the normal range, and platelet count >100 000/μL) identified by stepwise multivariable modeling (blue line) compared with those with high-risk characteristics (red line).
On the basis of the factors in the multivariable model that were independently associated with EFS, we were able to identify a subset of MRD-negative CR patients with longer EFS after CD19 CAR T-cell therapy. Patients in MRD-negative CR with a normal prelymphodepletion LDH concentration (≤210 U/L) and a platelet count ≥100 000/μL who then received cyclophosphamide and fludarabine lymphodepletion had Kaplan-Meier 2-year probabilities of EFS and OS of 78% and 86%, respectively (Figure 3C-D; supplemental Figure 4). High-risk patients without all 3 good-risk characteristics had poor outcomes, with 2-year EFS and OS of only 13% and 29%, respectively.
CAR T-cell kinetics indicate distinct mechanisms of CD19+ and CD19– relapse
Twenty-two (49%) of the 45 patients who achieved MRD-negative CR relapsed at a median of 3.5 months (range, 1.1-17.0 months) after CAR T-cell infusion. The majority of relapses (73%) occurred within the first 6 months after CAR T-cell infusion. Fourteen (68%) of 22 relapsing patients had CD19+ blasts at relapse, and in 5 of these patients, the leukemic blasts had diminished expression of CD19. Six (27%) of the 22 patients relapsed with CD19– disease, including 1 patient with MLL-rearranged B-ALL who relapsed with a phenotypic switch to acute myeloid leukemia29 ; CD19 expression at relapse was not available for 2 patients. The 2-year cumulative incidence of relapse (CIR) was 34% for CD19+ and 14% for CD19– relapse (P = .06; Figure 4A). No difference in the timing of CD19+ relapse compared with CD19– relapse was observed (median time to relapse, CD19+ vs CD19–, 147 vs 82 days; P = .18). All patients who had a subset of CD19– leukemic blasts identified in marrow before lymphodepletion using a Clinical Laboratory Improvement Amendments (CLIA)–certified assay (range, 0.4%-40.7% of the total blasts; n = 8) achieved MRD-negative CR and none developed CD19– relapse (2 of 8 had CD19+ relapse), indicating that the presence of CD19– blasts before CAR T-cell therapy did not preclude MRD-negative CR after treatment with CD19 CAR T cells or predict the phenotype of subsequent relapse.
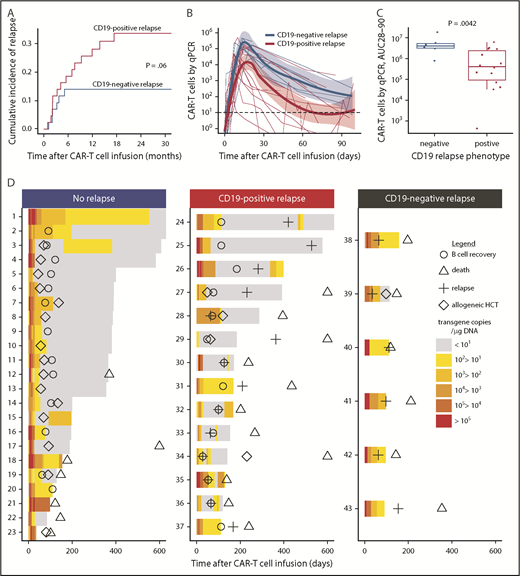
Relapse after treatment with CD19 CAR T cells. (A) Cumulative incidence of CD19+ (red line) and CD19– (blue line) relapse after CD19 CAR T-cell therapy. (B-C) Patients who subsequently developed CD19+ relapse had a lower peak (4.34 vs 5.18 log10 transgene copies per μg of DNA; P = .034) and AUC from day 28 to day 90 (AUC28-90; 5.47 vs 6.60 log10 transgene copies per μg of DNA; P = .0042) of CAR T cells in the blood compared with those who developed CD19– relapse. (B) Each thin line represents a single patient; the bold lines represent the averaged data using LOESS curve fitting approximation with the standard error shown in pink and light blue. (D) Swimmer plots demonstrating CAR T-cell counts in the blood from day 0 to day 600 in patients who either did not relapse (left) or who relapsed with CD19+ (center) or CD19– (right) disease. The timing of B-cell recovery (Ο), relapse (+), allogeneic HCT (⋄), and death (Δ) are shown. Patients 17, 27, 29, and 34 died on days 608, 818, 1079, and 1174, respectively. All patients who developed CD19– relapse (right panel) had detectable levels of CAR T cells in the blood at the last time point before relapse and ongoing B-cell aplasia. CAR T-cell counts in the blood were measured by qPCR to detect FlapEF1α and are reported as transgene copies per μg of DNA in the color-coded legend. Patients 24, 25, 26, 28, 30, 32, 33, 34, 35, and 36 received a second infusion of CAR T cells after relapse.
Relapse after treatment with CD19 CAR T cells. (A) Cumulative incidence of CD19+ (red line) and CD19– (blue line) relapse after CD19 CAR T-cell therapy. (B-C) Patients who subsequently developed CD19+ relapse had a lower peak (4.34 vs 5.18 log10 transgene copies per μg of DNA; P = .034) and AUC from day 28 to day 90 (AUC28-90; 5.47 vs 6.60 log10 transgene copies per μg of DNA; P = .0042) of CAR T cells in the blood compared with those who developed CD19– relapse. (B) Each thin line represents a single patient; the bold lines represent the averaged data using LOESS curve fitting approximation with the standard error shown in pink and light blue. (D) Swimmer plots demonstrating CAR T-cell counts in the blood from day 0 to day 600 in patients who either did not relapse (left) or who relapsed with CD19+ (center) or CD19– (right) disease. The timing of B-cell recovery (Ο), relapse (+), allogeneic HCT (⋄), and death (Δ) are shown. Patients 17, 27, 29, and 34 died on days 608, 818, 1079, and 1174, respectively. All patients who developed CD19– relapse (right panel) had detectable levels of CAR T cells in the blood at the last time point before relapse and ongoing B-cell aplasia. CAR T-cell counts in the blood were measured by qPCR to detect FlapEF1α and are reported as transgene copies per μg of DNA in the color-coded legend. Patients 24, 25, 26, 28, 30, 32, 33, 34, 35, and 36 received a second infusion of CAR T cells after relapse.
The prelymphodepletion LDH concentration and platelet count were not significantly different between patients with CD19– or CD19+ relapse. We then investigated the impact of the lymphodepletion regimen on the phenotype at relapse and found that, with the exception of the patient who relapsed with acute myeloid leukemia, all CD19– relapses occurred in patients who received fludarabine-containing lymphodepletion. Furthermore, all relapses in patients who did not receive fludarabine were CD19+. Fludarabine-containing lymphodepletion was associated with a higher CAR T-cell AUC from day 28 to day 90 (AUC28-90; 6.0 vs 5.3 CAR T-cell transgene copies log10/μg DNA; P = .03; supplemental Figure 5), suggesting that the magnitude of CAR T-cell expansion or persistence might influence the relapse phenotype. Patients who subsequently developed CD19+ relapse had a lower CAR T-cell peak (4.34 vs 5.18 log10 CAR T-cell transgene copies per μg of DNA; P = .034) and AUC of 28 to 90 (5.47 vs 6.60 log10 CAR T-cell transgene copies per μg of DNA; P = .0042) in blood compared with those with CD19– relapse (Figure 4B-C). B-cell aplasia was ongoing, and CAR T cells were detected at high levels (median, 304; range, 37-15 584 transgene copies per μg of DNA) in the last blood sample from all patients before CD19– relapse. In contrast, B-cell recovery (>0.01% of the leukocytes in the blood or bone marrow) was observed at a median of 89 days (range, 28-184 days) after CAR T-cell infusion in all patients with CD19+ relapse, and a majority (86%) had either undetectable or low (<30 copies per μg of DNA) CAR T-cell counts before or at the time of relapse (Figure 4D). The data show that, in most cases, CD19+ relapse is associated with loss of CAR T-cell persistence, whereas CD19– relapse is observed despite persistent CAR T cells and ongoing B-cell aplasia.
Allogeneic HCT after CD19 CAR T-cell therapy is associated with better EFS
The standard of care for most patients with relapsed or refractory ALL is to receive allogeneic HCT after achieving remission; however, the role of allogeneic HCT after CD19 CAR T-cell therapy has not been determined. Eighteen (40%) of 45 patients in MRD-negative CR underwent HCT at a median of 70 days (range, 44-138 days) after CAR T-cell infusion (supplemental Table 5). The median age of patients who proceeded to allogeneic HCT was 35 years (range, 22-73 years). Patients who proceeded to HCT while in MRD-negative CR had lower disease burden before CAR T-cell therapy and were less likely to have received previous allogeneic HCT compared with those who did not proceed to HCT. Twelve patients received myeloablative conditioning, whereas 6 received a reduced-intensity or nonmyeloablative regimen. The most common graft source was a matched unrelated donor (n = 8) followed by double umbilical cord blood (n = 5), a matched related donor (n = 4), and 1 mismatched unrelated donor (B-allele).
With a median follow-up of 28.4 months after allogeneic HCT, the 2-year Kaplan-Meier point estimates of EFS and OS were 61% and 72%, respectively (Figure 5A-B). The 2-year CIR was 17% (all with CD19+ disease at relapse) and nonrelapse mortality (NRM) was 23% (Figure 5C). NRM (n = 4) was attributed to invasive fungal infection (Aspergillus pneumonia), idiopathic acute respiratory distress syndrome, hepatic failure secondary to adenovirus infection, and graft-versus-host disease (GVHD). Thirteen patients (72%) developed grade 2 to 4 acute GVHD at a median of 35 days (range, 10-78 days) after allogeneic HCT, including 3 (17%) with grade 3 to 4 GVHD. There was no correlation between the incidence and/or severity of CRS and the subsequent incidence and/or severity of acute GVHD. CAR T-cell persistence immediately before conditioning did not seem to have an impact on acute GVHD incidence or severity. Chronic GVHD occurred in 8 patients (44%) a median of 245 days (range, 135-712 days) after allogeneic HCT.
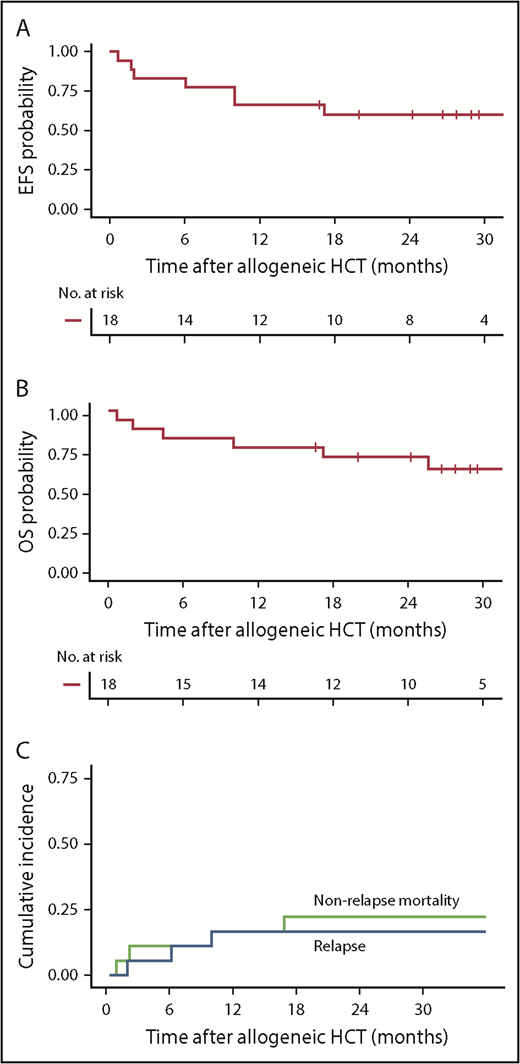
Outcomes after allogeneic HCT after CD19 CAR T-cell therapy. (A-B) Kaplan-Meier analyses demonstrating EFS and OS in patients who received allogeneic HCT while in MRD-negative CR after CD19 CAR T-cell therapy (n = 18). Two-year Kaplan-Meier point estimates of EFS and OS were 61% and 72%, respectively. (C) Cumulative incidence of relapse (blue line) and NRM (green line), with 2-year estimates of 17% and 23%, respectively. Day 0 was defined as the date of allogeneic HCT.
Outcomes after allogeneic HCT after CD19 CAR T-cell therapy. (A-B) Kaplan-Meier analyses demonstrating EFS and OS in patients who received allogeneic HCT while in MRD-negative CR after CD19 CAR T-cell therapy (n = 18). Two-year Kaplan-Meier point estimates of EFS and OS were 61% and 72%, respectively. (C) Cumulative incidence of relapse (blue line) and NRM (green line), with 2-year estimates of 17% and 23%, respectively. Day 0 was defined as the date of allogeneic HCT.
We evaluated the effect of allogeneic HCT after CAR T-cell therapy on EFS as a time-dependent covariate. In univariable analysis, allogeneic HCT after CAR T-cell therapy was associated with longer EFS compared with no allogeneic HCT (HR, 0.31; 95% CI, 0.13-0.79; P = .014). To determine whether allogeneic HCT had an independent effect on EFS in patients achieving MRD-negative CR after CAR T-cell immunotherapy, we adjusted for factors that were found in the stepwise multivariable model to have an impact on EFS. No significant interaction effect was seen between allogeneic HCT and the previously defined risk group (P = .51). After adjusting for prelymphodepletion LDH concentration, platelet count, and the use of fludarabine-containing lymphodepletion, multivariable stepwise modeling demonstrated that patients undergoing allogeneic HCT after CAR T-cell therapy had a lower risk of treatment failure for EFS compared with those who did not undergo HCT (Table 3).
Multivariable analysis for factors that have an impact on EFS in patients who achieved MRD-negative CR, adjusted for HCT after CAR T-cell therapy as a time-dependent covariate
| Variable | Multivariable analysis | P | |
|---|---|---|---|
| HR | 95% CI | ||
| LDH prelymphodepletion (per 100 U/L increment) | 1.39 | 1.11-1.73 | .004 |
| Platelets prelymphodepletion (per 50 000/μL increment) | 0.74 | 0.53-1.03 | .069 |
| Fludarabine added to lymphodepletion | 0.25 | 0.15-0.78 | .003 |
| HCT after CAR T-cell therapy | 0.39 | 0.13-1.15 | .088 |
Discussion
The high rate of MRD-negative CR (85%) in this study demonstrates that lymphodepletion followed by infusion of a defined composition of autologous T cells engineered to express a CD19 CAR incorporating a 4-1BB costimulatory domain is an effective salvage therapy for adult patients with relapsed/refractory B-ALL. Longer EFS and OS were seen in patients who achieved MRD-negative CR by high-resolution flow cytometry after treatment with CD19 CAR T cells compared with those who did not respond, and a favorable outcome was associated with robust in vivo CAR T-cell expansion and deeper remission indicated by the absence of the leukemic index clone by HTS.
Multivariable stepwise analysis in patients who achieved MRD-negative CR showed that a lower LDH concentration and higher platelet count before lymphodepletion and use of fludarabine in the lymphodepletion regimen were associated with better EFS. Low-risk patients who received fludarabine and had a normal prelymphodepletion LDH concentration and platelet count ≥100 000/μL had durable remissions and a 2-year OS of 86%. The mechanisms by which a low LDH and high platelet count are associated with good survival have not been elucidated. Consistent with a recent report,10 we found in univariable analysis that a lower percentage of marrow blasts was associated with better EFS; however, this variable was not selected by our multivariable model. We considered that the prelymphodepletion LDH concentration and platelet count could reflect marrow disease burden, but these variables showed only mild to moderate correlation with the marrow disease burden. The superior performance of LDH concentration and platelet count in multivariable modeling suggests that these variables may also reflect the impact of factors other than marrow burden, such as an aggressive disease kinetics. Indeed, high LDH concentration and low platelet count correlated with the need for bridging systemic therapy. Serum LDH concentration has been associated with tumor burden and proliferative activity in B-cell and other malignancies30-33 and may correlate with an immunosuppressive tumor microenvironment.34-36 Thrombocytopenia could also be the result of the cumulative effects of multiple previous therapy regimens, which in turn could be associated with poor T-cell function. A larger cohort would provide validation of the multivariable model and allow further assessment of the mechanisms by which these variables affect durable responses.
Despite the high MRD-negative CR rate, there was a significant risk of relapse (49%), demonstrating a need to improve response duration after treatment with CD19 CAR T cells. Although the LDH concentration and platelet count were not closely associated with CD19– or CD19+ relapse, incorporation of fludarabine into the lymphodepletion regimen was associated with superior CAR T-cell expansion and persistence and a lower risk of CD19+ relapse.6 Given the small number of patients, the effect of expansion compared with persistence on relapse phenotype warrants further investigation. In conjunction with the observation that all post-HCT relapses were CD19+, these data indicate that loss of CAR T-cell persistence is a key risk factor for CD19+ relapse. Conversely, the occurrence of CD19– relapse in patients with robust CAR T-cell expansion and persistence is consistent with continued immune pressure, suggesting that strategies to minimize escape by antigen loss, such as multiple-antigen targeting, should be pursued.16
CD19– and CD19+ relapses could potentially be reduced by allogeneic HCT after CAR T-cell therapy. As standard of care for patients with refractory/relapsed ALL who achieve remission, allogeneic HCT was performed in 40% of patients in early MRD-negative CR after CAR T-cell therapy. The decision to perform transplantation was based on standard clinical parameters such as age, history of previous transplantations, patient preference, and comorbidities. The incidence of NRM after HCT was consistent with that reported for patients who previously underwent allogeneic HCT without previous CD19 CAR T-cell immunotherapy.37-39 When HCT was incorporated into our EFS multivariable model as a time-dependent covariate, we saw better EFS in MRD-negative CR patients who proceeded to transplantation compared with those who did not undergo HCT. Although there were differences between patients who did or did not undergo allogeneic HCT, the lack of an interaction effect between allogeneic HCT and the risk factors identified in the multivariable model suggest that both high- and low-risk groups might gain an EFS benefit from allogeneic HCT. This conclusion is in apparent contrast to that of a recent study that suggested no EFS or OS benefit from allogeneic HCT.10 The univariable approach and higher reported post-HCT relapses and NRM rates in the previous study could have contributed to the differences in findings. Although the 2 studies used different CAR constructs and manufacturing strategies, the higher MRD-negative CR rate after treatment with 4-1BB–costimulated CAR T cells in our trial suggests that it is unlikely that deeper remissions and more durable responses without HCT would be observed after treatment with CD28-costimulated CAR T cells.10
In our study and the report from Park et al,10 durable EFS was achieved in a subset of adults who did not receive a transplant after achieving MRD-negative CR after CAR T-cell immunotherapy. However, in most adults who did not undergo HCT, EFS was limited. One-year EFS of 51% to 59% is reported after treatment with 4-1BB–costimulated CD19 CAR T cells in pediatric studies, in which a majority of patients do not receive a transplant after CAR T-cell therapy because of a history of previous allogeneic HCT before receiving treatment with CAR T cells.9,12 The apparently better EFS in pediatric compared with adult patients who do not proceed to allogeneic HCT after CAR T-cell therapy could be related to differences in B-ALL disease biology or the quality of T cells isolated from children who had previously received a transplant compared with heavily pretreated adults.40 It is unknown whether allogeneic HCT could further improve EFS and OS in a pediatric population after treatment with CD19 CAR T cells. Until definitive randomized studies are available, consolidation therapy with allogeneic transplantation should be considered for eligible adult B-ALL patients in remission after CD19 CAR T-cell therapy.
CD19 CAR T cells in adult B-ALL are highly effective at inducing MRD-negative CR, but relapse is frequent, especially in the absence of allogeneic HCT. Improvements in the duration of response are needed, particularly for patients with higher-risk characteristics.
The online version of this article contains a data supplement.
The publication costs of this article were defrayed in part by page charge payment. Therefore, and solely to indicate this fact, this article is hereby marked “advertisement” in accordance with 18 USC section 1734.
Acknowledgments
The authors thank the Fred Hutchinson Cancer Research Center Cell Processing Facility, Seattle Cancer Care Alliance Cell Therapy Laboratory, the staff of the Program in Immunology, the Immunotherapy Integrated Research Center, and Bezos Family Immunotherapy Clinic.
This work was supported by grants from the National Institutes of Health, National Cancer Institute (R01 CA136551, P30 CA15704), National Institute of Diabetes and Digestive and Kidney Diseases (P30 DK56465), and by the Life Science Discovery Fund, Bezos Family, University of British Columbia Clinician Investigator Program, and Juno Therapeutics (a Celgene company).
Authorship
Contribution: K.A.H., J.G., and A.V.H. collected and analyzed research data; S.C., G.S., and X.C. collected research data; B.S.P., R.M.H., A.V., and R.N.S. performed experiments; D.L., J.M.V., Q.W., and T.A.G. performed statistical analyses; K.A.H. and C.J.T. wrote and edited the manuscript; and all authors reviewed and edited draft and final versions of the manuscript.
Conflict-of-interest disclosure: K.A.H. has served on ad hoc advisory boards for Celgene. D.L. is an employee of and has equity interests in Juno Therapeutics (a Celgene company). B.G.T. received research funding from Mustang Biopharma and has patents licensed to Mustang Biopharma. H.-P.K. served as a consultant for Rocket Pharmaceuticals, Homology Medicine, and Magenta. J.D.R. is an employee of and has equity ownership in Seattle Genetics. M.S. received research funding from Acerta Pharma, Beigene, Celgene, Genentech, Gilead Sciences, Mustang Biopharma, Pharmacyclics, and TG Therapeutics and served as a consultant for Qilu Puget Sound Biotherapeutics, AbbVie, Genentech, Verastem, and AstraZeneca. R.D.C. received research funding from Amgen, Incyte, Kite (a Gilead Company), Merck, Pfizer, and Seattle Genetics and served as a consultant for Adaptive Biotechnologies, Pfizer, Amgen, and Jazz Pharmaceuticals. U.H.A. received research funding from Juno Therapeutics. S.R.R. served as an advisor and has equity interests in Juno Therapeutics, Adaptive Biotechnologies, and Nohla Therapeutics. D.G.M. received research funding from GlaxoSmithKline and Juno Therapeutics. C.J.T. received research funding from Juno Therapeutics and Nektar Therapeutics, has patents licensed to Juno Therapeutics, serves on scientific advisory boards, has equity ownership in Caribou Biosciences, Eureka Therapeutics, and Precision Biosciences, and has served on ad hoc advisory boards for Aptevo, Juno Therapeutics, Kite, Nektar Therapeutics, and Novartis. The remaining authors declare no competing financial interests.
Correspondence: Kevin A. Hay, British Columbia Cancer Research Centre, 675 West 10th Ave, Vancouver, BC V5Z 1L3, Canada; e-mail: khay@bccrc.ca.
