

Key Points
Constitutive NF-κB and JAK/STAT activation in HRS cells is caused by an autocrine feedback loop driven by secreted LTA.
LTA promotes expression of multiple cytokines, chemokines, receptors, and immune checkpoint ligands that are typical for HRS cells.

Abstract
Persistent NF-κB activation is a hallmark of the malignant Hodgkin/Reed-Sternberg (HRS) cells in classical Hodgkin lymphoma (cHL). Genomic lesions, Epstein-Barr virus infection, soluble factors, and tumor–microenvironment interactions contribute to this activation. Here, in an unbiased approach to identify the cHL cell-secreted key factors for NF-κB activation, we have dissected the secretome of cultured cHL cells by chromatography and subsequent mass spectrometry. We identified lymphotoxin-α (LTA) as the causative factor for autocrine and paracrine activation of canonical and noncanonical NF-κB in cHL cell lines. In addition to inducing NF-κB, LTA promotes JAK2/STAT6 signaling. LTA and its receptor TNFRSF14 are transcriptionally activated by noncanonical NF-κB, creating a continuous feedback loop. Furthermore, LTA shapes the expression of cytokines, receptors, immune checkpoint ligands and adhesion molecules, including CSF2, CD40, PD-L1/PD-L2, and VCAM1. Comparison with single-cell gene-activity profiles of human hematopoietic cells showed that LTA induces genes restricted to the lymphoid lineage, as well as those largely restricted to the myeloid lineage. Thus, LTA sustains autocrine NF-κB activation, impacts activation of several signaling pathways, and drives expression of genes essential for microenvironmental interactions and lineage ambiguity. These data provide a robust rationale for targeting LTA as a treatment strategy for cHL patients.
Introduction
The malignant Hodgkin/Reed-Sternberg (HRS) cells of classical Hodgkin lymphoma (cHL) represent only a small fraction of the neoplastic lesions.1 HRS cells depend on intensive interactions with their microenvironment, through surface receptors, cytokines, and chemokines, for their survival. Disruption of this interaction is explored as a therapeutic strategy.2 Despite their B-cell origin, HRS cells lack typical B-cell markers and instead express genes of other hematopoietic lineages, including myeloid cells. Their altered gene expression is due to the deregulation of several transcription factor pathways, including NF-κB.3 Activation of the canonical and noncanonical NF-κB pathways is a hallmark of HRS cells.4-6 Genomic lesions, Epstein-Barr virus infection, and cytokine–receptor interactions contribute to the NF-κB activation.1 Proteomic secretome analyses can provide pathogenetically relevant insights into the interaction between HRS cells and infiltrating lymphocytes.7 Here, we dissected the secretome of cultured cHL cells to identify secreted key factors essential for the constitutive NF-κB activity.
Study design
Cell lines were from Deutsche Sammlung von Mikroorganismen und Zellkulturen (Braunschweig, Germany). For information about culture conditions, cell treatments, protein extraction, western blotting, and electrophoretic mobility shift assays (EMSAs), see supplemental Materials and methods, available on the Blood Web site.
The lentiCRIPSPR-v2 vector for CRISPR/Cas9-mediated gene knockout was from Feng Zhang (Addgene plasmid #52961). Guide RNAs (gRNAs) were designed using CrispRGold.8 For lentiviral packaging, transfection, and cellular transduction, see supplemental Materials and methods.
Gene expression was measured with human Clariom S (Thermo Fisher Scientific) and analyzed using a Transcriptome Analysis Console 4.0. The data have been deposited in ArrayExpress9 at European Molecular Biology Laboratory–European Bioinformatics Institute under accession number E-MTAB-6896.
For additional methodology, see supplemental Materials and methods.
Results and discussion
cHL cells display constitutive canonical and noncanonical NF-κB activation5 and secrete soluble factors, which induce global NF-κB activity.10 For unbiased identification of NF-κB–activating factors, we dissected the cHL cell secretome (Figure 1A). The supernatant (SUP) of L1236 cells was fractionated chromatographically, and NF-κB–inducing and control fractions were subjected to mass spectrometry (supplemental Figure 1A-B). LTA was the only cytokine among 72 extracellular proteins enriched in the active fractions (supplemental Table 1). LTA activates NF-κB11 and is expressed in primary HRS cells12 ; we found DNase I accessibility of its gene in cHL cell lines but not in non-Hodgkin cell lines.13 Therefore, LTA was selected for further analyses.
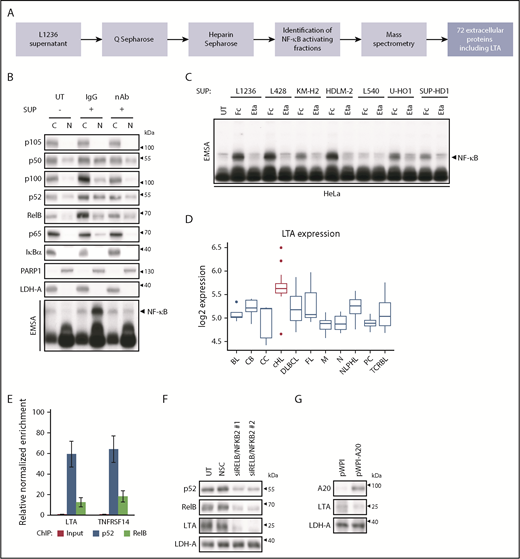
LTA secretion by cHL cells drives NF-κB activation through a self-sustained feedback loop. (A) Flow scheme, identification of NF-κB–activating factors in L1236 cHL cell secretome. (B) HeLa cells were left untreated (UT) or were stimulated with SUP of L1236 cells for 24 hours with 80 µg/mL immunoglobulin G control (IgG) or LTA-neutralizing antibody (nAb). Subcellular localization of the indicated proteins was determined in cytoplasmic (C) and nuclear (N) extracts by western blot analysis and NF-κB activation by EMSA (bottom panel). (C) HeLa cells were treated with conditioned SUP of the cHL cell lines with 100 µg/mL human Fc control (Fc) or etanercept (Eta). Whole-cell extracts were analyzed for NF-κB DNA binding by EMSA. (D) Box plot representing the distribution of LTA mRNA expression in malignancies and normal B cells.14 cHL samples are indicated in red. (E) Chromatin immunoprecipitation was performed in L1236 cells using p52 and RelB-specific antibodies. Regulatory regions of LTA and TNFRSF14 were analyzed for DNA recruitment. Error bars represent the standard error of the mean. (F) Knockdown of the noncanonical NF-κB subunits was performed in L1236 cells. Cells were harvested after 4 days. Whole-cell extracts were analyzed by western blotting for expression of LTA, using LDH-A as control. (G) L1236 cells were transduced with either pWPI control or A20-expressing vector. Expression of A20, LTA, and LDH-A was determined by western blotting as in (F). BL, Burkitt’s lymphoma; CB, centroblasts; CC, centrocytes; DLBCL, diffuse large B-cell lymphoma; FL, follicular lymphoma; M, mature B cells; N, naive B cells; NLPHL, nodular lymphocyte-predominant Hodgkin lymphoma; NSC, non-silencing siRNA control; PC, plasma cells; TCRBL, T-cell–rich B-cell lymphoma.
LTA secretion by cHL cells drives NF-κB activation through a self-sustained feedback loop. (A) Flow scheme, identification of NF-κB–activating factors in L1236 cHL cell secretome. (B) HeLa cells were left untreated (UT) or were stimulated with SUP of L1236 cells for 24 hours with 80 µg/mL immunoglobulin G control (IgG) or LTA-neutralizing antibody (nAb). Subcellular localization of the indicated proteins was determined in cytoplasmic (C) and nuclear (N) extracts by western blot analysis and NF-κB activation by EMSA (bottom panel). (C) HeLa cells were treated with conditioned SUP of the cHL cell lines with 100 µg/mL human Fc control (Fc) or etanercept (Eta). Whole-cell extracts were analyzed for NF-κB DNA binding by EMSA. (D) Box plot representing the distribution of LTA mRNA expression in malignancies and normal B cells.14 cHL samples are indicated in red. (E) Chromatin immunoprecipitation was performed in L1236 cells using p52 and RelB-specific antibodies. Regulatory regions of LTA and TNFRSF14 were analyzed for DNA recruitment. Error bars represent the standard error of the mean. (F) Knockdown of the noncanonical NF-κB subunits was performed in L1236 cells. Cells were harvested after 4 days. Whole-cell extracts were analyzed by western blotting for expression of LTA, using LDH-A as control. (G) L1236 cells were transduced with either pWPI control or A20-expressing vector. Expression of A20, LTA, and LDH-A was determined by western blotting as in (F). BL, Burkitt’s lymphoma; CB, centroblasts; CC, centrocytes; DLBCL, diffuse large B-cell lymphoma; FL, follicular lymphoma; M, mature B cells; N, naive B cells; NLPHL, nodular lymphocyte-predominant Hodgkin lymphoma; NSC, non-silencing siRNA control; PC, plasma cells; TCRBL, T-cell–rich B-cell lymphoma.
We detected LTA specifically in the conditioned medium of cHL cell lines, with the exception of L540, but not in that from non-Hodgkin cell lines (supplemental Figure 1C). SUP of cHL cells and recombinant LTA activated a canonical and noncanonical NF-κB subunit pattern in HeLa cells resembling the constitutive activity in cHL cells (supplemental Figure 2). Addition of LTA-neutralizing antibody or the tumor necrosis factor (TNF)/LTA decoy receptor etanercept to cHL cell SUP completely blocked NF-κB activation (Figure 1B-C). Thus, LTA is a crucial NF-κB–inducing factor secreted by cHL cell lines.
Reanalysis of expression data from microdissected lymphomas and B cells14 revealed the highest LTA expression in Hodgkin lymphoma (Figure 1D). Among the LTA receptors TNFRSF1A, TNFRSF1B, and TNFRSF14,15 only TNFRSF14 displayed consistent surface expression in cHL cells (supplemental Figure 3A-B). LTA also forms heterotrimers with LTB, allowing LTBR binding. However, only HDLM-2 cells expressed LTB (supplemental Figure 4A), and the absence of LTBR and the insignificant expression of the TNFRSF14 coreceptors BTLA and CD160 (supplemental Figure 4B-D) indicated TNFRSF14 as a mediator of LTA signaling.
LTA and TNFRSF14 genes recruit noncanonical NF-κB in L1236 cells, and knockdown of NFKB2 and RELB, but not of NFKB1 and RELA, diminished LTA and TNFRSF14 levels (Figure 1E-F; supplemental Figure 5A). Mutations in the pathway inhibitors NFKBIA and TNFAIP3/A20 contribute to persistent NF-κB activity in HRS cells.16 Interestingly, L540 cells, which do not secrete LTA, lack these mutations (supplemental Figure 5B). A20 reexpression in L1236 cells reduced LTA levels (Figure 1G; supplemental Figure 5C), underlining the importance of A20 mutations or loss17 also in the context of LTA regulation.
To determine LTA’s impact on global gene expression, we generated L1236 LTA-knockout (KO) cells (supplemental Figure 6A). In the selected clones, g2_1 and g3_4, LTA inactivation altered the expression of 803 genes (supplemental Table 2); 634 genes were downregulated, and 169 genes were upregulated. Gene set enrichment analysis revealed highest enrichment of the hallmark gene sets18 TNFA_signaling_via_NF-κB, IL6_JAK_STAT3_Signaling, and Inflammatory_Response (supplemental Figure 6B). Enrichment analysis (Enrichr)19 of the LTA-activated genes using the Cancer Cell Line Encyclopedia revealed a significant overlap between L1236_HAEMATOPOIETIC_AND_LYMPHOID_TISSUE and cHL cell lines L428, SUP-HD1, and HDLM-2, indicating that LTA-dependent gene expression is a representative feature of the cHL gene signature (supplemental Table 3).
LTA KO strongly decreased NF-κB DNA binding and expression of p105/p50, c-Rel, RelB, and p52 (Figure 2A; supplemental Figure 7A), as well as decreased JAK2 expression, STAT6 phosphorylation, and DNA binding (Figure 2A; supplemental Figure 7B). Thus, autocrine LTA signaling is a major force driving constitutive NF-κB and JAK2/STAT6 activation in cHL cells. LTA inactivation sensitized cells toward proapoptotic stress elicited by γ-irradiation (supplemental Figure 8). Reduced transcription factor activity resulted in altered cytokine and chemokine expression and secretion (Figure 2B; supplemental Figure 9). In addition, CSF2, interleukin-6, CCL17, CCL2, and CCL5 levels were strongly reduced. Furthermore, receptors and adhesion molecules were downregulated (Figure 2C), including the NF-κB targets CD44, CD40, CD80, and CCR4.5 Importantly, PD-L1 (CD274) and PD-L2 (PDCD1LG2) levels were severely reduced (Figure 2C-D). These ligands play a key role in the immune evasion of HRS cells.20 They are induced by JAK/STAT signaling and are highly expressed on HRS cells.2
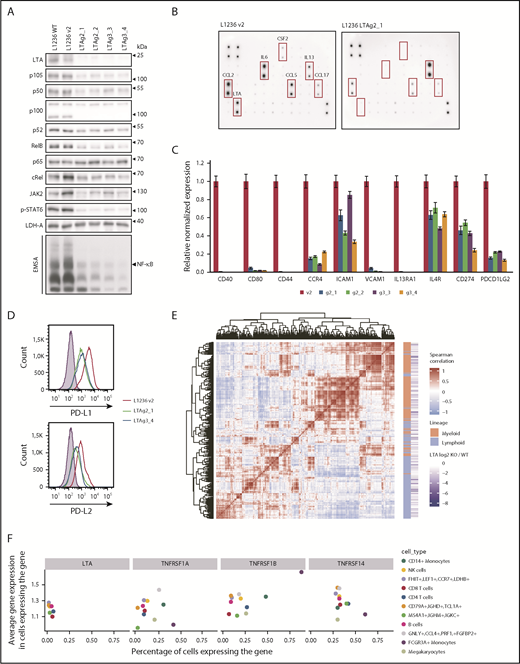
LTA drives NF-κB and JAK/STAT activation and constitutes a mixed lymphoid/myeloid gene-expression program in cHL cells. (A) Whole-cell extracts of L1236 wild-type (WT), control (v2), and 2 LTA-KO clones for each gRNA (LTAg2 and LTAg3) were analyzed in western blots for expression and phosphorylation of indicated proteins. Nuclear extracts of control and KO cells were assessed for NF-κB DNA binding activity by EMSA (bottom panel). (B) L1236 control and LTA clonal KO cells (g2_1) were cultivated at a cell density of 5 × 10⁵ cells per milliliter in RPMI 1640 without fetal calf serum. The medium was collected after 24 hours, and cytokine secretion was analyzed using the Cytokine Array C3. (C) L1236 control cells or the indicated LTA-KO clones were cultured for 72 hours. Expression levels of indicated target genes were verified by real-time quantitative polymerase chain reaction. Error bars represent the standard error of the mean. (D) PD-L1 and PD-L2 cell surface expression levels were analyzed by flow cytometry. Filled curve: isotype control. (E) Coexpression analysis of LTA target genes in healthy PBMCs.21 Heat map shows the similarity between expression profiles of each pair of LTA target genes. Positive correlation between 2 genes is designated by the intensity of the red color, whereas the blue gradient designates negative correlation (genes with more similar expression profiles are positioned closer on the heat map). Red blocks show the existence of gene-regulatory modules. Based on their level of expression, genes were annotated as expressed primarily in the lymphoid lineage or the myeloid lineage (orange/green annotation). (F) Expression of LTA and LTA receptors in PBMCs. The x-axis shows the percentage of cells in a cell population that express the corresponding gene. The y-axis shows the average gene expression in expressing cells. Cell populations expressing the gene in <1% of the cells were removed from the visualization. The color depicts the cell type.
LTA drives NF-κB and JAK/STAT activation and constitutes a mixed lymphoid/myeloid gene-expression program in cHL cells. (A) Whole-cell extracts of L1236 wild-type (WT), control (v2), and 2 LTA-KO clones for each gRNA (LTAg2 and LTAg3) were analyzed in western blots for expression and phosphorylation of indicated proteins. Nuclear extracts of control and KO cells were assessed for NF-κB DNA binding activity by EMSA (bottom panel). (B) L1236 control and LTA clonal KO cells (g2_1) were cultivated at a cell density of 5 × 10⁵ cells per milliliter in RPMI 1640 without fetal calf serum. The medium was collected after 24 hours, and cytokine secretion was analyzed using the Cytokine Array C3. (C) L1236 control cells or the indicated LTA-KO clones were cultured for 72 hours. Expression levels of indicated target genes were verified by real-time quantitative polymerase chain reaction. Error bars represent the standard error of the mean. (D) PD-L1 and PD-L2 cell surface expression levels were analyzed by flow cytometry. Filled curve: isotype control. (E) Coexpression analysis of LTA target genes in healthy PBMCs.21 Heat map shows the similarity between expression profiles of each pair of LTA target genes. Positive correlation between 2 genes is designated by the intensity of the red color, whereas the blue gradient designates negative correlation (genes with more similar expression profiles are positioned closer on the heat map). Red blocks show the existence of gene-regulatory modules. Based on their level of expression, genes were annotated as expressed primarily in the lymphoid lineage or the myeloid lineage (orange/green annotation). (F) Expression of LTA and LTA receptors in PBMCs. The x-axis shows the percentage of cells in a cell population that express the corresponding gene. The y-axis shows the average gene expression in expressing cells. Cell populations expressing the gene in <1% of the cells were removed from the visualization. The color depicts the cell type.
Finally, we integrated our signature of LTA-activated genes with human peripheral blood mononuclear cell (PBMC) single-cell expression profiles.21 Subsets of LTA-regulated genes clustered into coexpression modules, groups of genes with similar expression patterns across the cell types. These genes cluster into 2 main groups: highly expressed in lymphoid or myeloid cells (Figure 2E), showing that LTA activates genes in cHL cells that are normally expressed in cells of the lymphoid and myeloid lineages (see also supplemental Figure 10). Interestingly, LTA and its receptors have disjointed expression patterns in PBMCs; the highest percentages of LTA-expressing cells were found in lymphoid populations, whereas LTA receptors were highly and preferentially expressed in myeloid cells (Figure 2F), suggesting a paracrine mode of LTA action and the primary importance of LTA signaling in myeloid cells.
Taken together, we identified LTA as a key NF-κB and JAK/STAT pathway-inducing factor in L1236 cHL cells. Our findings are supported by previous studies showing LTA in primary HRS cells and the conditioned medium of cHL cell lines.12,22-24 LTA induces its own expression through self-sustained feedback loop signaling via TNFRSF14, thereby activating NF-κB. This loop is enhanced by the lack of negative feedback regulators, such as A20.
The LTA-induced genes are of lymphoid and myeloid origin, indicating that the LTA–TNFRSF14 signaling axis contributes to the unique admixture of myeloid gene expression and lineage ambiguity of cHL. Indeed, signaling through TNFRSF14 has been shown to promote myeloid differentiation of human stem cells.25 LTA could function as a directional and paracrine signaling molecule from lymphoid to myeloid cells. Because cHL cells express LTA, as well as TNFRSF14, LTA signaling switches from paracrine to autocrine.
The expression control of PD-L1 and PD-L2 by LTA may contribute to immune surveillance evasion.2 Our data, revealing LTA-mediated autocrine regulation of cHL cells and its pivotal role in upstream NF-κB activation resulting in apoptosis protection and paracrine effects on the microenvironment,12 provide a robust rationale for LTA targeting as a treatment strategy for cHL patients.
Data have been deposited in the ArrayExpress at European Molecular Biology Laboratory–European Bioinformatics Institute (accession number E-MTAB-6896).
The online version of this article contains a data supplement.
The publication costs of this article were defrayed in part by page charge payment. Therefore, and solely to indicate this fact, this article is hereby marked “advertisement” in accordance with 18 USC section 1734.
Acknowledgments
The authors thank Gabriele Born for chip hybridization, Hans-Peter Rahn (Flow Cytometry Facility, Max-Delbrück-Center [MDC]), and Kerstin Krüger (Uta E. Höpken group, MDC) for expertise in flow cytometry analysis, Sabine Jungmann for expert technical assistance, Brigitte Wollert-Wulf (Martin Janz group, MDC) for assistance with the CRISPR/Cas9 system, Robin Graf (Klaus Rajewsky laboratory, MDC) for designing the gRNAs, Franz Rüschendorf for bioinformatics analysis, and Nadine Mikuda for data analysis.
This work was supported, in part, by the Deutsche Forschungsgemeinschaft (DFG) (TRR54 Sche 277/7-3 [C.S.] and MA 3313/2-1 [S.M.]) and by iMed (Helmholtz Association; C.S.).
Authorship
Contribution: L.v.H. performed cell-stimulation experiments, preparation of subcellular extracts, western blot analyses, enzyme-linked immunosorbent assays, RNA interference of NF-κB subunits, cloning, and flow cytometry analysis, as well as designed and performed the CRISPR/Cas9-mediated KO of LTA and lentiviral TNFAIP3 expression; E.K. performed EMSAs, chromatin immunoprecipitation experiments, RNA extraction, semiquantitative polymerase chain reactions, and microarray analyses, as well as designed primers and analyzed targets by real-time quantitative polymerase chain reaction; E.K. and G.P. analyzed microarray data; V.F. integrated datasets with gene-expression data of primary tumors and analyzed single-cell data; E.K. and V.F. performed gene set enrichment analyses; L.v.H., E.K., and K.W.S.-B. performed chromatographic fractionation; E.M. analyzed chromatographic fractions using mass spectrometry; N.S. and M.K. performed western blot and functional analyses; N.H., M.S., O.D., A.A., S.M., and C.S. analyzed data; L.v.H. drafted the manuscript; L.v.H., C.S., E.K., and S.M. wrote the manuscript; and all authors read and approved the manuscript.
Conflict-of-interest disclosure: The authors declare no competing financial interests.
Correspondence: Claus Scheidereit, Max-Delbrück-Center for Molecular Medicine, Robert-Rössle Straße 10, 13125 Berlin, Germany; e-mail: scheidereit@mdc-berlin.de.

This feature is available to Subscribers Only
Sign In or Create an Account Close Modal