Key Points
SRC-3 deficiency causes reduced quiescence and functional impairment of HSCs.
SRC-3 participates in HSC quiescence maintenance by regulating mitochondrial metabolism.
Abstract
Quiescence maintenance is an important property of hematopoietic stem cells (HSCs), whereas the regulatory factors and underlying mechanisms involved in HSC quiescence maintenance are not fully uncovered. Here, we show that steroid receptor coactivator 3 (SRC-3) is highly expressed in HSCs, and SRC-3–deficient HSCs are less quiescent and more proliferative, resulting in increased sensitivity to chemotherapy and irradiation. Moreover, the long-term reconstituting ability of HSCs is markedly impaired in the absence of SRC-3, and SRC-3 knockout (SRC-3−/−) mice exhibit a significant disruption of hematopoietic stem and progenitor cell homeostasis. Further investigations show that SRC-3 deficiency leads to enhanced mitochondrial metabolism, accompanied by overproduction of reactive oxygen species (ROS) in HSCs. Notably, the downstream target genes of peroxisome proliferator–activated receptor-coactivators 1α (PGC-1α) involved in the regulation of mitochondrial metabolism are significantly upregulated in SRC-3–deficient HSCs. Meanwhile, a significant decrease in the expression of histone acetyltransferase GCN5 accompanied by downregulation of PGC-1α acetylation is observed in SRC-3–null HSCs. Conversely, overexpression of GCN5 can inhibit SRC-3 deficiency-induced mitochondrial metabolism enhancement and ROS overproduction, thereby evidently rescuing the impairment of HSCs in SRC-3−/− mice. Collectively, our findings demonstrate that SRC-3 plays an important role in HSC quiescence maintenance by regulating mitochondrial metabolism.
Introduction
Hematopoietic stem cells (HSCs) are a specialized group of cells with the ability to self-renew and differentiate into distinct lineages of the entire hematopoietic system throughout lifetime.1 In the steady state, adult HSCs are retained in a hypoxic bone marrow (BM) niche and maintained at relatively constant cell numbers.2,3 As reported, adult HSCs, especially the long-term HSCs (LT-HSCs), are in a dormant status and rely largely on anaerobic glycolysis.4 It is known that the metabolic switch from anaerobic glycolysis to mitochondrial oxidative phosphorylation (OXPHOS) can drive HSCs into cell cycle, leading to reduced quiescence, increased proliferation, and impaired long-term reconstituting ability.4 Recently, several cell-intrinsic regulators involved in metabolic control of HSC function, such as FoxOs, mTOR, Lkb1, Bmi1, and Mfn2, have been identified.5-10 However, the mechanisms of metabolic regulation of HSCs are still not fully understood.
Steroid receptor coactivator 3 (SRC-3; also known as ACTR/NCOA3/AIB1/pCIP), as a member of the p160 SRC family of nuclear receptor coactivators, plays important roles in various physiological processes, including somatic growth, cell reproduction, female generative function, and energy metabolism.11-14 Previous studies, including our own work, have confirmed that SRC-3 can enhance the transcriptional activity of ligand-activated nuclear hormone receptors.11,15 Besides, SRC-3 can also regulate the transcription of nonnuclear receptor proteins, such as NF-kB and E2F1.16,17 Nevertheless, SRC-3 is best known for its role in promoting tumorigenesis, based on the findings that it is frequently overexpressed in many kinds of tumors.18
Interestingly, it has been demonstrated that mice lacking SRC-3 show decreased platelets and increased leukocytes in peripheral blood.16 Furthermore, our previous studies revealed a delayed hematopoietic recovery in SRC-3 knockout (SRC-3−/−) mice after ionizing irradiation.19,20 These findings indicate that SRC-3 may play an important role in maintaining hematopoiesis. Notably, SRC-3 has been defined as a key component of the pluripotency network in embryonic stem cells by directly modulating the essential self-renewal genes.21,22 More recently, SRC-3 was reported to be critical for the maintenance of cancer stemlike cells by promoting the expressions of epithelial-to-mesenchymal transition regulators and stem cell markers.23 However, the distinct role of SRC-3 in the regulation of HSC maintenance and function remains unexplored.
In this study, we first show that SRC-3 is enriched in murine HSCs, and its deficiency significantly reduces the quiescence and long-term reconstituting ability of HSCs. Then, we demonstrate that SRC-3 is involved in maintaining the quiescence and function of HSCs at least in part by restricting mitochondrial metabolism. These findings extend our understanding of the physical function of SRC-3 and also provide a deep insight into the metabolic control of HSCs.
Materials and methods
Animals
SRC-3−/− mice (CD45.2) were kindly provided by Jianming Xu (Molecular and Cellular Biology Laboratory, Baylor College of Medicine, Houston, TX). Wild-type (WT) littermates served as controls. C57Bl/6 SJL mice (CD45.1) were gifted by Jinyong Wang (Guangzhou Institutes of Biomedicine and Health, Chinese Academy of Science, Guangzhou, China). C57BL/6J mice were obtained from the Institute of Zoology (Chinese Academy of Sciences, Beijing, China). Unless otherwise stated, mice used were male and were 8 to 10 weeks old. All of the experimental procedures were authorized by the Animal Care Committee of the Third Military Medical University (Chongqing, China).
Hematological parameter test and irradiation
Hematological parameter testing and irradiation were performed as previously described.24
Flow cytometry
Mouse BM (flushed from femur and tibia), peripheral blood, and spleen samples were prepared as described.25 To analyze hematopoietic cell phenotype, monoclonal antibodies from eBioscience (San Diego, CA) and BioLegend (San Diego, CA) recognizing the following surface markers were used: Sca-1 (D7), c-Kit (2B8), CD34 (RAM34), Flk2 (A2F10), CD150 (mShad150), CD48 (HM48-1), CD127 (A7R34), CD16/32 (FcγRII/III), Gr-1 (RB6-8C5), Mac-1 (M1/70), B220 (RA3-6B2), CD3e (145-2C11), CD45.1 (A20), and CD45.2 (104). The mouse lineage cocktail contains anti-CD3, Mac-1, Gr-1, B220, and Ter-119 antibodies (eBioscience). The detailed methods for analysis of cell-cycle, 5-bromodeoxyuridine (BrdU) incorporation, apoptosis, and intracellular proteins are provided in supplemental methods, available on the Blood Web site. Flow cytometric analysis was performed using a FACSverse (BD Biosciences, San Jose, CA) flow cytometer, and cell sorting was conducted using a FACSAria II (BD Biosciences) sorter. Data were analyzed using FlowJo10.0 (TreeStar, San Carlos, CA) software.
Transplantation assays
For noncompetitive repopulation assay, 1 × 10⁶ BM cells (CD45.2) from WT or SRC-3−/− mice were transplanted into lethally irradiated (10 Gy) WT (CD45.1) recipient mice by tail IV injection. For competitive repopulation assays, 5 × 10⁵ BM cells (CD45.2) from WT or SRC-3−/− mice, together with 5 × 10⁵ competitor BM cells (CD45.1), were transplanted into lethally irradiated (10 Gy) WT (CD45.1) recipient mice. After 16 weeks, 1 × 10⁶ BM cells obtained from primary recipient mice were transplanted into lethally irradiated (10 Gy) secondary WT (CD45.1) recipient mice. For reciprocal transplantation,26 1 × 10⁶ BM cells from WT mice (CD45.1) were transplanted into lethally irradiated (10 Gy) WT or SRC-3−/− mice (CD45.2). Reconstitution of donor-derived cells was analyzed at each indicated time after transplantation.
Homing assay
Homing assay was performed as described,27 with minor alterations. Briefly, freshly sorted Lin− Sca1+ c-Kit+ cells (LSKs) from WT or SRC-3−/− mice were labeled with 5- and 6-carboxyfluorescein succinimidyl ester (eBioscience) following the manufacturer’s instructions. Next, 5 × 10⁴ LSKs were transplanted into lethally irradiated (10 Gy) recipient mice. Sixteen hours later, 5- and 6-carboxyfluorescein succinimidyl ester+ LSKs in the BM of recipient mice were analyzed by flow cytometry.
Mitochondrial properties and reactive oxygen species (ROS) analysis
These assays were performed as reported.6,28,29 Briefly, BM cells from WT or SRC-3−/− mice were first stained with cell-surface markers to identify hematopoietic stem and progenitor cells (HSPCs). To detect mitochondrial mass, cells were stained with MitoTracker Green (MTG; Invitrogen, Carlsbad, CA). To measure mitochondrial membrane potential, cells were stained with DilC1(5) (Invitrogen) or JC-1 probe (MultiSciences, Hangzhou, China). To assess glucose uptake, cells were stained with 2-NBDG (Invitrogen). To determine ROS levels, cells were stained with dichlorodihydrofluorescein diacetate (Sigma, St. Louis, MO) or MitoSox (Invitrogen). Finally, the cells were immediately analyzed by flow cytometry.
Quantitative reverse transcription polymerase chain reaction
Quantitative polymerase chain reaction (qPCR) was performed as described in supplemental methods.
Microarray analysis
Total RNA was extracted from sorted WT or SRC-3−/− LSKs. Then, complementary DNA was generated and hybridized on the Mouse Gene 2.0 ST arrays (Affymetrix, Santa Clara, CA) in duplicate according to the user manual. CEL files (raw data) were normalized using robust multiaverage method (RMA workflow). Fold change >1.5 between groups was defined as differentially expressed. Gene Ontology (GO) and KEGG pathway enrichment analysis methods were used for microarray data analysis. All raw data have been submitted to the GEO database (accession no. GSE110246).
Lentiviral construction and transduction
The GCN5 complementary DNA was cloned by PCR and then inserted into CMV-MCS-3FLAG-EF1-mCherry-T2A-PURO lentiviral vectors (Hanbio, Shanghai, China). The recombinant lentivirus with GCN5 coding sequence was generated by cotransfection of 293T cells with PSPAX2 and PMD2G plasmids. Forty-eight hours later, the virus was concentrated by centrifugation, and the virus pellet was resuspended with StemSpan SFEM media (Stem Cell Technologies, Grenoble, France). Lentiviral transduction was performed as described.30 After that, 5 × 10³ transduced cells along with 5 × 10⁵ BM cells (CD45.1) were transplanted into lethally irradiated (10 Gy) WT (CD45.1) recipient mice.
N-acetyl-l-cysteine (NAC) treatment
Mice were given NAC (Sigma) by intraperitoneal injection (100 mg/kg body weight) or provided in drinking water (1 mg/mL).
5-Fluorouracil (5-FU) treatment
Mice were administrated a single dose of 5-FU (150 mg/kg body weight; Sigma) by intraperitoneal injection. Then, blood cells were counted or mice were euthanized followed by the analysis of BM cells and HSCs by flow cytometry. For survival analysis, 5-FU (150 mg/kg body weight) was given weekly for 3 weeks to mice, and survival was monitored daily.
Single LT-HSC methylcellulose culture
This experiment was conducted as described.31 Briefly, single LT-HSCs from WT or SRC-3−/− mice were sorted into U-bottom 96-well plates in the presence of 100 µL methylcellulose media (M3434; Stem Cell Technologies) and cultured at 37°C. Colony size was determined at day 14.
Western blotting and immunoprecipitation
The detailed methods are described in supplemental methods.
Respiration
Respiration was analyzed using the Agilent Seahorse XFp Cell Mito Stress Test Kit (Seahorse Bioscience, Billerica, MA) according to manufacturer’s instructions. Briefly, 1 × 10⁵ LSKs sorted from WT and SRC-3−/− were immobilized to miniplate (Seahorse Bioscience) pretreated with Cell-Tak (BD Biosciences) and then treated sequentially with oligomycin (1 μM), carbonyl cyanide-4 (trifluoromethoxy) phenylhydrazone (1 μM), and rotenone/antimycin (0.5 μM each). Cellular respiration was measured by the Agilent Seahorse XFp analyzer (Seahorse Bioscience).
Transmission electron microscopy (TEM)
Sorted WT or SRC-3−/− LSKs were centrifuged and fixed in 2.5% glutaraldehyde. Then, the resulting pellets were washed, postfixed, dehydrated, and embedded. After cutting and staining, cell sections were photographed using a JEM-1400 (JEOL, Tokyo, Japan) transmission electron microscope.
Immunofluorescence microscopy
Assays were performed as described in supplemental methods.
Adenosine triphosphate measurement
Adenosine triphosphate (ATP) levels in sorted HSPCs from WT or SRC-3−/− mice were measured using the ATP Determination kit (Invitrogen) following the manufacturer’s instructions.
Statistical analysis
The experimental data were analyzed with GraphPad Prism 6.0 (La Jolla, CA). Unless otherwise stated, results were obtained from at least 3 independent experiments. Comparisons between 2 groups were determined by 2-tailed Student t test, and multiple groups were determined by 1-way analysis of variance followed by Tukey-Kramer post hoc analysis. The survival after sequential 5-FU administrations was shown as Kaplan-Meier survival curves (log-rank nonparametric test). All data are represented as mean ± standard deviation. P < .05 was considered statistically significant.
Results
SRC-3 is highly expressed in HSCs and is involved in maintaining HSPC pool
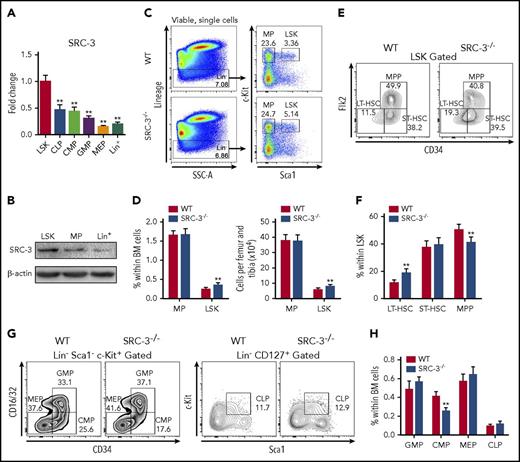
First, we detected the expression of SRC-3 in the murine hematopoietic system and found that it was highly expressed in LSKs, which are highly enriched with HSCs,32 compared with lineage-restricted progenitor cells and differentiated cells (Figure 1A-B; supplemental Figure 1B-C). Immunofluorescence staining confirmed the expression of SRC-3 in HSCs (supplemental Figure 1D). Then, SRC-3 knockout mice were used to investigate whether SRC-3 plays a distinct role in regulating HSC function. In comparison with WT mice, significant increases in the percentage and absolute number of LSKs were observed in the BM in SRC-3−/− mice (Figure 1C-D). Further analysis showed that, among the subpopulations of LSKs in SRC-3−/− mice, the percentage of LT-HSCs significantly increased, whereas the proportion of multipotent progenitors (MPP) markedly decreased (Figure 1E-F). The same result was also observed by signaling lymphocytic activation molecule–based immunophenotypic analysis33 (supplemental Figure 1E). Meanwhile, we found that the percentage of common myeloid progenitors (CMPs) was significantly reduced in BM after SRC-3 deletion (Figure 1G-H). These results suggest that SRC-3 is required for the maintenance of normal HSPC pool in the BM.
SRC-3 is highly expressed in HSCs and is involved in maintaining HSPC pool. (A) qPCR analysis of SRC-3 messenger RNA expression in LSKs, common lymphoid progenitors (CLPs), CMPs, granulocyte monocyte progenitors (GMPs), megakaryocyte erythroid progenitors (MEPs), and lineage+ (Lin+) cells (for gating strategies, see supplemental Figure 1A) from 8-week-old C57BL/6J mice (n = 3 mice). The relative expression of SRC-3 was compared with that in LSKs. (B) Western blot analysis of SRC-3 expression in LSKs, MPs, and Lin+ cells from 8-week-old C57BL/6J mice (n = 5 mice were pooled). (C) Representative flow cytometric plots show the frequency of Lin− cells, MPs, and LSKs in WT and SRC-3−/− BM. (D) The frequency (left) and absolute number (right) of MPs and LSKs in the BM of WT and SRC-3−/− mice (n = 8 mice per group). (E-F) Flow cytometric analysis of the frequency of LT-HSCs, short-term HSCs (ST-HSCs), and MPPs in the LSK compartments of WT and SRC-3−/− BM (n = 7 mice per group). (G-H) Flow cytometric analysis of the frequency of CMPs, GMPs, MEPs, and CLPs in the BM of WT and SRC-3−/− mice (n = 6 mice per group). **P < .01.
SRC-3 is highly expressed in HSCs and is involved in maintaining HSPC pool. (A) qPCR analysis of SRC-3 messenger RNA expression in LSKs, common lymphoid progenitors (CLPs), CMPs, granulocyte monocyte progenitors (GMPs), megakaryocyte erythroid progenitors (MEPs), and lineage+ (Lin+) cells (for gating strategies, see supplemental Figure 1A) from 8-week-old C57BL/6J mice (n = 3 mice). The relative expression of SRC-3 was compared with that in LSKs. (B) Western blot analysis of SRC-3 expression in LSKs, MPs, and Lin+ cells from 8-week-old C57BL/6J mice (n = 5 mice were pooled). (C) Representative flow cytometric plots show the frequency of Lin− cells, MPs, and LSKs in WT and SRC-3−/− BM. (D) The frequency (left) and absolute number (right) of MPs and LSKs in the BM of WT and SRC-3−/− mice (n = 8 mice per group). (E-F) Flow cytometric analysis of the frequency of LT-HSCs, short-term HSCs (ST-HSCs), and MPPs in the LSK compartments of WT and SRC-3−/− BM (n = 7 mice per group). (G-H) Flow cytometric analysis of the frequency of CMPs, GMPs, MEPs, and CLPs in the BM of WT and SRC-3−/− mice (n = 6 mice per group). **P < .01.
SRC-3 deficiency significantly reduces the quiescence and increases the proliferation of HSCs
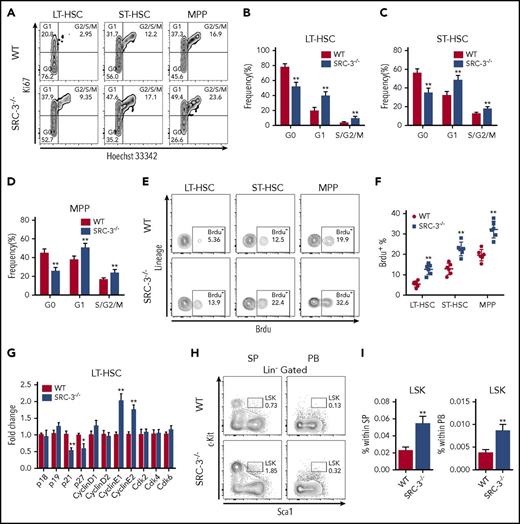
The maintenance of a quiescent state is essential for sustaining the normal function of HSCs.26 We then found that HSCs lacking SRC-3 were less quiescent (Figure 2A-D), whereas there was no significant difference in the cell-cycle state of myeloid progenitors (MPs) when SRC-3 was deleted (supplemental Figure 2A), hinting that SRC-3 has a relatively great effect on HSCs. Similar results were obtained by in vivo and in vitro BrdU incorporation assays (Figure 2E-F; supplemental Figure 2B-C). Consistently, significant decreases in the expressions of p21 and p27 and increases in the expressions of cyclin E1 and cyclin E2 were detected in SRC-3−/− LT-HSCs (Figure 2G). In addition, the frequency of LSKs dramatically increased in the spleen and peripheral blood upon SRC-3 deletion (Figure 2H-I). These results indicate that SRC-3 contributes to the maintenance of HSCs quiescence and the residence of HSCs in the BM.
SRC-3 deficiency significantly reduces the quiescence and increases the proliferation of HSCs. (A) Representative flow cytometric plots to show the cell-cycle distribution of LSK subpopulations in the BM of WT and SRC-3−/− mice. (B-D) Cell-cycle analysis of (B) LT-HSCs, (C) ST-HSCs, and (D) MPPs in the BM of WT and SRC-3−/− mice (n = 8 mice per group). (E-F) Flow cytometric analysis of in vivo BrdU incorporation of LT-HSCs, ST-HSCs, and MPPs from WT or SRC-3−/− BM (n = 6 mice per group). (G) qPCR analysis of cyclin-dependent kinase (CDK) inhibitors, cyclins, and CDKs in purified WT and SRC-3−/− LT-HSCs (n = 3 mice per group). All values are presented relative to WT controls. (H-I) Flow cytometric analysis of the percentages of LSKs in spleen (SP) and peripheral blood (PB) from WT and SRC-3−/− mice (n = 5 mice per group). *P < .05, **P < .01.
SRC-3 deficiency significantly reduces the quiescence and increases the proliferation of HSCs. (A) Representative flow cytometric plots to show the cell-cycle distribution of LSK subpopulations in the BM of WT and SRC-3−/− mice. (B-D) Cell-cycle analysis of (B) LT-HSCs, (C) ST-HSCs, and (D) MPPs in the BM of WT and SRC-3−/− mice (n = 8 mice per group). (E-F) Flow cytometric analysis of in vivo BrdU incorporation of LT-HSCs, ST-HSCs, and MPPs from WT or SRC-3−/− BM (n = 6 mice per group). (G) qPCR analysis of cyclin-dependent kinase (CDK) inhibitors, cyclins, and CDKs in purified WT and SRC-3−/− LT-HSCs (n = 3 mice per group). All values are presented relative to WT controls. (H-I) Flow cytometric analysis of the percentages of LSKs in spleen (SP) and peripheral blood (PB) from WT and SRC-3−/− mice (n = 5 mice per group). *P < .05, **P < .01.
SRC-3−/− HSCs are highly sensitive to cytotoxic stress and irradiation
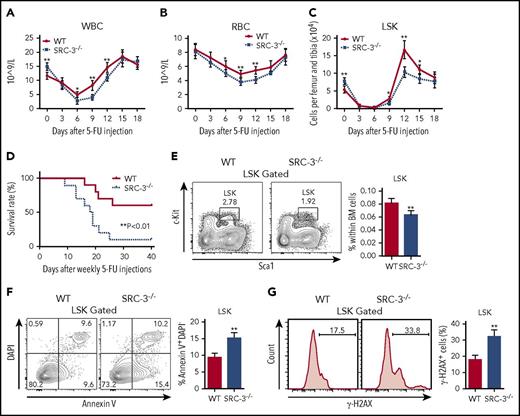
Given that quiescence protects cell from genotoxic stress,26 we therefore hypothesize that mice lacking SRC-3 may be sensitive to chemotherapy. As expected, distinct leucopenia and erythropenia were observed in both WT and SRC-3−/− mice after a single dose of 5-FU injection (Figure 3A-B). However, the decreases in the numbers of LSKs and BM cells were more apparent, and the duration of myelosuppression was much longer in SRC-3−/− mice after 5-FU treatment (Figure 3A-C; supplemental Figure 3). Consistently, the survival of SRC-3−/− mice is strikingly reduced after sequential 5-FU administration (Figure 3D).
SRC-3−/−HSCs are highly sensitive to cytotoxic stress and irradiation. (A-C) Peripheral (A) white blood cells (WBC), (B) red blood cells (RBC), and (C) BM LSKs from WT and SRC-3−/− mice after injection with a single dose of 5-FU (n = 6 mice per group). (D) Survival after sequential 5-FU administration (n = 10 mice per group). (E) Distribution of LSKs in WT and SRC-3−/− BM 24 hours after 6.0 Gy total body irradiation (TBI) (n = 6 mice per group). (F) Flow cytometric analysis of the apoptosis of LSKs from the BM of WT and SRC-3−/− mice 12 hours after a dose of TBI (6.0 Gy) (n = 5 mice per group). (G) WT and SRC-3−/− mice were subjected to 2 Gy TBI (n = 5 mice per group). After 3 hours, DNA damage in LSKs was assessed by flow cytometry with γ-H2AXS139 staining. *P < .05, **P < .01. DAPI, 4′,6-diamidino-2-phenylindole.
SRC-3−/−HSCs are highly sensitive to cytotoxic stress and irradiation. (A-C) Peripheral (A) white blood cells (WBC), (B) red blood cells (RBC), and (C) BM LSKs from WT and SRC-3−/− mice after injection with a single dose of 5-FU (n = 6 mice per group). (D) Survival after sequential 5-FU administration (n = 10 mice per group). (E) Distribution of LSKs in WT and SRC-3−/− BM 24 hours after 6.0 Gy total body irradiation (TBI) (n = 6 mice per group). (F) Flow cytometric analysis of the apoptosis of LSKs from the BM of WT and SRC-3−/− mice 12 hours after a dose of TBI (6.0 Gy) (n = 5 mice per group). (G) WT and SRC-3−/− mice were subjected to 2 Gy TBI (n = 5 mice per group). After 3 hours, DNA damage in LSKs was assessed by flow cytometry with γ-H2AXS139 staining. *P < .05, **P < .01. DAPI, 4′,6-diamidino-2-phenylindole.
Recently, we observed an increased sensitivity of SRC-3−/− mice to ionizing radiation,19,20 but the reason is largely unclear. Here, we showed that the percentage of LSKs in SRC-3−/− BM was decreased after a sublethal dose of total body irradiation (6 Gy) (Figure 3E). In addition, increased radiation-induced apoptosis and DNA damage in SRC-3−/− LSKs were found (Figure 3F-G). These findings provide additional evidence that the resistance of HSCs to cytotoxic stress or irradiation probably depends on their quiescent property.
SRC-3−/− HSCs have intrinsically defective function in reconstitution
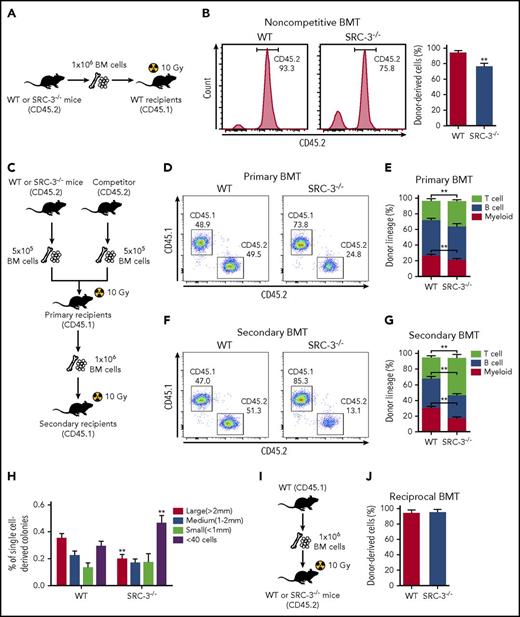
To assess if the reduced quiescence impairs SRC-3−/− HSC function, we first performed a noncompetitive bone marrow transplantation (BMT) (Figure 4A). The overall engraftment of BM cells from SRC-3−/− mice was diminished 16 weeks after transplantation (Figure 4B), reflecting compromised hematopoietic repopulating ability of SRC-3−/− HSCs. We next conducted a competitive transplantation to further determine the function of SRC-3−/− LT-HSC in long-term reconstitution (Figure 4C). Compared with WT controls, test cells from SRC-3−/− mice showed significantly lower levels of donor chimerism in recipients’ peripheral blood after primary and secondary BMT, with lymphoid-biased hematopoietic lineage reconstitution (Figure 4D-G). Indeed, impaired SRC-3−/− donor constitution was also observed in LSK compartments in recipients’ BM (supplemental Figure 4A). Consistently, the in vitro colony-forming ability SRC-3−/− LT-HSCs was also impaired (Figure 4H).
SRC-3−/−HSCs have intrinsically defective function in reconstitution. (A) Schematic of noncompetitive BMT. An amount of 1 × 10⁶ BM cells (CD45.2) from WT or SRC-3−/− mice was transplanted into lethally irradiated (10 Gy) WT (CD45.1) -recipient mice. (B) Flow cytometric analysis of the frequency of donor-derived cells (CD45.2) in the PB of CD45.1-recipient mice at 16 weeks after BMT (n = 8 mice per group). (C) Schematic of competitive BMT. (D,F) Representative flow cytometric plots show donor chimerism in (D) primary and (F) secondary recipient mice at 16 weeks after BMT (n = 8 mice per group). (E,G) Lineage distribution of donor-derived (CD45.2) myeloid cells (Gr-1+ Mac-1+), B cells (B220+), and T cells (CD3e+) in the PB of (E) primary and (G) secondary recipient mice at 16 weeks after BMT (n = 8 mice per group). (H) Size distribution of 180 single-cell sorted WT and SRC-3−/− LT-HSC–derived colonies 14 days after methylcellulose culture (n = 4 mice per group). (I) Schematic of reciprocal BMT. (J) The frequency of donor-derived cells (CD45.1) in the PB of WT or SRC-3−/− (CD45.2) –recipient mice at 16 weeks after reciprocal BMT (n = 8 mice per group). **P < .01.
SRC-3−/−HSCs have intrinsically defective function in reconstitution. (A) Schematic of noncompetitive BMT. An amount of 1 × 10⁶ BM cells (CD45.2) from WT or SRC-3−/− mice was transplanted into lethally irradiated (10 Gy) WT (CD45.1) -recipient mice. (B) Flow cytometric analysis of the frequency of donor-derived cells (CD45.2) in the PB of CD45.1-recipient mice at 16 weeks after BMT (n = 8 mice per group). (C) Schematic of competitive BMT. (D,F) Representative flow cytometric plots show donor chimerism in (D) primary and (F) secondary recipient mice at 16 weeks after BMT (n = 8 mice per group). (E,G) Lineage distribution of donor-derived (CD45.2) myeloid cells (Gr-1+ Mac-1+), B cells (B220+), and T cells (CD3e+) in the PB of (E) primary and (G) secondary recipient mice at 16 weeks after BMT (n = 8 mice per group). (H) Size distribution of 180 single-cell sorted WT and SRC-3−/− LT-HSC–derived colonies 14 days after methylcellulose culture (n = 4 mice per group). (I) Schematic of reciprocal BMT. (J) The frequency of donor-derived cells (CD45.1) in the PB of WT or SRC-3−/− (CD45.2) –recipient mice at 16 weeks after reciprocal BMT (n = 8 mice per group). **P < .01.
To investigate whether the observed defects in SRC-3−/− HSCs are cell intrinsic, we performed a reciprocal transplantation (Figure 4I). Notably, WT BM cells fully and similarly reconstituted lethally irradiated (10 Gy) WT and SRC-3−/− hosts (Figure 4J; supplemental Figure 4B). Besides, homing defect is unlikely to contribute to the repopulation defect of SRC-3−/− HSCs (supplemental Figure 4C). Taken together, these data demonstrate that SRC-3 intrinsically regulates HSC function.
Loss of SRC-3 significantly increases mitochondrial biogenesis, metabolism, and ROS production in HSCs
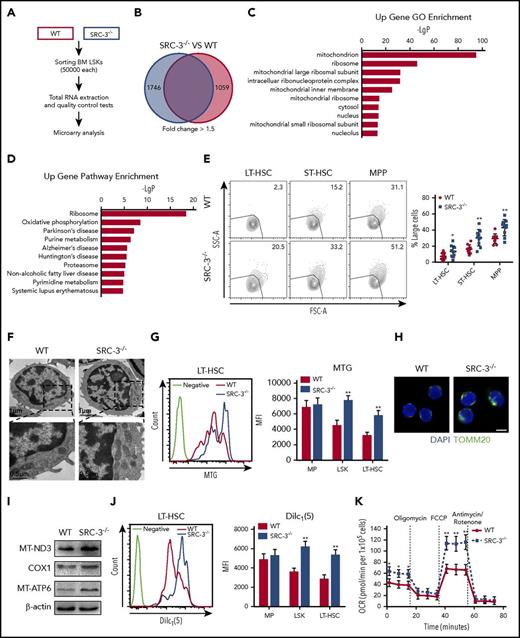
To better understand the role of SRC-3 in regulating HSC function, we performed a microarray gene expression in LSKs and identified 1746 upregulated genes and 1059 downregulated genes after SRC-3 knockout (Figure 5A-B), hinting that the gene expression pattern in SRC-3−/− HSCs differed greatly from that in WT HSCs. Notably, the dramatically upregulated genes in GO terms were related to mitochondrion (Figure 5C; supplemental Table 2). Pathway analysis of the gene expression changes revealed an evidently upregulated pathway linked to mitochondrial OXPHOS (Figure 5D), and in the ribosome pathway term, 57.4% of the enriched genes were mitochondrial ribosomal protein genes (Figure 5D; supplemental Table 3). These data indicate that mitochondrial metabolism is highly activated after SRC-3 ablation.
Loss of SRC-3 significantly increases mitochondrial biogenesis and metabolism in HSCs. (A) Workflow of the microarray analysis. (B) Transcriptomic profiling of LSKs from WT and SRC-3−/− BM. Red-colored box (left) shows the number of upregulated genes and blue-colored box (right) shows the number of downregulated genes. (C) GO enrichment analysis of upregulated genes in LSKs after SRC-3 knockout. Shown are the top 10 enriched (P < .05) GO terms. (D) KEGG pathway enrichment analysis of upregulated genes in LSKs after SRC-3 knockout. Shown are the top 10 enriched (P < .05) pathways. (A-D) Microarray data are obtained from 1 experiment with 2 biological replicates (pooled from 4 mice per group). (E) Forward-scatter (FSC-A)/side-scatter (SSC-A) analysis of LT-HSCs, ST-HSCs, and MPPs from WT or SRC-3−/− BM (n = 10 mice per group). (F) Representative TEM images of mitochondria in LSKs from WT and SRC-3−/− BM. (G) Mitochondrial mass in MPs, LSKs, and LT-HSCs from WT and SRC-3−/− BM detected by flow cytometry with MTG staining (n = 5 mice per group). MFI, mean fluorescence intensity. (H) Representative TOMM20 immunofluorescence staining in LSKs from WT and SRC-3−/− mice. Scale bar, 5 μm. (I) Western blot analysis of mtDNA-coded proteins (MT-ND3, COX1, and MT-ATP6) in WT and SRC-3−/− LSKs (n = 5 mice per group were pooled). (J) Mitochondrial membrane potential of MPs, LSKs, and LT-HSCs from WT and SRC-3−/− BM determined by flow cytometry with DilC1(5) staining (n = 5 mice per group). (K) Oxygen consumption rate (OCR) of LSKs obtained from WT and SRC-3−/− mice (n = 3 mice per group). *P < .05, **P < .01.
Loss of SRC-3 significantly increases mitochondrial biogenesis and metabolism in HSCs. (A) Workflow of the microarray analysis. (B) Transcriptomic profiling of LSKs from WT and SRC-3−/− BM. Red-colored box (left) shows the number of upregulated genes and blue-colored box (right) shows the number of downregulated genes. (C) GO enrichment analysis of upregulated genes in LSKs after SRC-3 knockout. Shown are the top 10 enriched (P < .05) GO terms. (D) KEGG pathway enrichment analysis of upregulated genes in LSKs after SRC-3 knockout. Shown are the top 10 enriched (P < .05) pathways. (A-D) Microarray data are obtained from 1 experiment with 2 biological replicates (pooled from 4 mice per group). (E) Forward-scatter (FSC-A)/side-scatter (SSC-A) analysis of LT-HSCs, ST-HSCs, and MPPs from WT or SRC-3−/− BM (n = 10 mice per group). (F) Representative TEM images of mitochondria in LSKs from WT and SRC-3−/− BM. (G) Mitochondrial mass in MPs, LSKs, and LT-HSCs from WT and SRC-3−/− BM detected by flow cytometry with MTG staining (n = 5 mice per group). MFI, mean fluorescence intensity. (H) Representative TOMM20 immunofluorescence staining in LSKs from WT and SRC-3−/− mice. Scale bar, 5 μm. (I) Western blot analysis of mtDNA-coded proteins (MT-ND3, COX1, and MT-ATP6) in WT and SRC-3−/− LSKs (n = 5 mice per group were pooled). (J) Mitochondrial membrane potential of MPs, LSKs, and LT-HSCs from WT and SRC-3−/− BM determined by flow cytometry with DilC1(5) staining (n = 5 mice per group). (K) Oxygen consumption rate (OCR) of LSKs obtained from WT and SRC-3−/− mice (n = 3 mice per group). *P < .05, **P < .01.
Cell proliferation is correlated with increased cell size and metabolism.34 Indeed, we found that SRC-3−/− mice contained higher proportions of large HSCs than WT mice (Figure 5E). To address whether SRC-3 is involved in an overall control of energy homeostasis in HSCs, we then investigated mitochondrial properties of HSCs. Specifically, HSCs from SRC-3−/− mice showed augmented mitochondrial mass by TEM, MTG staining, and mitochondrial DNA (mtDNA) quantification (Figure 5F-G; supplemental Figure 5A), as accompanied by an increased MTG/FSC-H ratio (supplemental Figure 5B). Meanwhile, we found an increase in the expressions of mitochondrial marker TOMM20 and mtDNA-coded proteins (Figure 5H-I). Furthermore, the mitochondrial membrane potential was also elevated in SRC-3−/− HSCs, determined by DilC1(5) and JC-1 probes (Figure 5J; supplemental Figure 5C). To further evaluate the functional changes of mitochondria, we measured cellular respiration and discovered an increased oxygen consumption rate in SRC-3-null LSKs (Figure 5K). Consistent with the increased metabolism, a distinctly enhanced glucose uptake in HSCs from SRC-3–defective mice was detected by flow cytometry with 2-NBDG staining (supplemental Figure 5D). Notably, there was no obvious increase in mitochondrial metabolism in MPs (Figure 5G,J; supplemental Figure 5A,D), further revealing the unique role of SRC-3 in HSCs. Thus, these findings demonstrate that SRC-3 deficiency causes obvious enhancement of mitochondrial biogenesis and metabolism in HSCs.
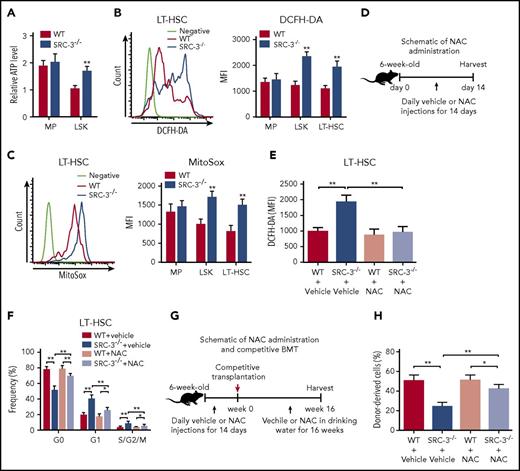
It is known that mitochondria is the major site of ATP production mainly through OXPHOS.6 As expected, we observed that ATP level was particularly enhanced in HSCs after SRC-3 deletion (Figure 6A), accompanied with markedly increased ROS, the by-product of mitochondrial metabolism (Figure 6B-C). An intrinsic metabolic switch from anaerobic glycolysis to mitochondrial OXPHOS followed by an increase in intracellular ROS drives HSCs entry into cell cycle.29 To determine whether increased ROS after SRC-3 deletion is causally implicated in the phenotypic and functional defects of HSC, WT and SRC-3−/− mice were treated with vehicle or NAC (a ROS scavenger) (Figure 6D). In line with previous studies,28,35 NAC treatment did not significantly alter ROS levels and cell proportion of WT HSCs (Figure 6E; supplemental Figure 6A). Of note, this scheme normalized the levels of ROS in SRC-3−/− LT-HSCs (Figure 6E), thereby significantly rescuing the expanded numbers, reduced quiescence, and increased proliferation observed in SRC-3−/− LT-HSCs (Figure 6F; supplemental Figure 6A-B). To further investigate the contribution of excessive ROS in repopulation defect of SRC-3−/− HSCs, we performed another competitive transplantation (Figure 6G). As shown in Figure 6H, clearance of ROS largely improved engraftment defects of SRC-3−/− donors. Collectively, consistent with microarray analysis, these data suggest that SRC-3 is essential for maintaining HSC energy homeostasis, which plays a critical role in determining the fate of HSCs.
SRC-3 deficiency leads to significantly increased ROS in HSCs, and clearance of ROS can partially rescues HSC defects in SRC-3−/−mice. (A) Relative ATP levels in MPs and LSKs from WT and SRC-3−/− BM (n = 5 mice per group). (B-C) Flow cytometric analysis of ROS levels by (B) dichlorodihydrofluorescein diacetate (DCFH-DA) and (C) MitoSox staining in MPs, LSKs, and LT-HSCs from the BM of WT and SRC-3−/− mice (n = 5 mice per group). (D) Schematic of NAC administration. (E-F) Flow cytometric analysis of the (E) ROS levels and (F) cell cycle of LT-HSCs from WT and SRC-3−/− mice after NAC administration (n = 6 mice per group). (G) Schematic of NAC administration and competitive BMT. WT and SRC-3−/− mice were injected daily with vehicle or NAC for 14 days. Then, 5 × 10⁵ BM cells (CD45.2) from these WT or SRC-3−/− mice, together with 5 × 10⁵ competitor BM cells (CD45.1), were transplanted into lethally irradiated (10 Gy) WT (CD45.1) -recipient mice. Vehicle or NAC was provided in drinking water for 16 weeks. (H) Flow cytometric analysis of the percentages of donor-derived cells (CD45.2) in the CD45.1 recipients’ PB 16 weeks after NAC administration and competitive BMT (n = 6 mice per group). *P < .05, **P < .01. FCCP, carbonyl cyanide-4 (trifluoromethoxy) phenylhydrazone.
SRC-3 deficiency leads to significantly increased ROS in HSCs, and clearance of ROS can partially rescues HSC defects in SRC-3−/−mice. (A) Relative ATP levels in MPs and LSKs from WT and SRC-3−/− BM (n = 5 mice per group). (B-C) Flow cytometric analysis of ROS levels by (B) dichlorodihydrofluorescein diacetate (DCFH-DA) and (C) MitoSox staining in MPs, LSKs, and LT-HSCs from the BM of WT and SRC-3−/− mice (n = 5 mice per group). (D) Schematic of NAC administration. (E-F) Flow cytometric analysis of the (E) ROS levels and (F) cell cycle of LT-HSCs from WT and SRC-3−/− mice after NAC administration (n = 6 mice per group). (G) Schematic of NAC administration and competitive BMT. WT and SRC-3−/− mice were injected daily with vehicle or NAC for 14 days. Then, 5 × 10⁵ BM cells (CD45.2) from these WT or SRC-3−/− mice, together with 5 × 10⁵ competitor BM cells (CD45.1), were transplanted into lethally irradiated (10 Gy) WT (CD45.1) -recipient mice. Vehicle or NAC was provided in drinking water for 16 weeks. (H) Flow cytometric analysis of the percentages of donor-derived cells (CD45.2) in the CD45.1 recipients’ PB 16 weeks after NAC administration and competitive BMT (n = 6 mice per group). *P < .05, **P < .01. FCCP, carbonyl cyanide-4 (trifluoromethoxy) phenylhydrazone.
SRC-3 deficiency-induced GCN5 downregulation is responsible for the defective phenotype and function of HSCs
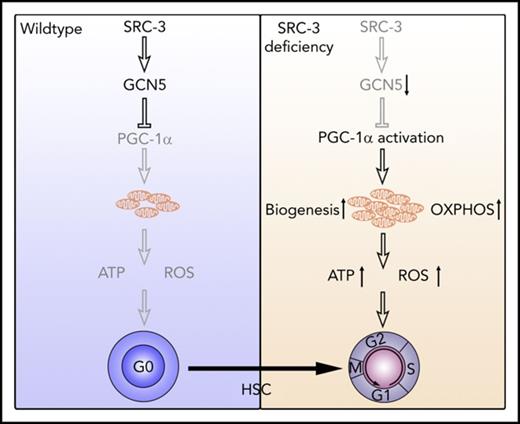
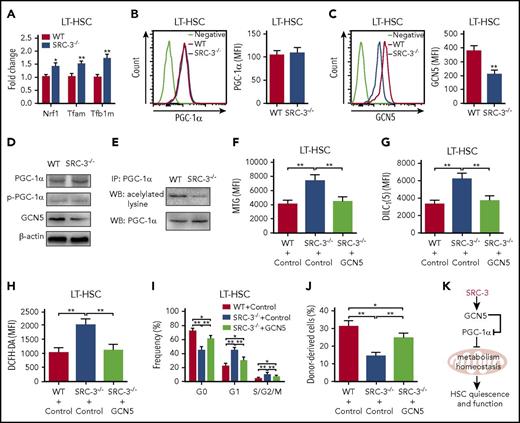
We next sought to elucidate the molecular mechanism underlying SRC-3 deficiency-induced hyperactive mitochondrial metabolism in HSCs. Consistent with the microarray data, there was no significant changes of mTOR, LKB1, SGK1, AMPK, and FoxOs, the pathways reported to be involved in the regulation of mitochondrial metabolism, in HSCs after SRC-3 deletion (supplemental Figure 7A-F). Notably, we found that Nrf-1, Tfam, and Tfb1m, the downstream target genes of the master mitochondria metabolism regulator peroxisome proliferator–activated receptor-coactivators 1α (PGC-1α),36 were significantly enhanced in SRC-3-null LT-HSCs (Figure 7A), accompanied by marked upregulation of OXPHOS-associated genes (supplemental Figure 7H). Although the expressions of PGC-1α and p-PGC-1α were not significantly changed (Figure 7B,D), a dramatic decrease in the expression of histone acetyltransferase GCN5 that is known to suppress the biological activity of PGC-1α by acetylization,37 but not the PGC-1α deacetylase SIRT1,36 was observed in HSCs with SRC-3 deletion (Figure 7C-D; supplemental Figure 7G). As expected, along with the decreased expression of GCN5, a dramatic downregulation of PGC-1α acetylation was detected when SRC-3 is deleted (Figure 7E). Finally, we determined whether the hyperactive mitochondria metabolism and subsequent defects of SRC-3−/− HSCs are due to GCN5 downregulation. As shown in Figure 7F-H, overexpression of GCN5 by lentiviral transduction significantly reduced mitochondrial mass, mitochondrial membrane potential, and ROS production in SRC-3−/− HSCs. Consequently, GCN5 overexpression markedly improved the quiescence and long-term repopulating ability of HSCs (Figure 7I-J). Taken together, our results demonstrate that SRC-3 is required to maintain the quiescence and function of HSC at least in part by regulating mitochondrial metabolism (Figure 7K).
SRC-3 deficiency-induced GCN5 downregulation is responsible for the defective phenotype and function of HSCs. (A) Relative messenger RNA expression levels of Nrf-1, Tfam, and Tfb1m in LT-HSCs from WT and SRC-3−/− BM (n = 3 mice per group). All values are presented relative to WT controls. (B-C) Flow cytometric analysis of the MFI of (B) PGC-1α and (C) GCN5 in LT-HSCs from WT and SRC-3−/− BM (n = 5 mice per group). (D) Western blot analysis of PGC-1α, p-PGC-1α, and GCN5 in WT and SRC-3−/− LSKs (n = 5-6 mice per group were pooled). (E) Acetylation level of PGC-1α in WT and SRC-3−/− LSKs (n = 6 mice per group were pooled). IP, immunoprecipitation; WB, western blot. (F-J) WT or SRC-3−/− (CD45.2) LSKs (5 × 10³) transduced with control or GCN5, together with 5 × 10⁵ competitor BM cells (CD45.1), were transplanted into lethally irradiated (10 Gy) WT (CD45.1) recipients. Flow cytometric analysis of (F) mitochondrial mass, (G) mitochondrial membrane potential, (H) ROS levels, and (I) cell cycle in donor-derived (CD45.2) LT-HSCs in the CD45.1 recipients’ BM 16 weeks after transplantation (n = 6 mice per group). (J) The percentages of donor-derived cells (CD45.2) in the CD45.1 recipients’ PB 16 weeks after transplantation (n = 6 mice per group). *P < .05, **P < .01. (K) Schematic of proposed model demonstrating how SRC-3 regulates HSCs quiescence and function via its role on metabolism homeostasis.
SRC-3 deficiency-induced GCN5 downregulation is responsible for the defective phenotype and function of HSCs. (A) Relative messenger RNA expression levels of Nrf-1, Tfam, and Tfb1m in LT-HSCs from WT and SRC-3−/− BM (n = 3 mice per group). All values are presented relative to WT controls. (B-C) Flow cytometric analysis of the MFI of (B) PGC-1α and (C) GCN5 in LT-HSCs from WT and SRC-3−/− BM (n = 5 mice per group). (D) Western blot analysis of PGC-1α, p-PGC-1α, and GCN5 in WT and SRC-3−/− LSKs (n = 5-6 mice per group were pooled). (E) Acetylation level of PGC-1α in WT and SRC-3−/− LSKs (n = 6 mice per group were pooled). IP, immunoprecipitation; WB, western blot. (F-J) WT or SRC-3−/− (CD45.2) LSKs (5 × 10³) transduced with control or GCN5, together with 5 × 10⁵ competitor BM cells (CD45.1), were transplanted into lethally irradiated (10 Gy) WT (CD45.1) recipients. Flow cytometric analysis of (F) mitochondrial mass, (G) mitochondrial membrane potential, (H) ROS levels, and (I) cell cycle in donor-derived (CD45.2) LT-HSCs in the CD45.1 recipients’ BM 16 weeks after transplantation (n = 6 mice per group). (J) The percentages of donor-derived cells (CD45.2) in the CD45.1 recipients’ PB 16 weeks after transplantation (n = 6 mice per group). *P < .05, **P < .01. (K) Schematic of proposed model demonstrating how SRC-3 regulates HSCs quiescence and function via its role on metabolism homeostasis.
Discussion
HSCs precisely control their programs to self-renew and also to differentiate into all kinds of blood cells.27 Recent studies demonstrate that HSCs have a distinct metabolic property, and HSC homeostasis is closely associated with metabolism.4,6,38 However, the underlying regulatory mechanisms have not been fully illuminated. Here, we put forward for the first time that SRC-3 is required for maintaining HSC quiescence and function by modulating mitochondrial energy metabolism.
As a coactivator, SRC-3 is present in a variety of tissues and involved in multiple biological processes. In the present study, we found that SRC-3 is preferentially expressed in murine HSCs in the hematopoietic system. This expression pattern is consistent with “HSCs fingerprint” genes reported by others,39 suggesting a unique role of SRC-3 in HSCs. As a result, we observed that mice lacking SRC-3 exhibit a significant disruption of hematopoietic stem and progenitor cell homeostasis in the BM. In addition, SRC-3 knockout brings about increased mobilization of HSCs to spleen and peripheral blood, which may be the result of decreased expression of Egr1 that is essential to inhibit the mobilization of HSCs (data not shown).40 Therefore, our data show that SRC-3 is required to maintain HSC homeostasis in the BM.
The quiescence of HSCs is of great significance for the maintenance of normal hematopoiesis.6,41 In particular, quiescent HSCs exhibit superior long-term repopulating potential than HSCs in the G1 and S/G2/M phase.33 In this study, we found that deletion of SRC-3 leads to reduced quiescence and increased proliferation of HSCs, which may contribute to the defect of SRC-3−/− HSCs in long-term repopulation. On the other hand, the restriction of the cell cycle of HSCs can prevent their premature depletion and hematopoietic failure under stress conditions,42 which could explain our findings that SRC-3−/− HSCs have increased sensitivity to genotoxic stress and radiation. Intriguingly, the finding that SRC-3 participates in the maintenance of HSC quiescence is in contrast to its function in promoting proliferation of several kinds of tumor cells,18 indicating that SRC-3 has different effects on the cell cycle depending on the cellular context, as described previously.16 Of note, we confirm that the defects of SRC-3-null HSCs are cell-intrinsic rather than microenvironment dependent by reciprocal transplantation. In addition, we observed a lymphoid skewing both in SRC-3−/− mice (data not shown) and in recipients transplanted with SRC-3−/− BM cells (Figure 4E,G), which may be due to its intrinsic role in directly inhibiting lymphocyte proliferation.16
As reported previously, SRC-3 can function as an important regulator of metabolism in a tissue- and pathway-dependent manner.11 It has been demonstrated that loss of SRC-3 leads to enhanced basal metabolic rate and energy expenditure and impaired adipocyte differentiation.14,43 In contrast, another study found that mice lacking SRC-3 displays impaired mitochondrial long-chain fatty acid metabolism in the muscle.44 However, it is unclear whether the SRC-3 can control the metabolism of HSCs. In this study, we show for the first time that SRC-3 deficiency dramatically increases mitochondrial biogenesis and metabolism in HSCs. It has been well established that a metabolic quiescence is mechanistically linked to the cell-cycle quiescence of HSCs, and elevated ROS levels will disrupt HSCs maintainance.35,45-47 Our data revealed that the robust increase in mitochondrial OXPHOS after SRC-3 deletion resulted in a distinct elevation of ROS levels in HSCs. Consequently, treatment of SRC-3–deficient mice with NAC significantly improved the defective phenotype and function of HSCs. Therefore, our data unmask that SRC-3 plays an important role in controlling mitochondrial metabolism in HSCs, which may contribute to the maintenance of HSC homeostasis.
It has been demonstrated that PGC-1α is a master regulator of mitochondrial biogenesis and metabolism.36 Notably, the activity of PGC-1α depends largely on its posttranslational modifications, especially the deacetylation.36,37 PGC-1α has been shown to be expressed in BM HSPCs and involved in regulating HSC function by affecting metabolism.8,48,49 In the present study, we did not discover significantly increased expression of PGC-1α in HSCs in the absence of SRC-3. However, an evident decrease in the expression of histone acetyltransferase GCN5 and downregulation of PGC-1α acetylation were detected in SRC-3–deficient HSCs. These findings are consistent with the report that SRC-3 can directly control the expression of GCN5 by specifically binding to its promoter region.50 Meanwhile, the downstream target genes of PGC-1α involved in controlling mitochondrial metabolism are significantly upregulated in HSCs when SRC-3 is deleted. Taking these data together, we conclude that SRC-3 deficiency-induced downregulation of GCN5 increases the activity of PGC-1α in HSCs, thereby leading to the enhancement of mitochondrial metabolism. On the other hand, overexpression of GCN5 significantly reduced mitochondrial biogenesis, metabolism, and ROS production and remarkably improved the defects of SRC-3−/− HSCs, which in turn reconfirms our speculation mentioned above.
In addition, we also found that SRC-3 expression was decreased in HSCs during aging (supplemental Figure 7I). In fact, the defects manifested in SRC-3−/− HSCs, such as loss of quiescence, augmented LT-HSCs frequency, decreased reconstitution capacity, and increased ROS production, resemble such aspects of premature aging of HSCs.30,46,51 As a previous study reported, SRC-3 is a key inhibitor of senescence.52 These findings suggest that SRC-3 may also function as an intrinsic regulator protecting HSC against senescence.
In conclusion, our study demonstrates that SRC-3 plays an important role in maintaining HSCs quiescence and function by regulating HSCs mitochondrial metabolism.
The data reported in this article have been deposited in the Gene Expression Omnibus database (accession number GSE110246).
The online version of this article contains a data supplement.
The publication costs of this article were defrayed in part by page charge payment. Therefore, and solely to indicate this fact, this article is hereby marked “advertisement” in accordance with 18 USC section 1734.
Acknowledgments
The authors thank Jianming Xu for gifting SRC-3−/− mice, Jinyong Wang for gifting CD45.1 mice, Yang Liu and Haiying Ran for technical support in flow cytometry, and Quanfang Wei for technical assistance in transmission electron microscopy.
This work was supported by grants from the National Natural Science Fund of China (nos. 81725019, 81573084, 81500087), the Program for Scientific and Technological Innovation Leader of Chongqing (CSTCKJCXLJRC06), and the Scientific Research Project of PLA (AWS16J014).
Authorship
Contribution: M.H. performed experiments, analyzed data, and wrote the paper; H.Z., S.C., and Y.X. contributed to animal experiments and data analysis; S.W., Y.T., X.W., and C.D. contributed to flow cytometric analysis; M.S., F.C., M.C., and C.W. contributed to the in vitro experiments; J.G., F.W., and Y.S. contributed to the initial experimental design and discussed the manuscript; and J.W. conceived and supervised the study, analyzed the data, and wrote and revised the manuscript.
Conflict-of-interest disclosure: The authors declare no competing financial interests.
Correspondence: Junping Wang, State Key Laboratory of Trauma, Burns and Combined Injury, Institute of Combined Injury, College of Preventive Medicine, Third Military Medical University, Gaotanyan St 30, Chongqing 400038, China; e-mail: wangjunping@tmmu.edu.cn or wangjunp@yahoo.com.

This feature is available to Subscribers Only
Sign In or Create an Account Close Modal