

TO THE EDITOR:
Iron-refractory iron deficiency anemia (IRIDA) is characterized by congenital iron deficiency (ID) that is poorly responsive to oral iron treatment. Biallelic mutations in TMPRSS6 are found in most patients with IRIDA.1 TMPRSS6 negatively regulates synthesis of the iron regulatory hormone hepcidin, and loss of TMPRSS6 causes inappropriately elevated plasma hepcidin and impaired iron absorption and recycling.2 IRIDA can be difficult to distinguish from complicated cases of acquired iron deficiency that are unresponsive to oral or parenteral iron therapy. We sought to develop an algorithm based on blood and plasma values to distinguish patients with IRIDA resulting from biallelic TMPRSS6 mutations (TMPRSS6mut/mut) from patients with chronic iron deficiency (cID) unrelated to TMPRSS6. To do this, we analyzed the hematologic, biochemical, and genetic features of a group of patients (n = 139) with cID/anemia (cID/A) referred for research testing for TMPRSS6 mutations (supplemental Figure 1, available on the Blood Web site).
Because the diagnosis of IRIDA might be considered only in patients with iron deficiency, we restricted our analysis to individuals with transferrin saturation (TfSat) ≤15% at the time of the study (Table 1). Hypoferritinemia was not used as an inclusion criterion because is not a reliable indicator of ID in IRIDA patients. Compared with wild-type controls, heterozygosity for a TMPRSS6 mutation (TMPRSS6mut/+) was associated with significant changes in mean cell volume and plasma iron, ferritin, and hepcidin, confirming a mild TMPRSS6mut/+ phenotype. As a group, the patients with biallelic TMPRSS6 mutations were slightly more anemic and iron deficient than patients in the cID group. Despite the apparent relative ID, TMPRSS6mut/mut individuals had a reduced total iron binding capacity compared with those in the TMPRSS6+/+ group and a higher plasma ferritin than those in the cID group (supplemental Figure 2). In comparison with iron-replete TMPRSS6+/+ controls and patients in the cID group, plasma hepcidin was significantly increased in TMPRSS6mut/mut patients (P < .0001; Table 1; Figure 1). Hepcidin is characteristically decreased in ID3 ; however, we found a lower median but a similar mean in the cID group compared with controls (Table 1), suggesting a physiological reason for the relative iron refractoriness of some individuals in this group. Indeed, several of these patients had a high C-reactive protein, indicative of inflammation, which can stimulate hepcidin production (supplemental Tables 1 and 4).
Comparison of patients’ hematologic and iron metabolism characteristics and derivative hepcidin and ferritin indices
| No. | Mean | Minimum | Maximum | Median | SD | SEM | Wilcoxon signed rank test 2-tailed P | |||
|---|---|---|---|---|---|---|---|---|---|---|
| vs mut/mut | vs cID | vs +/+ | ||||||||
| Age (y) | ||||||||||
| mut/mut | 43* | 13 | 1 | 50 | 10 | 12 | 2 | |||
| cID | 57 | 23 | 1 | 69 | 16 | 21 | 3 | .0006 | ||
| +/+ | 31 | 38 | 2 | 90 | 41 | 22 | 4 | <.0001 | .2886 | |
| mut/+ | 64 | 37 | 3 | 73 | 39 | 18 | 2 | <.0001 | <.0001 | .5574 |
| Hemoglobin (g/dL) | ||||||||||
| mut/mut | 43* | 9.0 | 5.7 | 11.7 | 8.8 | 1.3 | 0.2 | |||
| cID | 59 | 9.8 | 3.6 | 13.3 | 10.1 | 2.1 | 0.3 | .0005 | ||
| +/+ | 35 | 14.1 | 12.2 | 15.9 | 14.0 | 1.1 | 0.2 | <.0001 | <.0001 | |
| mut/+ | 65 | 13.5 | 8.7 | 16.5 | 13.6 | 1.5 | 0.2 | <.0001 | <.0001 | .018 |
| Mean red blood cell volume (fL) | ||||||||||
| mut/mut | 43* | 61.2 | 50.0 | 75.1 | 60.0 | 6.3 | 1.0 | |||
| cID | 59 | 72.3 | 55.6 | 96.2 | 72.1 | 8.9 | 1.2 | <.0001 | ||
| +/+ | 35 | 90.1 | 77.1 | 99.7 | 90.1 | 5.1 | 0.9 | <.0001 | <.0001 | |
| mut/+ | 65 | 86.1 | 68.1 | 107.3 | 86.2 | 6.7 | 0.8 | <.0001 | <.0001 | <.0001 |
| Iron (μg/dL) | ||||||||||
| mut/mut | 44 | 19 | 11 | 44 | 17 | 7 | 1 | |||
| cID | 59 | 30 | 12 | 72 | 26 | 14 | 2 | <.0001 | ||
| +/+ | 35 | 86 | 35 | 126 | 87 | 27 | 5 | <.0001 | <.0001 | |
| mut/+ | 66 | 74 | 15 | 176 | 70 | 35 | 4 | <.0001 | <.0001 | .0017 |
| Total iron binding capacity (μg/dL) | ||||||||||
| mut/mut | 44 | 365 | 182 | 503 | 359 | 67 | 10 | |||
| cID | 59 | 433 | 186 | 626 | 442 | 98 | 13 | <.0001 | ||
| +/+ | 35 | 404 | 311 | 564 | 392 | 74 | 12 | .0028 | .0046 | |
| mut/+ | 66 | 386 | 179 | 556 | 387 | 69 | 9 | .0007 | <.0001 | .3558 |
| Transferrin saturation (%) | ||||||||||
| mut/mut | 44 | 5 | 3 | 13 | 5 | 3 | 0 | |||
| cID | 59 | 7 | 2 | 15 | 7 | 4 | 0 | <.0001 | ||
| +/+ | 35 | 23 | 8 | 41 | 21 | 9 | 2 | <.0001 | <.0001 | |
| mut/+ | 66 | 20 | 3 | 56 | 20 | 11 | 1 | <.0001 | <.0001 | .2729 |
| Ferritin (ng/mL) | ||||||||||
| mut/mut | 44 | 96.9 | 2.8 | 511.4 | 66.2 | 100.2 | 15.1 | |||
| cID | 59 | 51.9 | 1.3 | 636.0 | 10.2 | 106.5 | 13.9 | .0004 | ||
| +/+ | 35 | 78.3 | 5.9 | 302.0 | 43.3 | 78.1 | 13.2 | .7524 | <.0001 | |
| mut/+ | 66 | 115.8 | 2.7 | 536.4 | 70.9 | 117.3 | 14.4 | .0183 | <.0001 | <.0001 |
| Zinc protoporphyrin:heme ratio (μmol/mol) | ||||||||||
| mut/mut | 24 | 120 | 474 | 253 | 249 | 99 | 20 | |||
| cID | 45 | 33 | 605 | 206 | 180 | 136 | 20 | .0069 | ||
| +/+ | 34 | 24 | 103 | 46 | 43 | 15 | 3 | <.0001 | <.0001 | |
| mut/+ | 61 | 21 | 344 | 62 | 46 | 53 | 7 | <.0001 | <.0001 | .0081 |
| Serum transferrin receptor (mg/L) | ||||||||||
| mut/mut | 19 | 14.53 | 5.18 | 28.82 | 15.19 | 5.23 | 1.2 | |||
| cID | 28 | 15.26 | 3.45 | 62.56 | 9.52 | 14.14 | 2.67 | .33 | ||
| +/+ | 23 | 3.75 | 2.3 | 8.45 | 3.23 | 1.49 | 0.31 | <.0001 | <.0001 | |
| mut/+ | 51 | 4.11 | 1.89 | 14.77 | 3.63 | 2.17 | 0.30 | <.0001 | <.0001 | .0066 |
| C-reactive protein (mg/L) | ||||||||||
| mut/mut | 42 | 0.15 | 0.03 | 2.06 | 0.09 | 0.34 | 0.05 | |||
| cID | 58 | 0.35 | 0.03 | 4.20 | 0.10 | 0.73 | 0.10 | .0046 | ||
| +/+ | 35 | 0.31 | 0.03 | 2.32 | 0.10 | 0.54 | 0.09 | .003 | .0069 | |
| mut/+ | 63 | 0.37 | 0.03 | 4.10 | 0.10 | 0.8 | 0.10 | .0005 | .0015 | .0015 |
| Hepcidin (ng/mL) | ||||||||||
| mut/mut | 44 | 69.7 | 8.8 | 219.3 | 62.8 | 45.5 | 6.9 | |||
| cID | 59 | 21.5 | 2.8 | 105.1 | 7.0 | 27.7 | 3.6 | <.0001 | ||
| +/+ | 35 | 20.8 | 4.1 | 76.9 | 14.8 | 17.3 | 2.9 | <.0001 | <.0001 | |
| mut/+ | 66 | 28.5 | 2.9 | 91.8 | 23.6 | 18.8 | 2.3 | <.0001 | <.0001 | <.0001 |
| Iron/log(ferritin) | ||||||||||
| mut/mut | 44 | 11.3 | 6.5 | 31.3 | 9.2 | 5.7 | 0.9 | |||
| cID | 59 | 31.2 | 6.4 | 122.9 | 28.5 | 18.9 | 2.5 | <.0001 | ||
| +/+ | 35 | 53.8 | 19.9 | 99.9 | 51.6 | 18.4 | 3.1 | <.0001 | <.0001 | |
| mut/+ | 66 | 40.9 | 12.1 | 103.0 | 39.0 | 19.0 | 2.3 | <.0001 | <.0001 | <.0001 |
| Transferrin saturation/log(ferritin) | ||||||||||
| mut/mut | 44 | 3.2 | 1.7 | 8.8 | 2.7 | 1.7 | 0.3 | |||
| cID | 59 | 7.1 | 2.0 | 23.9 | 6.5 | 3.5 | 0.5 | <.0001 | ||
| +/+ | 35 | 13.6 | 4.6 | 26.9 | 13.2 | 4.9 | 0.8 | <.0001 | <.0001 | |
| mut/+ | 66 | 11.0 | 3.0 | 32.8 | 11.0 | 5.6 | 0.7 | <.0001 | <.0001 | .0004 |
| Hepcidin/ferritin | ||||||||||
| mut/mut | 44 | 1.3 | 0.1 | 6.8 | 1.0 | 1.3 | 0.2 | |||
| cID | 59 | 1.2 | 0.1 | 10.8 | 0.8 | 1.6 | 0.2 | .4183 | ||
| +/+ | 35 | 0.4 | 0.1 | 1.4 | 0.3 | 0.3 | 0 | <.0001 | <.0001 | |
| mut/+ | 66 | 0.5 | 0.0 | 2.6 | 0.3 | 0.5 | 0.1 | <.0001 | <.0001 | .0533 |
| Iron/log(hepcidin) | ||||||||||
| mut/mut | 44 | 11.1 | 5.3 | 30.2 | 9.7 | 5.2 | 0.8 | |||
| cID | 59 | 32.1 | 7.0 | 80.9 | 27.2 | 17.8 | 2.3 | <.0001 | ||
| +/+ | 35 | 77.1 | 26.6 | 169 | 69.7 | 29.8 | 5.0 | <.0001 | <.0001 | |
| mut/+ | 66 | 57.7 | 9.4 | 170.8 | 49.9 | 32.0 | 3.9 | <.0001 | <.0001 | .0003 |
| Transferrin saturation/log(hepcidin) | ||||||||||
| mut/mut | 44 | 3.2 | 1.4 | 8.9 | 2.5 | 1.8 | 0.3 | |||
| cID | 59 | 7.5 | 2.1 | 19.2 | 6.2 | 4.0 | 0.5 | <.0001 | ||
| +/+ | 35 | 19.6 | 6.2 | 40.2 | 18.1 | 8.0 | 1.3 | <.0001 | <.0001 | |
| mut/+ | 66 | 15.8 | 2.3 | 48.8 | 13.9 | 9.9 | 1.2 | <.0001 | <.0001 | .0058 |
+/+, wild-type controls; cID, no TMPRSS6 mutations detected; mut/+, clinically unaffected TMPRSS6 heterozygotes; mut/mut, biallelic TMPRSS6 mutations detected; SD, standard deviation; SEM, standard error of the mean.
A concurrent complete blood count was not available for 1 patient.
![Figure 1. Plasma hepcidin and derivative indices in iron metabolism disorders. (A-C) Plasma hepcidin and derivative indices of IRIDA patients with biallelic TMPRSS6 mutations (mut/mut [n = 44]), their heterozygous relatives (mut/+ [n = 59]), wild-type controls (+/+ [n = 35]), and TMPRSS6-mutation-negative cID/A patients (cID [n = 66]). Box and whisker plots present the quartiles (box), and the 10th and 90th percentiles (whiskers). (D) Receiver operating characteristic curve analysis comparing hepcidin, ferritin, and their derivative indices in the TMPRSS6mut/mut and cID groups (see also supplemental Tables 2 and 3; supplemental Figure 2).](/view-large/figure/7591686/blood773028f1.jpeg)
Plasma hepcidin and derivative indices in iron metabolism disorders. (A-C) Plasma hepcidin and derivative indices of IRIDA patients with biallelic TMPRSS6 mutations (mut/mut [n = 44]), their heterozygous relatives (mut/+ [n = 59]), wild-type controls (+/+ [n = 35]), and TMPRSS6-mutation-negative cID/A patients (cID [n = 66]). Box and whisker plots present the quartiles (box), and the 10th and 90th percentiles (whiskers). (D) Receiver operating characteristic curve analysis comparing hepcidin, ferritin, and their derivative indices in the TMPRSS6mut/mut and cID groups (see also supplemental Tables 2 and 3; supplemental Figure 2).
Plasma hepcidin and derivative indices in iron metabolism disorders. (A-C) Plasma hepcidin and derivative indices of IRIDA patients with biallelic TMPRSS6 mutations (mut/mut [n = 44]), their heterozygous relatives (mut/+ [n = 59]), wild-type controls (+/+ [n = 35]), and TMPRSS6-mutation-negative cID/A patients (cID [n = 66]). Box and whisker plots present the quartiles (box), and the 10th and 90th percentiles (whiskers). (D) Receiver operating characteristic curve analysis comparing hepcidin, ferritin, and their derivative indices in the TMPRSS6mut/mut and cID groups (see also supplemental Tables 2 and 3; supplemental Figure 2).
Receiver operating characteristic curve analysis of plasma hepcidin levels showed an area under the curve (AUC) of 0.861 in the ability of hepcidin to distinguish the TMPRSS6mut/mut and cID groups (Figure 1D; supplemental Table 4), which was better than a similar analysis of ferritin (AUC, 0.767; Figure 1D; supplemental Figure 2C). Thus, measurement of plasma hepcidin alone can facilitate the discrimination of patients with IRIDA resulting from biallelic TMPRSS6 mutations from patients with cID/A unrelated to TMPRSS6. Nevertheless, because there was significant overlap in hepcidin levels between the TMPRSS6mut/mut and cID groups, TMPRSS6mut/+ individuals, and controls (Figure 1A), we sought to evaluate hepcidin derivative indices to distinguish these groups.
The hepcidin:ferritin ratio has been used to attempt to normalize hepcidin for iron stores.4 We found that the plasma hepcidin:ferritin ratio is a poor predictor of TMPRSS6 mutation status in patients with cID (AUC, 0.571; Table 1; Figure 1D; supplemental Figure 2D). We reasoned that normalization of hepcidin to the plasma iron or TfSat might be more physiologically relevant, because it is thought that hepcidin is responsive to the plasma concentration of diferric transferrin. The iron/log10(hepcidin) and TfSat/log10(hepcidin) ratios correlated with TMPRSS6 mutation status in iron-deficient patients (Table 1; Figure 1B-C). Plasma iron/log10(hepcidin) (AUC, 0.930) seems to be superior to Tfsat/log10(hepcidin) (AUC, 0.886) in terms of ability to discriminate cID patients from TMPRSS6mut/mut patients (Figure 1D). At a fixed sensitivity of 80%, both plasma iron/log10(hepcidin) and TfSat/log10(hepcidin) had superior specificity (91%; 95% confidence interval [CI], 78%-97% and 89%; 95% CI, 75%-95%, respectively) than plasma hepcidin alone (77%; 95% CI, 62%-99%) (supplemental Table 3). The correlation between hepcidin and ferritin suggested that substitution of ferritin for hepcidin in either of these quotients could yield a comparably sensitive and specific relationship. Of these, the iron/log10(ferritin) gave the best performance characteristics, with an AUC of .911 and a specificity of 91% (95% CI, 78%-97%) at a sensitivity of 80% (supplemental Table 3).
To compare the hepcidin and ferritin indices, we developed 2 multivariable models, 1 based on hepcidin and the other on ferritin, each normalized to iron and TfSat. Significant variables were identified by using univariable logistics (supplemental Table 4); thereafter, we obtained 2 multivariable models (supplemental Table 5).


where
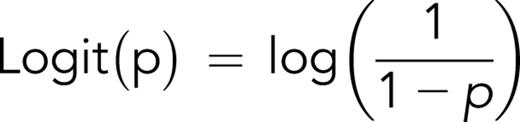
and p is the probability of a patient having 2 pathogenic TMPRSS6 alleles.
Taken together, these data suggest that measurements of hepcidin or ferritin in combination with the plasma iron and hemoglobin can predict biallelic TMPRSS6 mutations in individuals with cID/A.
We and others have consistently identified only 1 pathogenic allele in a subset of patients presenting with IRIDA.5 To address whether these individuals have an occult TMPRSS6 mutation, we determined the ability of the metrics described above to predict the genotype of iron-deficient (TfSat ≤15%) TMPRSS6mut/+ relatives of TMPRSS6mut/mut patients (supplemental Table 6). The iron/log10(hepcidin) and the iron/log10(ferritin) were the most sensitive metrics for discriminating these groups, both having a sensitivity of 93% (95% CI, 76%-99%) with specificity of 90% (95% CI, 78%-97%). We used these cutoff values to determine whether 11 iron-deficient patients with 1 discoverable TMPRSS6 allele were more likely to be phenotypically affected heterozygotes or compound heterozygotes (supplemental Table 7). Using the iron/log10(hepcidin) and the iron/log10(ferritin) measurements, 2 and 3 of the 11 patients were predicted to be a clinically affected heterozygotes, respectively; multivariable models 1 and 2 also predicted the same 2 and 3 patients to be affected heterozygotes. In all cases, as one might expect from the co-inheritance of a mutant allele and the same TMPRSS6 haplotype on the other allele, 3 pairs of genotypically concordant siblings were predicted to carry 2 mutant TMPRSS6 alleles. Thus, in many cases, it is highly likely that clinically affected individuals with 1 TMPRSS6 pathogenic variant possess a second occult mutant allele.
While this manuscript was in preparation, another group of investigators also studied the utility of normalizing plasma hepcidin to the TfSat in patients with IRIDA.6 In particular, they compared the TfSat:hepcidin ratio in TMPRSS6-mutated patients who had 1 or 2 mutated alleles and found that, in general, those individuals with a single detectable allele had a milder biochemical phenotype than those with 2 mutated alleles. We suggest that most patients with a severe clinical phenotype likely have biallelic TMPRSS6 mutations and that, in some cases, the second allele is genetically occult.
One goal of this study was to elaborate a biochemical method that might predict which patients in a group of individuals with cID/A were most likely to have biallelic TMPRSS6 mutations. The study group included only those who were poorly responsive to oral iron and had a TfSat ≤15%, that is to say, those who had a higher pretest probability of having IRIDA as a result of TMPRSS6 mutations than an unselected group with ID/A and TfSat ≤15%. Application of these tests in a broader iron-deficient population would likely result in a lower specificity. Nonetheless, one might argue that, regardless of whether or not an individual with cID/A has TMPRSS6 mutations, a relative hepcidin excess, as indicated by the normalized hepcidin or ferritin ratios or multivariable model would indicate that they would benefit from early initiation of parenteral iron therapy.
The online version of this article contains a data supplement.
Acknowledgments
The authors thank the multitude of astute clinicians who referred individual patients and families to us for the evaluation of ID/A (see supplemental Acknowledgments). Likewise, the willing participation of the patients and their family members was essential to the successful completion of this study. The authors acknowledge Susan Wong and Megan Towne for coordinating sample shipments and maintaining study records.
This study was supported by grant No. R44 DK083843 from the National Institutes of Health, National Institute of Diabetes and Digestive and Kidney Diseases (M.W. and M.D.F.) and K12 HL087164 from the National Institutes of Health, National Heart, Lung, and Blood Institute (M.M.H.)
Authorship
Contribution: M.M.H., M.W., and M.D.F conceived of the study; M.M.H., L.D.F., R.J.K., T.J., K.E.F, A.I., and M.D.F. evaluated patient characteristics; L.D.F., D.R.C., K.S.-A., F.R., K.M., A.I., and M.D.F. performed or interpreted genetic analyses; D.G. and W.B.L. designed and performed statistical analyses; P.P.-C.K. helped perform statistical analyses; G.O., K.W., P.G., V.O., and M.W. developed and performed the hepcidin immunoassay; and M.M.H., M.W., W.B.L., and M.D.F. prepared the initial draft of the manuscript, which was substantially edited by K.E.F. and reviewed by all authors.
Conflict-of-interest disclosure: G.O., P.G., K.W., V.O., and M.W. are or were employees of Intrinsic LifeSciences. G.O., K.W., and V.O. hold ownership interest in the company. M.W. served as president and chief executive officer. The remaining authors declare no competing financial interests.
Mark Westerman died on 30 August 2017.
Correspondence: Mark D. Fleming, Department of Pathology, Boston Children’s Hospital, Bader 139.1, BCH 3027, 300 Longwood Ave, Boston, MA 02115; e-mail: mark.fleming@childrens.harvard.edu.

This feature is available to Subscribers Only
Sign In or Create an Account Close Modal