Key Points
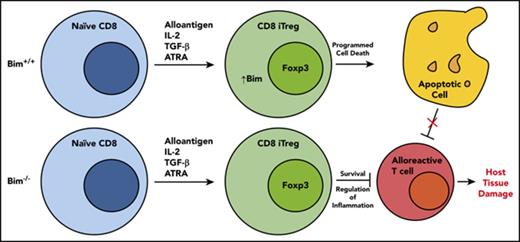
CD8+ Tregs possess a proapoptotic phenotype when compared with CD4+ Tregs, which is characterized by an inversion of the Bim/Mcl-1 ratio.
Absence of Bim in adoptively transferred CD8+ Tregs results in augmented in vivo survival and superior protection from GVHD.
Abstract
CD8+ Foxp3+ T cells (Tregs) are a potent regulatory population whose functional and ontological similarities to CD4+ Fox3+ T cells have not been well delineated. Using an experimental model of graft-versus-host disease (GVHD), we observed that CD8+ Tregs were significantly less potent than CD4+ Tregs for the suppression of GVHD. To define the mechanistic basis for this observation, we examined the T-cell repertoire and the transcriptional profile of in vivo-derived CD4+ and CD8+ Tregs that emerged early during this disease. Polyclonal and alloantigen-induced CD8+ Tregs had repertoire diversity that was similar to that of conventional CD8+ T cells, indicating that a restricted repertoire was not the proximate cause of decreased suppression. Transcriptional profiling revealed that CD8+ Tregs possessed a canonical Treg transcriptional signature that was similar to that observed in CD4+ Tregs, yet distinct from conventional CD8+ T cells. Pathway analysis, however, demonstrated that CD8+ Tregs had differential gene expression in pathways involved in cell death and survival. This was further confirmed by detailed mRNA sequence analysis and protein expression studies, which demonstrated that CD8+ Tregs had increased expression of Bim and reduced expression of Mcl-1. Transplantation with CD8+ Foxp3+ Bim−/− Tregs resulted in prolonged Treg survival and reduced GVHD lethality compared with wild-type CD8+ Tregs, providing functional confirmation that increased expression of Bim was responsible for reduced in vivo efficacy. Thus, Bim regulates the survival and suppressive capability of CD8+ Tregs, which may have implications for their use in regulatory T-cell therapy.
Introduction
Graft-versus-host disease (GVHD) is the major complication of allogeneic hematopoietic stem cell transplantation.1-3 A critical element of the pathophysiology of GVHD is the failure of effective counter regulatory mechanisms, which results in unrestrained inflammation. In particular, one of the major immunological deficits in GVHD is the inability to reconstitute the regulatory T-cell compartment, which is critical for the mitigation of GVHD severity.4-9 Although CD4+ Foxp3+ T cells (Tregs) have been the most carefully examined regulatory T-cell population in GVHD, several groups have reported the existence of a CD8+ Foxp3+ T-cell population that emerges early during GVHD, has suppressive function, and can attenuate the severity of acute GVHD.10-12 Notably, however, CD8+ Foxp3+ Tregs persist in GVHD target tissues for only a few weeks after transplantation,10 indicating that in contrast to CD4+ Tregs, these cells appear to have more limited in vivo survival. Why this suppressive population of T cells fails to persist longer in vivo, however, is not known.
The majority of CD4+ Foxp3+ Tregs undergo selection in the thymus, where recognition of self-antigens occurs, and regulatory T cells with a higher affinity than conventional T cells for these antigens emerge in the periphery.13-16 Alternatively, CD4+ Tregs can develop in the periphery from the conventional T-cell pool, and these so-called induced Tregs can be generated through transforming growth factor (TGF)-β-dependent and TGF-β-independent mechanisms.17,18 Because there is negligible Foxp3 expression on CD8+ T cells in the thymus,19 there is no discrete thymically derived CD8+ Treg population, and therefore, CD8+ Tregs are thought to emerge from the conventional T-cell pool. Therefore, the pool of CD4+ and CD8+ Tregs differs, in that thymic selection is a critical aspect of the CD4+ Treg compartment but plays almost no role in CD8+ Treg development. An important observation has been the demonstration that CD4+ nTregs and iTregs, although having similar transcriptional profiles, have minimal overlap in their T-cell repertoires.20 Thus, the ability of CD4+ nTregs and iTregs to complement each other in the maintenance of immune tolerance has been attributed to an expansion in overall T-cell receptor (TCR) diversity, which allows the CD4+ T-cell regulatory compartment to recognize more antigenic specificities.20 Conversely, the comparatively reduced ability of polyclonal CD8+ Tregs to prevent GVHD, at least in adoptive transfer studies,21 could be, in part, a result of more restricted TCR diversity, as Treg generation emanates from the conventional T-cell pool only. The diversity of the CD8+ Treg repertoire, the extent to which the transcriptional profile of these cells is similar or distinct from that of CD4+ Tregs, and how these characteristics affect the in vivo suppressive capability of CD8+ Tregs have not been critically examined.
The purpose of the current study was to comparatively analyze CD4+ and CD8+ Tregs that emerge during GVHD to determine the extent to which they are ontologically similar by examining their transcriptional profiles and T-cell repertoires. In addition, we conducted studies to define why both in vivo-derived and adoptively transferred in vitro-generated CD8+ Tregs had reduced survival and suppressive capability when compared with CD4+ Treg populations.
Material and methods
Mice
C57BL/6 (B6) (H-2b), Balb/c (H-2d), B6.PL (Thy1.1), B6.129S7-Rag-1 (B6 Rag-1), C.B10-H2b/LilMcd (Balb.B) (H-2b), B6 Foxp3EGFP, and Bim─/─ (B6 background) mice were bred in the Biomedical Resource Center at the Medical College of Wisconsin or purchased from Jackson Laboratories (Bar Harbor, ME).
Other detailed methods
All other methods are described in supplemental Methods, available on the Blood Web site.
Results
CD8+ Tregs are significantly less potent than CD4+ Tregs for the suppression of GVHD
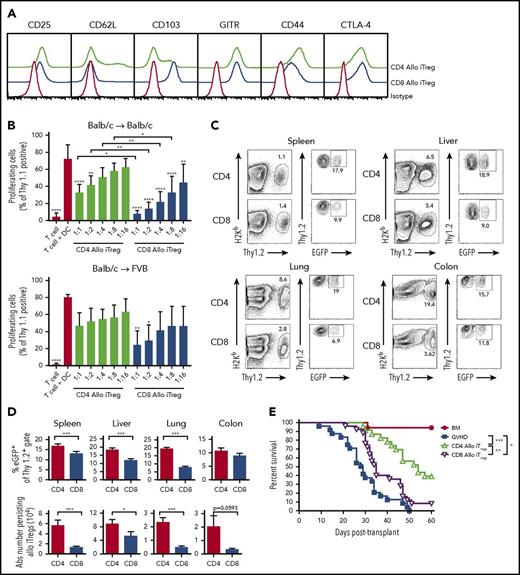
The conversion and expansion of Tregs from conventional T-cell populations has emerged as an alternative, clinically viable approach for the implementation of regulatory T-cell therapy because of the difficulty in obtaining sufficient numbers of Tregs from the peripheral blood of patients.22 These preclinical studies have revealed that in vitro-generated alloantigen-induced CD4+ Tregs are more potent than polyclonally activated CD4+ Tregs for the suppression of GVHD.23 For that reason, we conducted experiments to examine the ability of in vitro-generated alloantigen-induced CD8+ vs CD4+ Tregs to prevent GVHD in murine transplant recipients. We observed that the expansion of alloantigen-induced CD4+ and CD8+ Tregs from conventional T cells revealed no phenotypic differences, with the exception of increased expression of CD103 on CD8+ Tregs (Figure 1A). Further characterization demonstrated that neither CD4+ nor CD8+ Tregs expressed T-bet or produced interferon-γ (supplemental Figure 1A-B). Both populations had similar expression of Rorγt, which has been reported in Tregs that maintain stable regulatory function,24 but neither produced interleukin-17 (supplemental Figure 1A-B). In vitro suppression assays confirmed that both CD4+ and CD8+ alloantigen-stimulated Tregs suppressed donor T-cell proliferation in a dose-dependent fashion (Figure 1B), but that CD8+ Tregs were significantly more potent than CD4+ Tregs at nearly all Treg:effector T-cell ratios. To examine the specificity of these cells, we assessed the relative ability of CD4+ and CD8+ Tregs to suppress third-party responses. CD4+ Tregs had no suppressive effect, whereas CD8+ Tregs inhibited this response very modestly, and to a much less extent than against host antigens (Figure 1B). Thus, both CD4+ and CD8+ Tregs had preferential specificity for host as opposed to third-party antigens.
Alloantigen-induced CD8+Tregs are less potent than CD4+Tregs for the suppression of GVHD. (A) Sorted CD4+EGFP─ and CD8+EGFP─ T cells (1 × 10⁵) from Foxp3EGFP mice were cultured with Balb/c CD11c+ dendritic cells (5 × 10⁴) in the presence of all-trans retinoic acid (10 nM), IL-2 (100 U/mL), and TGF-β (10 ng/mL) for 5 days. Representative histogram depicting cell surface expression of CD25, CD62L, CD103, GITR, CD44, and CTLA-4 on in vitro-differentiated alloantigen-induced CD4+ and CD8+ Tregs vs staining with an isotype control antibody. (B) Purified B6.PL Thy1.1+ T cells (1 × 10⁵) were cultured with Balb/c CD11c+ dendritic cells (5 × 10⁴) in the presence of varying ratios of Thy1.2+ CD4+ Tregs (green bars), or CD8+ Tregs (blue bars) that were generated against either Balb/c (Balb/c→ Bab/c) or FVB (Balb/c→FVB) dendritic cells after 5 days in culture. Control wells are depicted as red bars. Data are presented as the mean percentage of triplicate wells of proliferating Thy1.1+ T cells ± 1 SD and represent cumulative results of 3 to 6 experiments. (C-D) Lethally irradiated Balb/c mice were transplanted with B6.PL BM and spleen cells (adjusted to yield a T-cell dose of 0.6 × 10⁶ αβ T cells). Cohorts of animals then received an equivalent number of CD4+ or CD8+ in vitro-differentiated Thy1.2+ Tregs. Representative dot plots showing the percentage of H-2Kb+ Thy1.2+ CD4+ or CD8+ iTregs in the spleen, liver, lung, or colon of recipient mice 10 days posttransplantation are shown in (C). The absolute number and percentage of donor-derived CD4+ (red bars) and CD8+ (blue bars) Thy1.2+ EGFP+ T cells in the specified tissue sites on day 10 are depicted in (D). Data are from 8 to 12 mice per tissue from 3 experiments. (E) Lethally irradiated Balb/c mice were transplanted with 8 × 10⁶ B6.PL (Thy1.1+) BM alone (red circles, n = 17) or together with spleen cells (adjusted to yield a dose of 0.6 × 10⁶ αβ T cells). Animals transplanted with adjunctive spleen cells received no other cells (blue squares, n = 24), 0.6 × 10⁶ in vitro-generated alloantigen-induced CD4+ Tregs (green triangles, n = 23), or 0.6 × 10⁶ alloantigen-induced CD8+ Tregs (purple triangles, n = 25). Survival is shown. Data are the cumulative results of 5 experiments. *P < .05; **P < .01; ***P < .001; ****P < .0001.
Alloantigen-induced CD8+Tregs are less potent than CD4+Tregs for the suppression of GVHD. (A) Sorted CD4+EGFP─ and CD8+EGFP─ T cells (1 × 10⁵) from Foxp3EGFP mice were cultured with Balb/c CD11c+ dendritic cells (5 × 10⁴) in the presence of all-trans retinoic acid (10 nM), IL-2 (100 U/mL), and TGF-β (10 ng/mL) for 5 days. Representative histogram depicting cell surface expression of CD25, CD62L, CD103, GITR, CD44, and CTLA-4 on in vitro-differentiated alloantigen-induced CD4+ and CD8+ Tregs vs staining with an isotype control antibody. (B) Purified B6.PL Thy1.1+ T cells (1 × 10⁵) were cultured with Balb/c CD11c+ dendritic cells (5 × 10⁴) in the presence of varying ratios of Thy1.2+ CD4+ Tregs (green bars), or CD8+ Tregs (blue bars) that were generated against either Balb/c (Balb/c→ Bab/c) or FVB (Balb/c→FVB) dendritic cells after 5 days in culture. Control wells are depicted as red bars. Data are presented as the mean percentage of triplicate wells of proliferating Thy1.1+ T cells ± 1 SD and represent cumulative results of 3 to 6 experiments. (C-D) Lethally irradiated Balb/c mice were transplanted with B6.PL BM and spleen cells (adjusted to yield a T-cell dose of 0.6 × 10⁶ αβ T cells). Cohorts of animals then received an equivalent number of CD4+ or CD8+ in vitro-differentiated Thy1.2+ Tregs. Representative dot plots showing the percentage of H-2Kb+ Thy1.2+ CD4+ or CD8+ iTregs in the spleen, liver, lung, or colon of recipient mice 10 days posttransplantation are shown in (C). The absolute number and percentage of donor-derived CD4+ (red bars) and CD8+ (blue bars) Thy1.2+ EGFP+ T cells in the specified tissue sites on day 10 are depicted in (D). Data are from 8 to 12 mice per tissue from 3 experiments. (E) Lethally irradiated Balb/c mice were transplanted with 8 × 10⁶ B6.PL (Thy1.1+) BM alone (red circles, n = 17) or together with spleen cells (adjusted to yield a dose of 0.6 × 10⁶ αβ T cells). Animals transplanted with adjunctive spleen cells received no other cells (blue squares, n = 24), 0.6 × 10⁶ in vitro-generated alloantigen-induced CD4+ Tregs (green triangles, n = 23), or 0.6 × 10⁶ alloantigen-induced CD8+ Tregs (purple triangles, n = 25). Survival is shown. Data are the cumulative results of 5 experiments. *P < .05; **P < .01; ***P < .001; ****P < .0001.
To examine the ability of these cell populations to prevent lethal GVHD, animals were transplanted with bone marrow (BM) and wild-type T cells alone or together with a 1:1 ratio of either CD4+ or CD8+ Tregs. We observed that there was a significantly higher percentage of CD4+ as opposed to CD8+ Tregs that retained Foxp3 expression (Figure 1C-D), as well as an increased absolute number of CD4+ Tregs in all tissue sites (Figure 1D). Furthermore, mice reconstituted with alloantigen-derived CD4+ Tregs had superior survival when compared with either wild-type GVHD controls or animals transplanted with CD8+ Tregs (Figure 1E). CD8+ Tregs also protected animals from lethal GVHD, but the effects were much more modest. To verify that these results were not strain-specific, we examined the suppressive capability of CD4+ and CD8+ Tregs in an alternative B6→FVB GVHD model. We observed that CD8+ Tregs were significantly more suppressive than CD4+ Tregs at inhibiting in vitro proliferative responses, and that both CD4+ and CD8+ Tregs had preferential specificity for host as opposed to third-party antigens (supplemental Figure 2A). However, in vivo studies again revealed that animals reconstituted with CD4+ Tregs had superior survival than mice that received CD8+ Tregs (supplemental Figure 2B). Collectively, these results indicated that alloantigen-induced CD8+ Tregs were significantly less potent than CD4+ Tregs for GVHD prevention.
CD8+ Tregs induced during GVHD have a diverse T-cell repertoire that overlaps with that of CD8+ Tcons
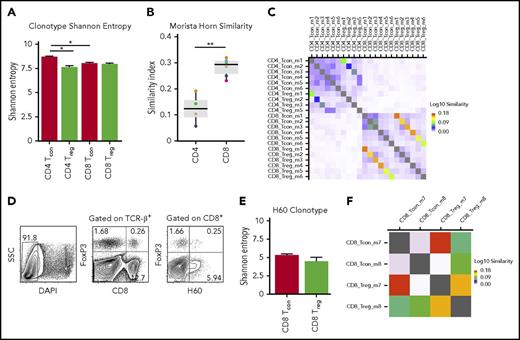
Prior studies have shown that the diversity of the CD4+ Treg repertoire directly correlates with the ability of this population to control autoimmunity.25-27 Thus, one possible explanation for the reduced ability of CD8+ Tregs to prevent lethal GVHD is that these cells possess a less diverse T-cell repertoire. Because there is negligible constitutive expression of Foxp3 on naive CD8+ T cells, the emergence of CD8+ Tregs during GVHD is essentially a result of the in vivo induction of these cells from the conventional T-cell compartment. For that reason, we analyzed the T-cell repertoires of in vivo-induced CD8+ and CD4+ Tregs, along with their conventional CD8+ and CD4+ T-cell counterparts, to compare biologically similar Treg populations. TCR diversity was assessed using the Shannon entropy index because it equally weights the number of unique clonotypes and the dominance of each clonotype in the calculation.28,29 These studies revealed that there was no difference in the average entropy score for CD8+ Tregs compared with CD8+ Tcons, whereas there was a significant decrease in diversity in CD4+ Tregs when compared with CD4+ Tcons (Figure 2A). No difference in diversity was observed between CD4+ and CD8+ Treg populations. To more critically characterize the TCR repertoire, we employed the Morisita Horn Index (MHI) to define the extent of repertoire overlap between specific populations of CD4+ or CD8+ T cells from individual mice. The median MHI for CD4+ Foxp3+ vs CD4+ Foxp3− T cells was 0.12 (range, 0.06-0.19; Figure 2B), indicative of minimal repertoire overlap, which is consistent with previous findings.30,31 Conversely, the median MHI for CD8+ Tregs vs CD8+ Tcons was 0.29 (range, 0.23-0.32), which was significantly higher than in CD4+ Tregs, indicative of increased sequence sharing between these 2 populations. MHI values for corresponding CD4+ and CD8+ Tregs and their conventional T-cell counterparts from individual mice are depicted in Figure 2C. In addition, we found no evidence of selective usage of a particular V family gene or J segments in CD8+ Tregs compared with CD8+ Tcons (supplemental Figure 3A-B).
CD8+Tregs and Tcons have similar T-cell receptor repertoire diversity. Lethally irradiated (900 cGy) Balb/c mice were transplanted with B6 Rag-1 BM (5 × 10⁶) and flow-sorted CD4+ Foxp3− (0.4 × 10⁶) and CD8+ Foxp3− (0.2 × 10⁶) T cells from B6 Foxp3EGFP animals. Mice were euthanized on day 7 posttransplantation, and donor-derived CD4+ Foxp3+, CD8+ Foxp3+, CD4+ Foxp3−, and CD8+ Foxp3− T cells were sorted from the spleens and livers of recipients. (A) Shannon entropy of CD4+ Foxp3+ (n = 4), CD4+ Foxp3− (n = 6), CD8+ Foxp3+ (n = 6), and CD8+ Foxp3− (n = 6) T-cell populations. Error bars represent standard error of the mean. (B) Morsita Horn similarity index of CD4+ Tregs and Tcons (n = 4) and CD8+ Treg and Tcons (n = 6). Colored circles denote individual mice. (C) Heat map showing Morsita Horn diversity overlap of TCRβ clonotype expression in CD4+ and CD8+ Treg and Tcon populations from individual mice. (D) Lethally irradiated (900 cGy) Balb.B mice were transplanted with B6 Foxp3EGFP BM (5 × 10⁶) and spleen cells (adjusted to yield a dose of 20 × 106 αβ T cells). Animals were euthanized on day 7 posttransplantation, and cells were harvested from the liver and spleen. Representative contour plot depicting CD8+ H60+ Foxp3+ and CD8+ H60+ Foxp3− T cells. (E) Shannon entropy of CD8+ H60+ Treg (n = 2) and Tcon (n = 2) populations. Error bars represent standard error of the mean. (F) Heat map showing Morsita Horn diversity overlap of TCRβ clonotype expression in CD8+ H60+ Foxp3+ and Foxp3− T cells from individual mice. *P < .05; **P < .01.
CD8+Tregs and Tcons have similar T-cell receptor repertoire diversity. Lethally irradiated (900 cGy) Balb/c mice were transplanted with B6 Rag-1 BM (5 × 10⁶) and flow-sorted CD4+ Foxp3− (0.4 × 10⁶) and CD8+ Foxp3− (0.2 × 10⁶) T cells from B6 Foxp3EGFP animals. Mice were euthanized on day 7 posttransplantation, and donor-derived CD4+ Foxp3+, CD8+ Foxp3+, CD4+ Foxp3−, and CD8+ Foxp3− T cells were sorted from the spleens and livers of recipients. (A) Shannon entropy of CD4+ Foxp3+ (n = 4), CD4+ Foxp3− (n = 6), CD8+ Foxp3+ (n = 6), and CD8+ Foxp3− (n = 6) T-cell populations. Error bars represent standard error of the mean. (B) Morsita Horn similarity index of CD4+ Tregs and Tcons (n = 4) and CD8+ Treg and Tcons (n = 6). Colored circles denote individual mice. (C) Heat map showing Morsita Horn diversity overlap of TCRβ clonotype expression in CD4+ and CD8+ Treg and Tcon populations from individual mice. (D) Lethally irradiated (900 cGy) Balb.B mice were transplanted with B6 Foxp3EGFP BM (5 × 10⁶) and spleen cells (adjusted to yield a dose of 20 × 106 αβ T cells). Animals were euthanized on day 7 posttransplantation, and cells were harvested from the liver and spleen. Representative contour plot depicting CD8+ H60+ Foxp3+ and CD8+ H60+ Foxp3− T cells. (E) Shannon entropy of CD8+ H60+ Treg (n = 2) and Tcon (n = 2) populations. Error bars represent standard error of the mean. (F) Heat map showing Morsita Horn diversity overlap of TCRβ clonotype expression in CD8+ H60+ Foxp3+ and Foxp3− T cells from individual mice. *P < .05; **P < .01.
To address this question more precisely, we then employed a B6→Balb.B transplantation model in which donor and recipient differ only at multiple minor histocompatibility antigens. One of the major immunodominant minor antigens is termed H60,32,33 and prior studies have shown that CD8+ H60+ T cells constitute the major alloantigen-induced CD8+ T-cell population that emerges early during GVHD.34 Using this approach, defined populations of CD8+ H60+ Foxp3− and CD8+ H60+ Foxp3+ T cells could be identified and subsequently flow sorted from recipients 7 days posttransplantation (Figure 2D). We observed, not unexpectedly, that there was less diversity of antigen-specific H60+ T cells overall when compared with polyclonal CD8+ Tcons and Tregs. This was more pronounced in CD8+ H60+ Tregs, but did not significantly differ from that observed in alloantigen-induced CD8+ Tcons (Figure 2E). The mean MHI value for alloantigen-specific CD8+ Tregs and Tcons was 0.27 (range, 0.21-0.34), which was similar to that observed for polyclonal CD8+ T-cell populations (Figure 2B). A heat map showing Morsita Horn repertoire diversity overlap values for individual mice is depicted in Figure 2F. Collectively, these data indicate that an overall lack of repertoire diversity was not a potential explanation for the diminished ability of CD8+ Tregs to prevent GVHD.
CD8+ Tregs have a transcriptional profile that is similar to CD4+ Tregs and distinct from conventional CD8+ T cells
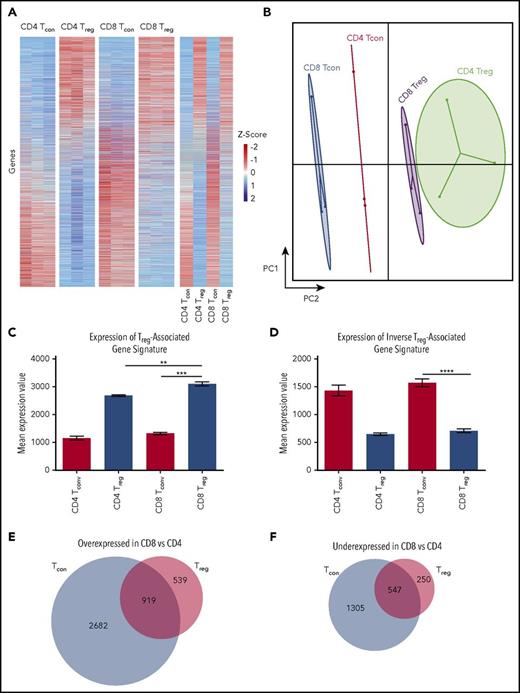
Given that CD8+ Tregs did not have a demonstrable restriction in TCR repertoire diversity, we examined the transcriptional profile of in vivo-induced CD4+ and CD8+ Tregs, along with their conventional CD8+ and CD4+ T-cell counterparts, to determine whether there were any differences that would explain why CD8+ Tregs were less potent in vivo. Differential gene expression analysis by mRNA sequencing demonstrated that CD8+ Tregs had gene expression profiles that were more similar to CD4+ Tregs than to either conventional CD8+ or CD4+ T cells (Figure 3A). This was clearly demonstrated using principal component analysis where there was a significant difference in PC2 between CD8+ Tcons and CD8+ Tregs with relatively little distance on PC1 between CD8+ and CD4+ Tregs (Figure 3B). When we analyzed CD8+ Tregs based on canonical gene expression signatures derived from CD4+ Tcons and CD4+ Tregs),35 we found much more similarity between CD8+ Tregs and CD4+ Tregs compared with CD8+ Tcon cells (Figure 3C-D).
CD8+Tregs and CD4+Tregs have similar transcriptional profiles. Lethally irradiated (900 cGy) Balb/c mice were transplanted with B6 Rag-1 BM (5 × 10⁶) and flow-sorted CD4+ Foxp3− (0.4 × 10⁶) and CD8+ Foxp3− (0.2 × 10⁶) T cells from B6 Foxp3EGFP animals. Mice were euthanized on day 7 posttransplantation, and donor-derived CD4+ Foxp3+, CD8+ Foxp3+, CD4+ Foxp3−, and CD8+ Foxp3− T cells were sorted from the spleens and livers of recipients. (A) Unsupervised hierarchical clustering on differentially expressed genes from CD4+ and CD8+ Tregs and Tcons. Each column represents an individual sample, and each row represents a single gene. Expression values are scaled by rows with values greater than the mean shown in red and values less than the mean shown in blue, with intensity of color corresponding to relative level of expression. Data are from 3 replicates that were each derived from pooled samples from 7 mice. (B) Principal component analysis of CD4+ and CD8+ Treg and Tcon populations showing that populations primarily differ across principal component 2, with CD8+ Tregs more closely related to CD4+ Tregs than CD4+ and CD8+ Tcon populations. (C-D) Expression level of a canonical Treg-associated (Pacholczyk et al31 and Feuerer et al39 ) and a Tcon (inverse Treg) gene signature across CD8+ Treg, CD8+ Tcon, CD4+ Treg, and CD4+ Tcon samples. (E-F) Venn diagram showing the number of genes significantly overexpressed (E) or underexpressed (F) in CD8+ T-cell populations relative to CD4+ T-cell populations. **P < .01; ***P < .001; ****P < .0001. PC2, Principal Component 2.
CD8+Tregs and CD4+Tregs have similar transcriptional profiles. Lethally irradiated (900 cGy) Balb/c mice were transplanted with B6 Rag-1 BM (5 × 10⁶) and flow-sorted CD4+ Foxp3− (0.4 × 10⁶) and CD8+ Foxp3− (0.2 × 10⁶) T cells from B6 Foxp3EGFP animals. Mice were euthanized on day 7 posttransplantation, and donor-derived CD4+ Foxp3+, CD8+ Foxp3+, CD4+ Foxp3−, and CD8+ Foxp3− T cells were sorted from the spleens and livers of recipients. (A) Unsupervised hierarchical clustering on differentially expressed genes from CD4+ and CD8+ Tregs and Tcons. Each column represents an individual sample, and each row represents a single gene. Expression values are scaled by rows with values greater than the mean shown in red and values less than the mean shown in blue, with intensity of color corresponding to relative level of expression. Data are from 3 replicates that were each derived from pooled samples from 7 mice. (B) Principal component analysis of CD4+ and CD8+ Treg and Tcon populations showing that populations primarily differ across principal component 2, with CD8+ Tregs more closely related to CD4+ Tregs than CD4+ and CD8+ Tcon populations. (C-D) Expression level of a canonical Treg-associated (Pacholczyk et al31 and Feuerer et al39 ) and a Tcon (inverse Treg) gene signature across CD8+ Treg, CD8+ Tcon, CD4+ Treg, and CD4+ Tcon samples. (E-F) Venn diagram showing the number of genes significantly overexpressed (E) or underexpressed (F) in CD8+ T-cell populations relative to CD4+ T-cell populations. **P < .01; ***P < .001; ****P < .0001. PC2, Principal Component 2.
We then evaluated gene expression differences between CD8+ and CD4+ Tregs by focusing on those genes that were differentially expressed as a result of the regulatory function of CD8+ Tregs. We analyzed genes that were over- or underexpressed in CD8+ Tcons compared with CD4+ Tcons to characterize genes associated with conventional CD8+ T-cell effector function (effector group): 2682 genes were overexpressed and 1305 genes underexpressed in CD8+ Tcons compared with CD4+ Tcons (Figure 3E-F), indicating that there were 3987 genes that formed the effector gene module. We then evaluated genes that were over- or underexpressed in CD8+ Tregs and Tcons compared with CD4+ T cells which we termed the CD8 module. There were 919 genes with increased expression and 547 genes with decreased expression. Thus, 1466 genes made up the CD8 module. Finally, we evaluated genes that were over- or underexpressed in CD8+ Tregs compared with CD4+ Tregs, which we termed the regulatory module. There were 539 genes that were overexpressed and 250 that were underexpressed in CD8+ Tregs compared with CD4+ Tregs. Gene expression values for all samples are included in supplemental Table 1. Collectively, these results demonstrated that CD8+ Tregs have a transcriptome that is much more similar to CD4+ Tregs than to CD8+ Tcons, and there are fewer transcriptional differences between CD8+ and CD4+ regulatory T cells than between conventional CD8+ and CD4+ T cells.
CD8+ Tregs differ from CD4+ Tregs with respect to pathways involved in cell death
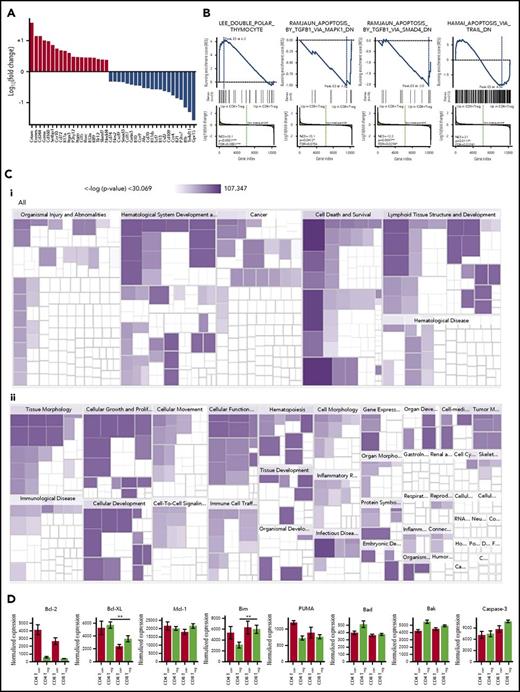
Given that there was not complete overlap in the transcriptional signatures of CD8+ and CD4+ Tregs, we sought to define differences that would provide insight into their biological function. We first characterized genes that had the greatest fold difference between CD8+ and CD4+ Tregs excluding genes that were differentially expressed in CD8+ Tcons compared with CD4+ Tcons (Figure 4A). We observed that there was increased expression in CD8+ Tregs of genes that are commonly found in CD8+ Tcons (ie, Crtam, Eomes, CD244, granzyme A, and CD160). Genes that had decreased expression in CD8+ Tregs included the tyrosine kinase Ror2, Klrg1, CX3CL1, interleukin (IL)-21, IL-13, and GM-CSF. Using Gene Set Enrichment Analysis on genes that had increased expression in CD8+ Tregs resulted in pathways involved in cell death such as the double polar thymocyte pathway (enrichment score, 6.3; false discovery rate [FDR], 0.0002; Figure 4B). Conversely, we found a decrease in CD8+ Tregs in pathways that induced apoptosis via TGF-β1 (enrichment score, −1.0; FDR, 0.21) and SMAD4 (enrichment score, −2.0; FDR, 0.047). There was no difference between CD4+ and CD8+ Tregs in the apoptotic pathway induced by TRAIL (TNF-related apoptosis-inducing ligand).
Gene expression differences between CD8+and CD4+Tregs. (A) Waterfall plot of genes with significantly increased expression (red bars) or decreased expression (blue bars) in in vivo-induced CD8+ Tregs relative to in vivo-induced CD4+ Tregs, but not in CD8+ Tcons relative to CD4+ Tcons. (B) Gene pathways that are differentially expressed in in vivo-induced CD8+ versus in vivo-induced CD4+ Tregs by Gene Set Enrichment analysis. (Ci-ii) Gene pathways that are differentially expressed in in vivo-induced CD8+ vs in vivo-induced CD4+ Tregs by Ingenuity Pathway analysis. (D) Expression of selected genes coding for antiapoptotic and proapoptotic proteins in in vivo-induced CD8+ Treg, CD8+ Tcon, CD4+ Treg, and CD4+ Tcon cells. **P < .01.
Gene expression differences between CD8+and CD4+Tregs. (A) Waterfall plot of genes with significantly increased expression (red bars) or decreased expression (blue bars) in in vivo-induced CD8+ Tregs relative to in vivo-induced CD4+ Tregs, but not in CD8+ Tcons relative to CD4+ Tcons. (B) Gene pathways that are differentially expressed in in vivo-induced CD8+ versus in vivo-induced CD4+ Tregs by Gene Set Enrichment analysis. (Ci-ii) Gene pathways that are differentially expressed in in vivo-induced CD8+ vs in vivo-induced CD4+ Tregs by Ingenuity Pathway analysis. (D) Expression of selected genes coding for antiapoptotic and proapoptotic proteins in in vivo-induced CD8+ Treg, CD8+ Tcon, CD4+ Treg, and CD4+ Tcon cells. **P < .01.
To complement this approach, we used Ingenuity pathway analysis to evaluate gene pathways that were differentially expressed in CD8+ Tregs (Figure 4C). The 6 disease and function pathways that were expressed in CD8+ Tregs were cell death, necrosis, apoptosis, viral infection, quantity of lymphatic system cells, and proliferation of immune cells. Interestingly, pathways that were the most differentially expressed in CD8+ Tregs compared with CD4+ Tregs were focused on PI3 kinase/AKT signaling and Th1/Th2 T-cell activation. The pathway most overexpressed in CD8+ Tregs focused on cell death and survival. The prior observation using Gene Set Enrichment Analysis, coupled with the current Ingenuity pathway analysis data, led us to more critically analyze specific genes involved in cell death. To that end, we focused specifically on genes that make up the mitochondrial apoptotic pathway, as studies had shown this pathway plays an important role in CD4+ Treg biology.36 We observed that CD4+ Tregs had increased expression of bcl-xL, whereas CD8+ Tregs had augmented expression of bim (Figure 4D). There was no difference in expression of bcl-2, Mcl-1, PUMA, bad, bak, or caspase 3. Overall, these studies indicated that CD8+ Tregs had significant differences from CD4+ Tregs with respect to pathways involved in cell death, including augmented expression of Bim which plays a critical role in the regulation of apoptosis.37
CD8+ Tregs have a proapoptotic phenotype
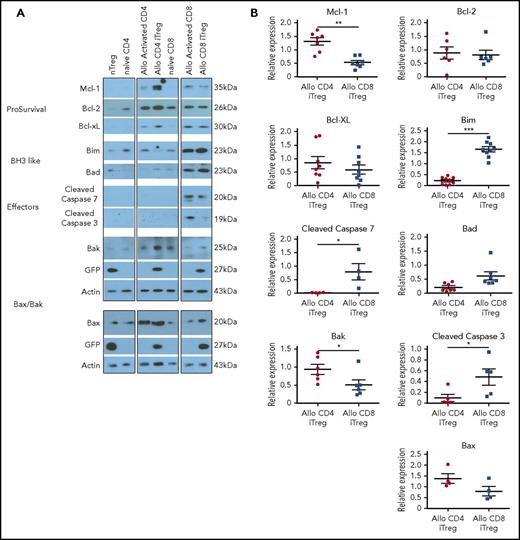
According to the transcriptional analysis, which indicated that CD8+ and CD4+ Tregs differed with respect to a few genes involved in the intrinsic apoptosis pathway, we conducted studies to verify whether these observations were valid at the protein level. To address this question, we examined pro- and antiapoptotic protein expression in in vitro-generated alloantigen-induced CD8+ vs CD4+ Tregs, as these cells differed significantly with respect to their ability to mitigate GVHD (Figure 1). We observed that CD4+ Tregs had significantly increased expression of the antiapoptotic protein Mcl-1 relative to CD8+ Tregs, whereas there was no difference in expression of bcl-2 or bcl-xL (Figure 5A-B). Expression of Bak, which intercalates into the mitochondrial membrane and facilitates outer membrane pore formation38 was also found to be augmented in CD4+ Tregs. Examination of BH3-only proteins revealed that Bim was significantly augmented in alloantigen-induced CD8+ Tregs relative to CD4+ Tregs, similar to what we observed in the transcriptional analysis. The downstream effects of the differential expression of Mcl-1, Bak, and Bim in CD8+ Tregs relative to CD4+ Tregs was a significant increase in the expression of the executioner caspases 3 and 7, indicative of a more proapoptotic phenotype. To confirm that increased caspase protein expression was of functional significance, we conducted caspase activity assays, which demonstrated an increase in caspase 3 and 7 activity in CD8+ as opposed to CD4+ Tregs (supplemental Figure 4A-B). Notably, however, CD8+ Tregs had only minimal evidence of apoptosis when assessed by membrane stability (ie, annexin and 7-AAD positivity) and did not differ in this regard from CD4+ Tregs (supplemental Figure 4C-D).
CD8+Tregs have a proapoptotic phenotype. (A-B) Immunoblot analysis of pro- and antiapoptotic proteins derived from in vitro-generated alloantigen-induced CD4+ and CD8+ Tregs. Representative immunoblots are depicted in (A), and cumulative results of quantitative densitometry analysis from 4 to 9 replicates per blot are shown in (B). *P < .05; **P < .01; ***P < .001.
CD8+Tregs have a proapoptotic phenotype. (A-B) Immunoblot analysis of pro- and antiapoptotic proteins derived from in vitro-generated alloantigen-induced CD4+ and CD8+ Tregs. Representative immunoblots are depicted in (A), and cumulative results of quantitative densitometry analysis from 4 to 9 replicates per blot are shown in (B). *P < .05; **P < .01; ***P < .001.
Bim is critical for the survival of CD8+ Foxp3+ Tregs during GVHD
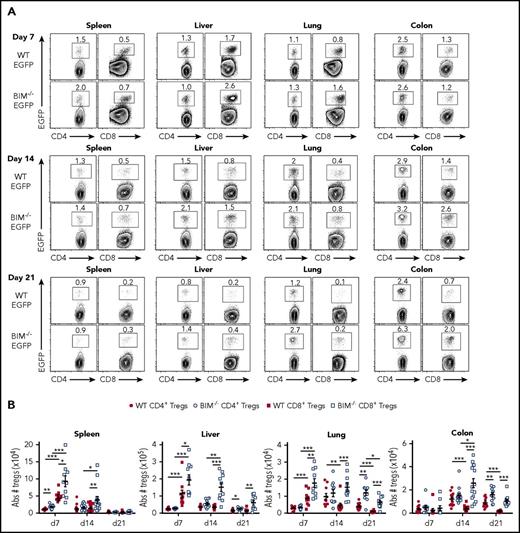
Bim is the primary antagonist of Mcl-1, which has been shown to be critical for the survival of CD4+ Treg cells.36 Given the increased expression of Bim in CD8+ Tregs, we sought to determine whether Bim was functionally important, and thereby a primary determinant of CD8+ Treg survival during GVHD. To address this issue, we examined in vivo CD4+ and CD8+ Treg induction so that comparable Treg populations were being assessed in animals undergoing GVHD. Recipient animals were transplanted with Rag-1 BM plus CD4+ Foxp3 EGFP− and CD8+ Foxp3EGFP− T cells from either Foxp3EGFP or Bim−/− Foxp3EGFP mice. As previously shown,10 wild-type CD8+ Tregs were more abundant than wild-type CD4+ Tregs in spleen, liver, and lung by day 7 posttransplant, although at later points, CD4+ Tregs became the dominant Treg population in the lung and colon as a result of reduced CD8+ Treg survival (Figure 6A-B). We observed that the absence of Bim in the CD8+ Treg compartment resulted in an increase in absolute CD8+ Treg numbers in all organs when compared with wild-type CD8+ Tregs. This effect was most pronounced in GVHD target organs in which CD8+ Tregs were augmented on days 7, 14, and 21 in the liver and lung and on days 14 and 21 in the colon (Figure 6B). The effect of Bim expression on CD4+ Tregs was more modest, although there was an increased number of CD4+ Bim−/− Tregs in the liver, lung, and colon of animals 3 weeks posttransplantation. Collectively, these data indicated that Bim regulated the survival of CD8+ Tregs in vivo.
Bim regulates the survival of in vivo-induced CD8+Tregs during GVHD. Lethally irradiated Balb/c mice were transplanted with B6 Rag-1 BM (8 × 10⁶) plus 0.4 × 10⁶ CD4+ and 0.25 × 10⁶ CD8+ EGFP− T cells from either Foxp3EGFP or Bim−/−Foxp3EGFP mice. Cohorts of mice were euthanized on days 7, 14, and 21 posttransplantation, and cells were harvested from the spleen, liver, lung, and colon. (A) Representative contour plots depicting the percentage of donor-derived CD4+ and CD8+ Foxp3+ or Bim−/−Foxp3+ Tregs present in the specified tissues is shown. (B) The absolute number of wild type or Bim−/− CD4+ and CD8+ Tregs in these same tissue sites. Data are derived from 10 to 15 mice per tissue at each point. *P < .05; **P < .01; ***P < .001.
Bim regulates the survival of in vivo-induced CD8+Tregs during GVHD. Lethally irradiated Balb/c mice were transplanted with B6 Rag-1 BM (8 × 10⁶) plus 0.4 × 10⁶ CD4+ and 0.25 × 10⁶ CD8+ EGFP− T cells from either Foxp3EGFP or Bim−/−Foxp3EGFP mice. Cohorts of mice were euthanized on days 7, 14, and 21 posttransplantation, and cells were harvested from the spleen, liver, lung, and colon. (A) Representative contour plots depicting the percentage of donor-derived CD4+ and CD8+ Foxp3+ or Bim−/−Foxp3+ Tregs present in the specified tissues is shown. (B) The absolute number of wild type or Bim−/− CD4+ and CD8+ Tregs in these same tissue sites. Data are derived from 10 to 15 mice per tissue at each point. *P < .05; **P < .01; ***P < .001.
Absence of Bim in adoptively transferred CD8+ Tregs results in superior protection from lethal GVHD
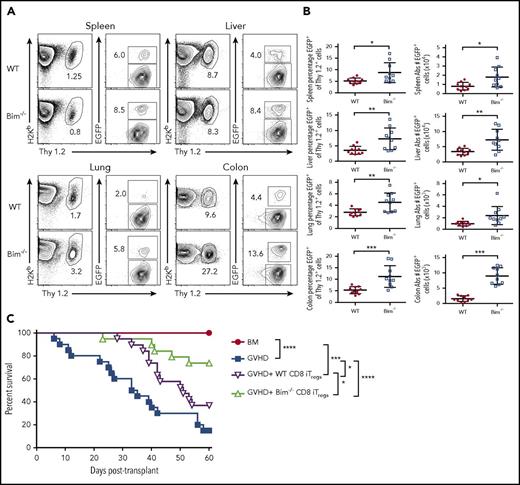
Given that the absence of Bim augmented in vivo-generated CD8+ Treg survival, we examined whether Bim also regulated the survival of adoptively transferred CD8+ Tregs. We observed that there was an increased percentage of CD8+ Bim−/− Tregs relative to wild-type CD8+ Tregs in all tissue sites when assessed 10 days posttransplantation (Figure 7A-B). In addition, this resulted in a significant increase in the absolute numbers of CD8+ Tregs in all tissue sites, particularly within the colon (Figure 7B). We then conducted studies to determine whether this was functionally important by transplanting animals with alloantigen-induced, in vitro-derived CD8+ Tregs from either Foxp3EGFP or Bim−/− Foxp3EGFP mice. Mice that received adjunctive alloantigen-induced CD8+ Tregs from Bim−/− Foxp3EGFP mice had significantly prolonged survival relative to mice reconstituted with wild-type Foxp3EGFP CD8+ Tregs (Figure 7C). Thus, absence of Bim prolonged adoptively transferred CD8+ Treg survival and resulted in enhanced protection from lethal GVHD.
CD8+Bim−/−Tregs are more potent than wild-type CD8+Tregs for the suppression of lethal GVHD. Irradiated Balb/c mice were transplanted with 8 × 10⁶ B6.PL (Thy1.1+) BM together with spleen cells (adjusted to yield a dose of 0.6 × 10⁶ αβ T cells). Animals also received either 0.6 × 10⁶ in vitro-differentiated alloantigen-induced CD8+ Thy1.2+ Tregs from FoxpEGFP (red circles, n = 10) or Bim−/− Foxp3EGFP (blue boxes, n = 10) mice. (A) Representative contour plots depicting the percentage of H-2Kb+ Thy1.2+ Tregs 10 days posttransplantation. (B) The percentage of CD8+ Tregs that maintained Foxp3 expression and the absolute number of CD8+ Foxp3+ T cells in the spleen, liver, lung, and colon of mice reconstituted with adoptively transferred CD8+ FoxpEGFP or CD8+ Bim−/− Foxp3EGFP Tregs cells. Data are from 2 experiments. (C) Lethally irradiated Balb/c mice were transplanted with B6 BM alone (red circle, n = 12) or together with B6 spleen cells. Cohorts of animals reconstituted with B6 BM and spleen cells then received either no additional cells (blue squares, n = 20) or in vitro-differentiated alloantigen-induced CD8+ Tregs from B6 FoxpEGFP (purple triangles, n = 19) or Bim−/− Foxp3EGFP (green triangles, n = 19) mice at a 1:1 ratio. Overall survival is depicted. Data are the cumulative results from 4 experiments. *P < .05; **P < .01; ***P < .001.
CD8+Bim−/−Tregs are more potent than wild-type CD8+Tregs for the suppression of lethal GVHD. Irradiated Balb/c mice were transplanted with 8 × 10⁶ B6.PL (Thy1.1+) BM together with spleen cells (adjusted to yield a dose of 0.6 × 10⁶ αβ T cells). Animals also received either 0.6 × 10⁶ in vitro-differentiated alloantigen-induced CD8+ Thy1.2+ Tregs from FoxpEGFP (red circles, n = 10) or Bim−/− Foxp3EGFP (blue boxes, n = 10) mice. (A) Representative contour plots depicting the percentage of H-2Kb+ Thy1.2+ Tregs 10 days posttransplantation. (B) The percentage of CD8+ Tregs that maintained Foxp3 expression and the absolute number of CD8+ Foxp3+ T cells in the spleen, liver, lung, and colon of mice reconstituted with adoptively transferred CD8+ FoxpEGFP or CD8+ Bim−/− Foxp3EGFP Tregs cells. Data are from 2 experiments. (C) Lethally irradiated Balb/c mice were transplanted with B6 BM alone (red circle, n = 12) or together with B6 spleen cells. Cohorts of animals reconstituted with B6 BM and spleen cells then received either no additional cells (blue squares, n = 20) or in vitro-differentiated alloantigen-induced CD8+ Tregs from B6 FoxpEGFP (purple triangles, n = 19) or Bim−/− Foxp3EGFP (green triangles, n = 19) mice at a 1:1 ratio. Overall survival is depicted. Data are the cumulative results from 4 experiments. *P < .05; **P < .01; ***P < .001.
Discussion
CD8+ Foxp3+ Tregs constitute a highly suppressive population that arises early during GVHD and are able to attenuate the severity of this disease.10-12 Furthermore, despite the fact that these cells are all essentially induced from the conventional CD8+ T-cell compartment, they actually outnumber CD4+ Tregs in some GVHD target organs early posttransplantation.10 However, in contrast to CD4+ Tregs, these cells are short lived in vivo and have limited efficacy for GVHD prevention after in vitro expansion and adoptive transfer.21 These observations, coupled with the more restricted ontological pathway for CD8+ Treg development, suggests these cells represent a nonoverlapping regulatory T-cell population, although how these cells biologically differ from CD4+ Tregs has not been elucidated.
Prior studies on the biology of CD4+ Tregs have demonstrated that the diversity of the TCR repertoire is critical for the function of these cells and the maintenance of self-tolerance.25-27 In fact, experiments using more restricted transgenic TCR model systems have shown that CD4+ Tregs developing in this environment have a reduced ability to prevent autoimmunity.25 Diversity in the CD4+ Treg repertoire occurs via the contributions of thymically derived and peripherally generated Treg populations, which have largely nonoverlapping TCR repertoires.20 Because CD8+ Tregs develop almost exclusively in the periphery without a thymic component, we examined peripherally derived CD4+ and CD8+ Tregs to assess more biologically similar populations. We observed that there was no difference in diversity between these two populations, nor was there any significant difference in the Shannon entropy index between CD8+ Tregs and Tcons. Similar findings were also noted when we examined regulatory and conventional CD8+ T cells that were responding to the same immunodominant minor histocompatibility antigen. TCR repertoire analysis of CD4+ Tregs and Tcons revealed there was little overlap between them, which is consistent with prior studies in which Morsita Horn index scores have typically averaged ∼0.20.30,31 In contrast, we observed that both polyclonal and alloantigen-induced CD8+ Tregs had significantly more repertoire overlap with CD8+ Tcons, which indicated that a larger percentage of these cells appeared to develop from the conventional CD8+ T-cell pool. Thus, there was no evidence of diminished CD8+ Treg repertoire diversity as an explanation for why these cells were more limited in their ability to prevent lethal GVHD.
Numerous studies have defined a canonical CD4+ Treg gene signature that distinguishes these cells from conventional CD4+ T cells.15,35,39 We therefore examined the extent to which the transcriptional profile of CD8+ Tregs was similar to or differed from that of CD4+ Tregs. Using principal component analysis, our results demonstrated that the profile of CD8+ Tregs was most similar to CD4+ Tregs and quite distinct from CD8+ Tcons. In fact, the gene signature of CD8+ Tregs actually bore closer similarity to the canonical CD4+ Treg signature than did CD4+ Tregs that arose during GVHD. Thus, this signature indicated that CD8+ Tregs were transcriptionally competent to exert regulatory functions analogous to CD4+ Tregs. Notably, however, Gene Set Enrichment Analysis and Ingenuity pathway analyses did uncover significant differences between CD8+ and CD4+ Treg populations, which were observed primarily in pathways involved in cell survival and death and, more specifically, the intrinsic apoptotic pathway. The intrinsic or mitochondrial apoptotic pathway comprises molecules that have prosurvival functions (eg, Bcl-2, Bcl-xL, Mcl-1) and those that promote apoptosis (eg, Bim, Bad, Puma, Noxa, and Bid). When these signals are skewed toward apoptosis, there is resulting activation of Bak and Bax, which leads to disruption in the outer mitochondrial membrane, release of cytochrome c, and activation of caspases 3 and 7.40,41 Prior studies in CD4+ Tregs have shown that Mcl-1, in particular, is critical for regulating survival of this cell population under homeostatic conditions.36 Conversely, Bim appears to regulate CD4+ Treg survival in vivo,41 in part, by antagonizing the prosurvival function of Mcl-1.36
To confirm that CD8+ Tregs were differentially biased toward a proapoptotic phenotype, we examined protein expression in alloantigen-induced CD8+ Tregs, which we had shown had reduced in vivo survival and decreased ability to prevent lethal GVHD after adoptive transfer. We demonstrated that CD8+ Tregs had significantly increased expression of Bim, along with a commensurate reduction in Mcl-1, when compared with similarly generated CD4+ Tregs. This was accompanied by augmented expression of caspases 3 and 7, which are terminal components in the intrinsic pathway and direct mediators of cell death.42,43 That protein expression was of functional significance was confirmed by studies demonstrating increased caspase 3 and 7 activity in CD8+ Tregs relative to CD4+ Tregs. However, despite this increase in caspase activity, CD8+ Tregs did not differ from CD4+ Tregs with respect to markers of membrane stability (ie, annexin and 7-AAD positivity). Thus, in vitro-generated CD8+ Tregs were not undergoing overt apoptosis, which is a likely explanation for why adoptively transferred cells retained a modest ability to prevent lethal GVHD despite their proapoptotic profile.
Notably, the protein studies were not in complete agreement with the transcriptional profiling as Mcl-1 was not discordant between CD4+ and CD8+ Tregs in the latter analysis, but was significantly different in the former analysis. A number of studies, however, have shown that mRNA expression does not always predict for protein expression because of posttranscriptional regulatory mechanisms.44,45 Therefore, we conducted functional studies, which demonstrated that CD8+ Bim−/− Tregs were present in significantly higher numbers in all GVHD target tissues when compared with wild-type CD8+ Tregs, corroborating the western blot analyses. Furthermore, the adoptive transfer of CD8+ Bim−/− Tregs was more effective for preventing GVHD. Notably, there was a higher percentage of adoptively transferred CD8+ Tregs that retained Foxp3 expression in tissues from animals reconstituted with CD8+ Bim−/− Tregs. The inflammatory milieu is known to deleteriously affect Foxp3 expression in CD4+ Tregs, resulting in so-called ex-Tregs that can produce inflammatory cytokines and promote pathological damage.21,46,47 Thus, 1 possible explanation is that Foxp3 expression was more stable in CD8+ Tregs that lacked Bim as a result of an increase in Treg survival, which resulted in a reduction in the inflammatory environment. Alternatively, CD8+ Foxp3+ Bim−/− T cells may have had a proliferative advantage relative to adoptively transferred CD8+ Tregs that lost expression of this transcription factor. In any case, these studies indicated that inversion of the Bim/Mcl-1 ratio distinguishes CD8+ from CD4+ Tregs, and that Bim is a critical factor regulating CD8+ Treg survival and suppressive capability.
Regulatory T cells have a diverse set of mechanisms by which they suppress inflammatory responses. These mechanistic pathways have been most extensively examined for CD4+ Tregs in which direct cytolysis via granzyme and perforin secretion, secretion of inhibitory cytokines (ie, IL-10, TGF-β), cytokine deprivation (IL-2), and modulation of dendritic cell maturation and function are pathways by which these cells downregulate immune responses.48 How CD8+ Tregs suppress inflammation is less well understood, although the secretion of inhibitory cytokines (eg, TGF-β) and expression of cytotoxic molecules have been proposed as putative mechanisms.49-51 Thus, although CD8+ Tregs do not currently appear to have discrete nonoverlapping pathways by which they mediate suppression, further study will be required to define their complete mechanistic landscape.
In summary, regulatory T-cell therapy has emerged as a therapeutic consideration for the prevention of GVHD in humans.52 To date, these studies have exclusively involved the adoptive transfer of CD4+ Tregs, in which several reports have demonstrated that these cells can be safely administered to patients,53,54 although the efficacy of this approach for GVHD prevention remains unclear. The emergence of CD8+ Tregs during GVHD and their ability to suppress alloreactive responses10-12 is evidence that they also have a functional role, which appears to be most relevant early during this disease. In contrast to CD4+ Tregs, however, these cells have a more biased proapoptotic phenotype as a result of increased expression of Bim, which is directly responsible for their reduced in vivo efficacy. Thus, the diminished in vivo survival of these cells suggests they may have a more limited and nuanced role within the context of regulatory T-cell therapy.
The online version of this article contains a data supplement.
The publication costs of this article were defrayed in part by page charge payment. Therefore, and solely to indicate this fact, this article is hereby marked “advertisement” in accordance with 18 USC section 1734.
Acknowledgments
This research was supported by National Institutes of Health (NIH), National Heart, Lung, and Blood Institute grants R01 HL064603 (W.R.D.), R01 HL126166 (W.R.D.), and R01 HL139730 (J.S.S.); NIH, National Cancer Institute grants R01 CA163725 (J.S.S.) and K12 CA120780 (B.G.V.); and an award from the Midwest Athletes Against Childhood Cancer Fund (W.R.D). B.G.V. is also supported by a grant from the University of North Carolina University Cancer Research Fund. C.P. is a member of the Medical Scientist Training Program at Medical College of Wisconsin, which is partially supported by a training grant from NIH, National Institute of General Medical Sciences (T32-GM080202).
Authorship
Contribution: K.A. performed research, analyzed data, generated figures, and helped write the manuscript; B.G.V. performed research, conducted the transcriptional and T-cell receptor repertoire data analysis, and helped write the manuscript; C.P. conducted experiments and assisted with data analysis; L.B. and V.Z. performed animal studies; W.S. provided critical reagents and edited the paper; and J.S.S. and W.R.D. developed the overall concept, designed experiments, supervised the study, and wrote the manuscript.
Conflict-of-interest disclosure: The authors declare no competing financial interests.
Correspondence: William R. Drobyski, Bone Marrow Transplant Program, 9200 W Wisconsin Ave, Milwaukee, WI 53226; e-mail: wdrobysk@mcw.edu.
References
Author notes
K.A. and B.G.V. contributed equally to this study.

This feature is available to Subscribers Only
Sign In or Create an Account Close Modal