Abstract
We developed and validated the first serum enzyme-linked immunosorbent assay for hepcidin, the principal iron-regulatory hormone that has been very difficult to measure. In healthy volunteers, the 5% to 95% range of hepcidin concentrations was 29 to 254 ng/mL in men (n = 65) and 17 to 286 ng/mL in women (n = 49), with median concentrations 112 versus 65 (P < .001). The lower limit of detection was 5 ng/mL. Serum hepcidin concentrations in 24 healthy subjects correlated well with their urinary hepcidin (r = 0.82). Serum hepcidin appropriately correlated with serum ferritin (r = 0.63), reflecting the regulation of both proteins by iron stores. Healthy volunteers showed a diurnal increase of serum hepcidin at noon and 8 pm compared with 8 am, and a transient rise of serum hepcidin in response to iron ingestion. Expected alterations in hepcidin levels were observed in a variety of clinical conditions associated with iron disturbances. Serum hepcidin concentrations were undetectable or low in patients with iron deficiency anemia (ferritin < 10 ng/mL), iron-depleted HFE hemochromatosis, and juvenile hemochromatosis. Serum hepcidin concentrations were high in patients with inflammation (C-reactive protein > 10 mg/dL), multiple myeloma, or chronic kidney disease. The new serum hepcidin enzyme-linked immunosorbent assay yields accurate and reproducible measurements that appropriately reflect physiologic, pathologic, and genetic influences, and is informative about the etiology of iron disorders.
Introduction
Hepcidin is the principal iron-regulatory hormone that mediates the homeostasis of extracellular iron concentrations.1,2 Although the peptide is initially synthesized as an 84-amino acid preprohepcidin, it is processed in hepatocytes by a signal peptidase and the prohormone convertase furin3 to its bioactive form, a 25-amino acid peptide circulating in plasma4,5 and excreted in urine.5 Hepcidin acts by regulating iron influx into plasma from tissues engaged in iron storage or transport: duodenal enterocytes that absorb dietary iron, hepatocytes that store iron, and macrophages that recycle iron from senescent erythrocytes. At the molecular level, hepcidin binds to the sole known cellular iron efflux channel, ferroportin, and induces its internalization and lysosomal degradation6 by mechanisms similar to those that inactivate other more conventional membrane receptors. N-terminally truncated breakdown products of hepcidin are detectable in plasma7 and urine5,8 but show impaired ability to internalize ferroportin.9
Hepcidin synthesis is physiologically increased by elevated plasma iron concentration,10,11 decreased by erythropoietic activity,12 and pathologically increased by inflammation.10,13 Hepcidin excess plays the major role in anemia of inflammation14-16 and iron-resistant iron-deficiency anemia.17-20 At the opposite extreme, hepcidin deficiency is the cause of iron overload in most hereditary hemochromatoses21 and contributes to iron overload in β-thalassemia and other iron-loading anemias.22
Despite the importance of hepcidin for systemic iron homeostasis and iron-related pathologies, the methodologies for measuring physiologically relevant hepcidin concentrations have been cumbersome, and their availability to the clinical research community has been very limited. Most of the studies of hepcidin in humans have relied on a human urinary hepcidin assay,23 based on selective extraction of hepcidin from urine by cation-exchange chromatography and its detection in an immunodot format by antihepcidin antibody and chemiluminescence. To account for the variable dilution of urine samples, hepcidin concentration is normalized to urinary creatinine. This assay is laborious and its utility depends on the expected but as yet unverified relationship between normalized urinary hepcidin levels and plasma hepcidin concentrations. More recently, hepcidin assays based on mass spectroscopic techniques7,8,24,25 have been introduced, but most are semiquantitative and depend on expensive equipment that is not widely available. An immunoassay reported to detect human prohepcidin26 does not reflect the expected physiologic or pathologic changes27 in mature hepcidin concentrations seen with other hepcidin assays. We now describe the performance of a competitive enzyme-linked immunoassay (C-ELISA) for human hepcidin. This assay accurately and reproducibly detects physiologic and pathologic changes in serum or urine hepcidin levels and can be readily performed in a high-throughput format.
Methods
Hepcidin C-ELISA
Antibody to human hepcidin was prepared as described previously13 and purified on staphylococcal protein A columns (Thermo Fisher Scientific, Rockford, IL), according to the manufacturer's protocol; 96-well plates were coated with the antibody and incubated with 100 μL (standard samples) or 200 μL (samples with very low concentration of hepcidin) of 1:20 dilution of serum or 1:10 dilution of urine in Tris-buffered saline containing 0.05% Tween-20 (TBS-Tween 20), with 10 ng/mL of biotinylated hepcidin-25 (Intrinsic LifeSciences, La Jolla, CA) added as the tracer. Standard curves were prepared by serial 2-fold dilution of synthetic hepcidin (Bachem Biosciences, King of Prussia, PA) 4000 ng/mL in TBS-Tween 20 buffer containing the tracer. The integrity and bioactivity of synthetic hepcidin and biotinylated hepcidin were verified by mass spectrometry and by bioassay with ferroportin-green fluorescent protein expressing HEK-293 cells.9 After washing, the assay was developed with streptavidin-peroxidase and tetramethyl benzidine. The enzymatic reaction was stopped by sulfuric acid, and the plate was read at 450 nm on a DTX 880 microplate reader (Beckman Coulter, Fullerton, CA). Standard curves were fitted with 12-point fit using GraphPad Prism software (GraphPad Software, San Diego, CA). The fitted curve was then used to convert sample absorbance readings to hepcidin concentrations. Urinary creatinine concentrations were measured by the Jaffe reaction using the Creatinine Parameter Assay (R&D Systems, Minneapolis, MN).
Urine and serum collection
All samples were collected in accordance with protocols approved by the relevant Institutional Review Boards and informed consent was obtained in accordance with the Declaration of Helsinki. Serum and urine samples were stored frozen at −80°C.
Serum and urine donors
Sera from healthy volunteers were obtained in Verona, Italy, and Salt Lake City, UT, and included in this study based on health history, and normal (based on local standards) laboratory values of hemoglobin, serum Fe/total iron-binding capacity, ferritin, serum transferrin receptor, and C-reactive protein (CRP). Patients with inherited iron disorders were recruited by cooperating physicians in the United States, Canada, Italy, Greece, and France. The specific diagnoses were established by family history, genetic testing, and the presence of appropriate biochemical abnormalities. Serum samples of patients with iron deficiency or inflammation were obtained from the UCLA Clinical Laboratory as discards of sera that contained less than 10 ng/mL of ferritin or more than 10 mg/dL of CRP, respectively. Sera of patients with multiple myeloma were obtained from the Veterans Administration myeloma study group. Sera of patients with chronic renal disease were obtained at UCLA, selecting patients without any known underlying inflammatory disorders.
Physiologic studies
The time course of response to the ingestion of 65 mg or 130 mg of iron in the form of one or 2 iron sulfate tablets were determined in healthy volunteers by serial serum sampling starting 24 hours before and ending 24 hours after iron ingestion.
Statistical analysis
Data were analyzed using Sigmastat (Systat Software, San Jose, CA).
Results
Assay performance
Selectivity.
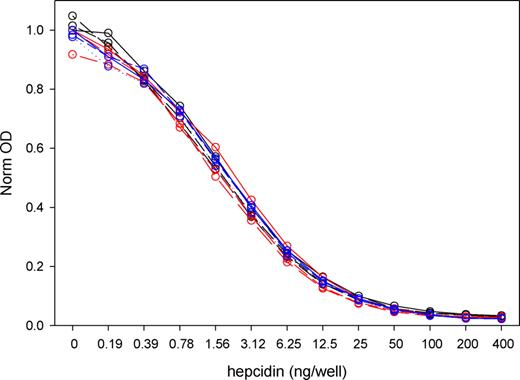
The competitive ELISA standard curve (Figure 1) was not affected by the addition of any of the hepcidin-poor sera obtained from 6 patients with serum ferritin less than 10 ng/mL, indicating that there was little interference from nonhepcidin serum components. In addition, no competition was detected when an antimicrobial peptide structurally related to hepcidin, protegrin-1,28 was added at concentrations 16 to 500 ng/mL (data not shown). The lower limit of hepcidin detection as defined by 2 SD above the zero standard was 5.5 ng/mL.
Comparison of standard curves performed in serum-free buffer or in 1:20 dilution of sera from 6 iron-deficient patients. On 3 different days (red, blue, and black lines), standard curves were performed in buffer (solid line) and in sera from 2 of the 6 patients (dotted and dashed lines). The OD values for all plots were normalized by dividing with the “no hepcidin” buffer OD for that day. The differences between serum and paired buffer OD ranged from −1% plus or minus 4% to −13% plus or minus 8%. The points were fitted with a sigmoidal logistic 4-parameter curve optimized through 200 iterations (Sigmaplot; Systat Software, San Jose, CA).
Comparison of standard curves performed in serum-free buffer or in 1:20 dilution of sera from 6 iron-deficient patients. On 3 different days (red, blue, and black lines), standard curves were performed in buffer (solid line) and in sera from 2 of the 6 patients (dotted and dashed lines). The OD values for all plots were normalized by dividing with the “no hepcidin” buffer OD for that day. The differences between serum and paired buffer OD ranged from −1% plus or minus 4% to −13% plus or minus 8%. The points were fitted with a sigmoidal logistic 4-parameter curve optimized through 200 iterations (Sigmaplot; Systat Software, San Jose, CA).
Intraassay precision.
Eleven serum samples from healthy volunteers were assayed in replicates (n = 5-12, Figure S1A, available on the Blood website; see the Supplemental Materials link at the top of the online article), yielding a coefficient of variation (CV) 5% to 19% with higher variations at lower hepcidin concentrations.
Interassay reproducibility.
Serum samples from 24 healthy volunteers were measured in 3 independent assays (Figure S1B). The average CV was 12% and the median CV was 7%. The range was 0% to 44%, with the higher variations observed in serum samples with hepcidin concentrations below 30 ng/mL.
Hepcidin stability during sample storage.
Fifteen serum and 15 urine samples from healthy subjects were assayed before and after storage for 6 months at −80°C. The median (interquartile range) change in hepcidin concentrations in serum was −5% (+6%, −11%) and in urine −6% (+7%, −14%).
Normal range.
We determined the normal range of hepcidin in serum using samples from healthy volunteers (65 men, 49 women). The subjects' hematologic and iron parameters are described in Table 1. After adjustments for multiple comparisons, there were no significant differences between US and Italian sites in age, hemoglobin, transferrin saturation, or ferritin, and the data from both sites were therefore combined by gender. The 5% to 95% range of hepcidin concentrations (Table 2) was 29 to 254 ng/mL in men and 17 to 286 ng/mL in women, and the medians differed significantly, 112 versus 65 (P < .001 by Mann-Whitney rank sum test). Although there was a trend for age-related increase in serum hepcidin in both genders, it did not reach statistical significance (Figure S2). A much larger number of older men and women will be required to verify this trend.
Characteristics of healthy subjects
| Variable . | United States . | Italy . | ||
|---|---|---|---|---|
| Men . | Women . | Men . | Women . | |
| N | 30 | 28 | 35 | 21 |
| Age | 32.7 (19-60) | 32.6 (20-58) | 31 (18-63) | 28 (18-81) |
| Hgb | 15.7 (13.8-17) | 13.8 (12.8-15.4) | 14.9 (13.6-17.3) | 13.4 (11.7-16.2) |
| Tf sat% | 31.8 (15.5-64.3) | 26.3 (12.1-49.0) | 27.0 (16.0-59.0) | 25.7 (12.1-46.0) |
| Ferritin | 109 (42-398) | 39 (13-85) | 118 (15-288) | 46 (18-140) |
Values are median (range).
Serum hepcidin concentrations in healthy subjects
| Sample . | Minimum . | 5% . | 10% . | Median . | Mean . | 90% . | 95% . | Maximum . |
|---|---|---|---|---|---|---|---|---|
| Serum, men, ng/mL | 10 | 29 | 38 | 112 | 121 | 224 | 254 | 298 |
| Serum, women, ng/mL | 5 | 17 | 25 | 65 | 87 | 157 | 286 | 352 |
| Sample . | Minimum . | 5% . | 10% . | Median . | Mean . | 90% . | 95% . | Maximum . |
|---|---|---|---|---|---|---|---|---|
| Serum, men, ng/mL | 10 | 29 | 38 | 112 | 121 | 224 | 254 | 298 |
| Serum, women, ng/mL | 5 | 17 | 25 | 65 | 87 | 157 | 286 | 352 |
Correlation with urinary hepcidin.
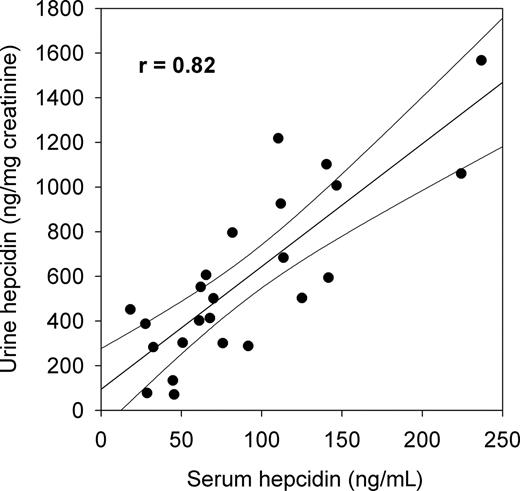
Hepcidin is cleared through the kidneys, and for technical reasons, most of the initial studies of the role of hepcidin in iron pathophysiology used urinary hepcidin assays. This is an indirect measurement of the circulating hormone and has never been correlated with the more physiologically relevant serum hepcidin levels. We measured urinary hepcidin concentrations by C-ELISA in the 24 healthy volunteers and normalized the values to urinary creatinine. Median urinary hepcidin (ng/mg creatinine) was 502 with a range of 71 to 1762. As was the case for serum hepcidin, urinary hepcidin concentrations in women were lower than in men, with median 394 vs 861 ng/mg creatinine (P = .004 by Mann-Whitney test). In this group of healthy subjects, normalized urinary hepcidin concentrations showed good correlation with serum hepcidin concentrations (Figure 2). However, this correlation would be expected to deteriorate when renal function declines.
Correlation between serum and urine hepcidin concentrations in 24 healthy subjects measured by hepcidin C-ELISA. Linear regression and 95% confidence limits are shown.
Correlation between serum and urine hepcidin concentrations in 24 healthy subjects measured by hepcidin C-ELISA. Linear regression and 95% confidence limits are shown.
Serum hepcidin responses to physiologic variation and pathophysiologic perturbations
Correlation with ferritin and with estimated iron stores.
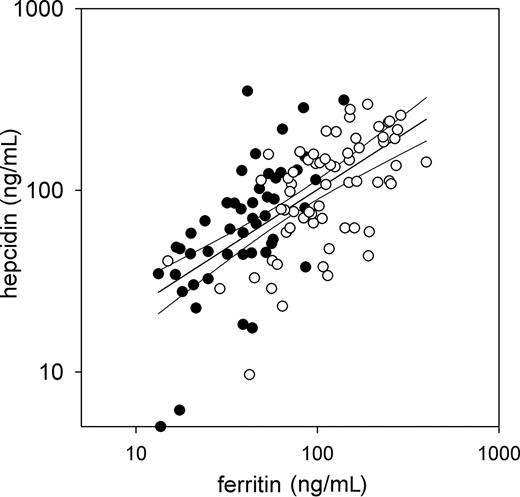
We next asked whether serum hepcidin concentrations measured by C-ELISA reflected iron stores similar to other laboratory markers commonly used for estimating iron stores (Figure 3). Indeed, serum hepcidin concentrations of healthy subjects correlated well with serum ferritin (r = 0.63, P < 10-13 for log(hepcidin) vs log(ferritin)).
Correlation of serum hepcidin with serum ferritin in healthy subjects. Values for men (empty) and women (solid) with a common regression line (r = 0.63) and 95% confidence intervals are shown.
Correlation of serum hepcidin with serum ferritin in healthy subjects. Values for men (empty) and women (solid) with a common regression line (r = 0.63) and 95% confidence intervals are shown.
Response to acute iron load and diurnal variation.
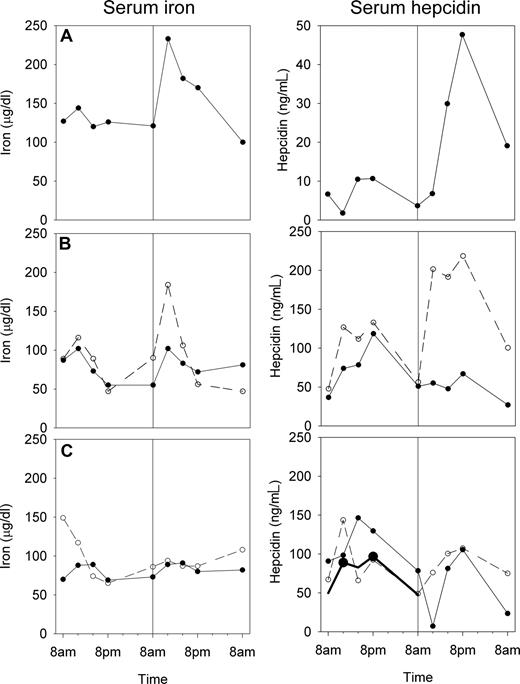
To determine whether the assay detects the expected hepcidin response to iron loading, we examined the time course of hepcidin before and after the administration of oral iron (Figure 4). In subjects with detectable iron absorption, indicated by a rise of serum iron 4 hours after challenge compared with the same time of day during the control period, a corresponding but more prolonged rise in serum hepcidin was seen. Serum iron showed the expected diurnal increase at noon and in the afternoon29 through the control period and after iron challenge in those subjects who did not detectably absorb iron. During the control period, the mean noon, 4 pm, and 8 pm hepcidin concentrations were higher than 8 am values, and this reached statistical significance for the noon and 8 pm values (1 way repeated measures analysis of variance, Holm-Sidak method, overall P < .05). Overall, the 8 am fasting hepcidin concentrations appeared to be more consistent than concentrations at other times of the day.
Serum iron and serum hepcidin before and after a small iron challenge. Serum samples were obtained from 3 subjects (A-C) over 48 hours, and an iron sulfate dose was given at 8 am of the second day as indicated by the vertical line in all panels. Subject A responded to 65 mg of iron by increasing both serum iron and hepcidin. Subject B was tested on 2 separate occasions, first with 65 mg (solid line), then with 130 mg of iron (dashed line), and only responded to the larger dose by increasing serum iron and hepcidin. Subject C was tested on 2 separate occasions with 65 mg of iron (solid and dashed line) and did not increase either serum iron or hepcidin indicating that the iron dose was not well absorbed. The average time dependence of the 5 serial prechallenge hepcidin measurements in all subjects is also shown in panel C as a bold black line. Hepcidin concentration showed diurnal variation, with noon and 8 pm values significantly higher (●) than baseline 8 am values (1-way repeated measures ANOVA, Holm-Sidak method).
Serum iron and serum hepcidin before and after a small iron challenge. Serum samples were obtained from 3 subjects (A-C) over 48 hours, and an iron sulfate dose was given at 8 am of the second day as indicated by the vertical line in all panels. Subject A responded to 65 mg of iron by increasing both serum iron and hepcidin. Subject B was tested on 2 separate occasions, first with 65 mg (solid line), then with 130 mg of iron (dashed line), and only responded to the larger dose by increasing serum iron and hepcidin. Subject C was tested on 2 separate occasions with 65 mg of iron (solid and dashed line) and did not increase either serum iron or hepcidin indicating that the iron dose was not well absorbed. The average time dependence of the 5 serial prechallenge hepcidin measurements in all subjects is also shown in panel C as a bold black line. Hepcidin concentration showed diurnal variation, with noon and 8 pm values significantly higher (●) than baseline 8 am values (1-way repeated measures ANOVA, Holm-Sidak method).
Serum hepcidin in iron disorders.
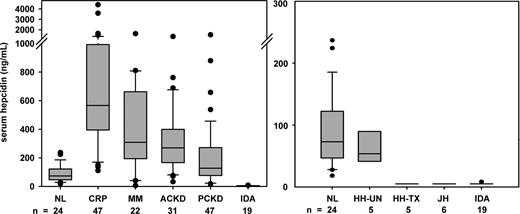
Hepcidin concentrations were measured in the sera of patients with various iron disorders (Figure 5). In agreement with previous urinary hepcidin measurements,30 serum hepcidin was inappropriately normal in iron-overloaded and low in iron-depleted patients with the adult form of hereditary hemochromatosis resulting from mutations in the gene HFE. Serum hepcidin was also low in patients with juvenile hemochromatosis resulting from mutations in hemojuvelin. As would be expected from the physiology of hepcidin regulation, serum hepcidin was undetectable in 18 of 19 patients with iron deficiency (ferritin < 10 ng/mL). Serum hepcidin was abnormally increased in patients with inflammation (CRP > 10 mg/dL), in patients with multiple myeloma, a condition associated with excessive production of interleukin-6,31 a known stimulus for hepcidin synthesis,23 and in patients with chronic kidney disease without associated inflammatory disorders.
Serum hepcidin in iron disorders. Boxplots show 25%, median and 75% with whiskers showing 10% and 90% and outliers as circles. Groups include healthy volunteers (NL), pretreatment HFE hemochromatosis (HH-UN), iron-depleted HFE hemochromatosis (HH-TX), juvenile hemochromatosis resulting from mutations in hemojuvelin (JH), iron deficiency (ID), patients with inflammation (INF, CRP > 10 mg/dL), multiple myeloma (MM), and adult or pediatric chronic kidney disease (not requiring dialysis, ACKD and PCKD, respectively). All disease groups except for HH-UN differed significantly from normal (P < .001 except PKCD P < .01, Mann-Whitney test).
Serum hepcidin in iron disorders. Boxplots show 25%, median and 75% with whiskers showing 10% and 90% and outliers as circles. Groups include healthy volunteers (NL), pretreatment HFE hemochromatosis (HH-UN), iron-depleted HFE hemochromatosis (HH-TX), juvenile hemochromatosis resulting from mutations in hemojuvelin (JH), iron deficiency (ID), patients with inflammation (INF, CRP > 10 mg/dL), multiple myeloma (MM), and adult or pediatric chronic kidney disease (not requiring dialysis, ACKD and PCKD, respectively). All disease groups except for HH-UN differed significantly from normal (P < .001 except PKCD P < .01, Mann-Whitney test).
Discussion
We developed a serum C-ELISA for human hepcidin that correctly detects the expected physiologic and pathologic variations in hepcidin concentrations. The selectivity of the C-ELISA is indicated by the very low serum hepcidin levels that were found in iron deficiency and in severe forms of hereditary hemochromatosis. Consistent with the proposed mechanism of action of hepcidin, the range of measured serum hepcidin concentrations in normal and pathologic samples (< 5 ng/mL to > 4000 ng/mL, ie, 0-1.5 μM) is in the range known to internalize the iron export channel ferroportin.6 Our C-ELISA revealed, for the first time, a significant gender difference in serum hepcidin. This difference is most probably resulting from the lower iron stores in women, also reflected in lower serum ferritin concentrations (Table 1; Figure 3). Serum hepcidin concentrations showed diurnal changes similar to serum iron concentrations, and also increased markedly with acute changes in serum iron induced by oral challenge with iron sulfate (Figure 4). The kinetics of the hepcidin response to iron may be complex because hepatocytes are exposed to boluses of iron in portal blood as well as to changing iron concentrations in systemic blood, and hepcidin changes have a feedback effect on iron concentrations by affecting the release of iron from enterocytes and from macrophage and hepatocyte stores.
Hepcidin and serum ferritin respond similarly to inflammation and changes in iron stores, and this is reflected in the strong correlation between hepcidin and ferritin in healthy volunteers. However, hepcidin responses take place on the time scale of a few hours, whereas changes in ferritin concentrations are much slower.32 In several pathologic conditions, the correlation between serum ferritin and hepcidin is dramatically altered. In various forms of hereditary hemochromatosis, hepcidin is deficient as a result of mutations in hepcidin regulators or in the hepcidin gene itself.33 In untreated or partially treated patients with hereditary hemochromatosis, ferritin is high but hepcidin is inappropriately normal, low, or absent. Although erythropoietic activity has no known direct effect on ferritin, it strongly suppresses hepcidin synthesis.12 Pathologic suppression of hepcidin (in the face of greatly increased serum ferritin) is also seen in β-thalassemia22,34-37 where it results in increased intestinal iron absorption and contributes to systemic iron overload, the main cause of morbidity and mortality in this condition.
Assuming a normal serum creatinine concentration of 1 mg/dL and serum hepcidin of 100 ng/mL, the normal ratio of serum hepcidin to serum creatinine is approximately 10 000 ng/mg creatinine. In our healthy volunteers, the urine contained a median of 500 ng hepcidin/mg creatinine. Thus 95% of hepcidin is retained in the kidney either because it is not freely filtered through the glomerular membrane and/or because it is reabsorbed and degraded in the proximal tubules, like other small peptides.38,39 Although we found good correlations between urinary and serum hepcidin concentrations in our healthy donors, urinary hepcidin concentrations may not accurately reflect the serum concentrations of hepcidin in kidney diseases.
The C-ELISA for human serum hepcidin should be useful in improving our understanding of the pathogenic role of hepcidin in various iron disorders, and in the development of appropriate therapeutic interventions. In contrast to ferritin, a useful marker of iron stores, changes in hepcidin concentrations are frequently the cause of iron disorders. Thus, diagnostic measurements of hepcidin concentrations should be more informative about the etiology of iron-related disease. Large-scale human studies will be required to establish the utility of serum hepcidin measurements in the diagnosis and clinical management of iron disorders.
An Inside Blood analysis of this article appears at the front of this issue.
The online version of this article contains a data supplement.
The publication costs of this article were defrayed in part by page charge payment. Therefore, and solely to indicate this fact, this article is hereby marked “advertisement” in accordance with 18 USC section 1734.
Acknowledgments
The authors thank Dr William L. Roberts who contributed sera from healthy donors; Drs P. Brissot, C. Camaschella, C. Bozzini, A. Lichtenstein, D. Swinkels, P. Goldberg, B. Young, J. Zaritsky, I. Salusky, A. Nissenson, and G. Papanikolaou, whose patients contributed urine and serum samples for this study; and Dr L. Wagar and the UCLA Clinical Laboratories for allowing us to use discarded sera from ferritin and C-reactive protein assays.
This work was supported in part by grants from Telethon Italy (no. GGP06213) and the Cariverona Foundation, Verona, Italy (D.G.).
Authorship
Contribution: T.G. designed the research, analyzed data, and wrote the manuscript; G.O., E.N., and M.W. designed the research, performed experiments, analyzed data, and edited the manuscript; and D.G. designed the research, analyzed data, and edited the manuscript.
Conflict-of-interest disclosure: T.G., G.O., E.N., and M.W. are officers or employees of Intrinsic Lifesciences LLC and have ownership interest in the company. Intrinsic Lifesciences LLC is engaged in the commercial development of the assay described in this manuscript. D.G. declares no competing financial interests.
Correspondence: Tomas Ganz, 37-055 CHS, Department of Medicine, David Geffen School of Medicine at UCLA, Los Angeles, CA 90095-1690; e-mail: tganz@mednet.ucla.edu; or Mark Westerman, Intrinsic LifeSciences LLC, 505 Coast Boulevard South, Suite 102, La Jolla, CA 92037; e-mail: mwesterman@intrinsiclifesciences.com.

This feature is available to Subscribers Only
Sign In or Create an Account Close Modal