

Key Points
Microbiota-derived or orally administered indoles limit GVHD but not graft-versus-leukemia.
Indoles act via IFN1 signaling to protect and repair the mucosal barrier from damage.

Abstract
The intestinal microbiota in allogeneic bone marrow transplant (allo-BMT) recipients modulates graft-versus-host disease (GVHD), a systemic inflammatory state initiated by donor T cells that leads to colitis, a key determinant of GVHD severity. Indole or indole derivatives produced by tryptophan metabolism in the intestinal microbiota limit intestinal inflammation caused by diverse stressors, so we tested their capacity to protect against GVHD in murine major histocompatibility complex–mismatched models of allo-BMT. Indole effects were assessed by colonization of allo-BMT recipient mice with tryptophanase positive or negative strains of Escherichia coli, or, alternatively, by exogenous administration of indole-3-carboxaldehyde (ICA), an indole derivative. Treatment with ICA limited gut epithelial damage, reduced transepithelial bacterial translocation, and decreased inflammatory cytokine production, reducing GVHD pathology and GVHD mortality, but did not compromise donor T-cell-mediated graft-versus-leukemia responses. ICA treatment also led to recipient-strain-specific tolerance of engrafted T cells. Transcriptional profiling and gene ontology analysis indicated that ICA administration upregulated genes associated with the type I interferon (IFN1) response, which has been shown to protect against radiation-induced intestinal damage and reduce subsequent GVHD pathology. Accordingly, protective effects of ICA following radiation exposure were abrogated in mice lacking IFN1 signaling. Taken together, these data indicate that indole metabolites produced by the intestinal microbiota act via type I IFNs to limit intestinal inflammation and damage associated with myeloablative chemotherapy or radiation exposure and acute GVHD, but preserve antitumor responses, and may provide a therapeutic option for BMT patients at risk for GVHD.
Introduction
Allogeneic bone marrow transplantation (allo-BMT) is a curative therapeutic option for patients with hematologic diseases. However, in ∼40% of recipients, allogeneic donor T cells induce a progressive deleterious hyperinflammatory response called graft-versus-host disease (GVHD), which is often fatal.1 Alloreactive T cells that contribute to GVHD are also critical for graft-versus-leukemia (GVL) responses directed against cancer cells in the transplant recipient. Therefore, development of treatments that limit deleterious inflammation associated with GVHD while maintaining GVL activity of the allograft remains a long-standing goal.
Myeloablative irradiation or chemotherapy prior to BMT results in tissue damage and cytokine release that initiates GVHD. Release of antigens from damaged tissues, and their presentation by host antigen presenting cells (APCs), stimulates activation and proliferation of donor T cells, which migrate to sites of damage, particularly in the intestinal tract, skin, and liver.2,3 In the intestinal tract, the resulting colitis reduces epithelial barrier integrity and permits dissemination of enteric bacteria and bacterial antigens into the blood and lymph, leading to systemic inflammation and sepsis. Host APCs stimulated by microbial antigens activate additional donor T cells, thereby exacerbating deleterious inflammatory responses.4 Accordingly, disease severity is greatly reduced in germ-free mice compared with conventional controls.5,6
In addition to contributing to GVHD, the microbiota may also play a protective role. Administration of probiotic Lactobacillus species to mice mitigates GVHD.1 Moreover, increased bacterial diversity and abundance of Blautia in fecal samples from human allo-BMT patients have been associated with reduced incidence of GVHD.2 Thus, the composition of the intestinal microbiota at the time of transplant, and posttransplant, may determine susceptibility to GVHD, severity of disease, or both.3,4
Whereas significant information exists regarding the composition of the microbes that constitute the microbiota and how bacterial products trigger inflammatory responses, much less is known about the molecules produced by commensal microbes that limit inflammation and protect against GVHD. Recently, the microbial metabolite butyrate was shown to augment integrity of the intestinal epithelial barrier and mitigate GVHD.5 We and others have identified indole and its derivatives, secreted by certain commensal bacteria (eg, Escherichia coli, Lactobacillus, Bacteroides),6,7 as molecules that mediate not only intra- and interspecies communication among bacteria,7-9 but also interkingdom communication between bacteria and host.10,11 Production of indole and its metabolites requires bacterial enzyme tryptophanase (TnaA), which catabolizes dietary tryptophan into indole.12 The commensal microflora produce several subsequent bioactive indole metabolites including indole-3-carboxaldehyde (ICA)13 and indoles are also present in the mammalian diet, particularly in cruciferous vegetables.14,15 Indole metabolites are excreted in the feces or absorbed by the host; reaching millimolar concentrations in the digestive tract and up to 200 µM in tissues, urine, and blood.16,17 Indole is metabolized by the liver into 3-indoxyl sulfate (3-IS) and ultimately excreted in the urine.18 Low urinary 3-IS is indicative of dysbiosis and decreased numbers of indole-producing bacteria in the gut.19
Indole or its derivatives have been shown to augment epithelial barrier integrity and tight junction function16,20,21 and to limit colitis associated with Citrobacter rodentium and Candida albicans infection.7,11 Exposing mice to ionizing radiation causes dysbiosis and decreased indole levels in the blood.22,23 In the context of BMT, such changes could render epithelial tissues more susceptible to immune damage and GVHD. Accordingly, patients with lower urinary 3-IS levels at time of transplant have increased incidence of GVHD.19 To date, however, no direct evidence has implicated endogenous indoles derived from commensal bacteria in mitigating GVHD. We report herein that increasing the level of indole or its derivatives in the gut following allo-BMT substantially reduces GVHD without limiting GVL activity of donor T cells.
Methods
Mice
B10.BR (H-2Kk, CD45.2), B6 Pep Boy (CD45.1), B6 albino (H-2Kk, CD45.2), B6 IFN-αR−/− (IFN-αβR-), B6 luciferase+, FVB, and C57BL/6 mice were purchased from Jackson Laboratories, or bred in-house, and used between 8 and 12 weeks of age. Experiments were conducted in accordance with the Guide for the Care and Use of Laboratory Animals24 and the Emory University Institutional Animal Care and Use Committee.
BMT
Recipient mice received 11 Gy total body irradiation (TBI; 2 × 5.5 Gy, 3hours apart) on day −1 and were transplanted on day 0 with 5 × 10⁶ allogeneic T-cell-depleted bone marrow (TCD-BM), with or without 2 × 10⁶ purified allogeneic T cells (B10.BR → C57BL/6, and C57BL/6 → B10.BR transplants) or 3 × 10⁶ splenocytes (B10.BR → B6 albino transplants). BM and splenocyte harvest, and T-cell depletion and purification have been previously described.25,26 Mice received antibiotic water (1.1 mg/mL neomycin sulfate, 1000 U/mL polymixin sulfate) for 4 weeks posttransplant. For GVL experiments, B6 albino recipients were irradiated on day −2, injected with 200 000 C1498ff luciferase-expressing (luc+) myeloid leukemia cells27 on day −1, and transplanted with B10.BR TCD-BM alone (5 × 10⁶) or TCD-BM + 3 × 10⁶ splenocytes containing 1 × 10⁶ T cells. Imaging was performed as described in supplemental Methods (available on the Blood Web site).
Statistics
Significance was assessed using Graph Pad software and the following tests: log rank Mantel-Cox (survival), Mann-Whitney nonparametric, Kruskal-Wallace analysis of variance (ANOVA) with Tukey’s posttest, or 2-way ANOVA with Sidak’s posttest. All analyses were 2-tailed. A P value <.05 was considered significant.
Results
BMT conditioning regimens reduce urinary 3-IS
Mice exposed to lethal γ-irradiation (11 Gy, without BMT) showed a ∼60% reduction in urinary 3-IS within 48 hours of exposure, and 3-IS levels remained below preirradiation baseline for up to 7 days (Figure 1A, left). Similarly, busulfan and cyclophosphamide, a common chemotherapeutic conditioning regimen,28 delivered over 6 days, also diminished 3-IS levels (Figure 1A, right). These data suggest that production of indole or indole derivatives by intestinal microbes is rapidly reduced by irradiation or chemotherapy.
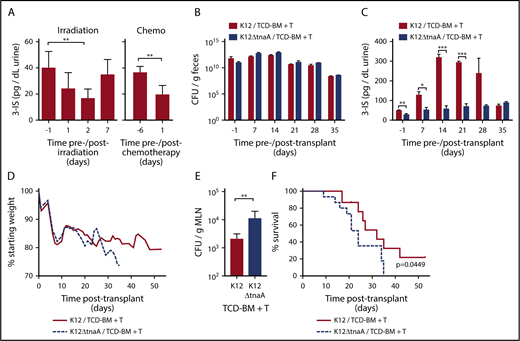
Microbiome-derived indoles mitigate morbidity and mortality in a mouse model of GVHD. (A) Left panel: Changes in urinary 3-IS before (day −1) and after (day 1, 2, 7) lethal TBI at 11 Gy (2 × 5.5 Gy) without subsequent BMT (combined data from 2 experiments, n = 10, sampled at multiple time points). Right panel: 3-IS before (day −6) and 1 day after (day 1) completion of 6-day chemo regimen with busulfan (80 mg/kg total) and cyclophosphamide (200 mg/kg total), without subsequent BMT. Combined data from 2 experiments, n = 10, sampled at multiple time points. (B-F) B10.BR recipient mice were treated with streptomycin and then colonized with streptomycin and nalidixic acid resistant K12 or K12ΔTnaA E coli 1 week prior to lethal irradiation and allo-BMT with TCD-BM + T cells from C57Bl/6 donor mice. Various parameters were tracked before irradiation/allo-BMT (day −1) and then weekly for 5 weeks following transplant. Single experiment with n = 15 per condition and 5 mice censored per condition on day 21 for various assays. (B) Colonization as measured by colony-forming unit (CFU)/g of bacteria in feces assessed on E coli selective plates containing streptomycin and nalidixic acid (n = 15 per condition). (C) 3-IS levels in urine (n = 15 per condition). (D) Weight loss. (E) Bacterial translocation to MLN (day 21, n = 5 per condition). (F) Kaplan-Meier survival curve with ticks indicating mice censored on day 21. Statistics: Mantel Cox Log-rank (survival curve), Mann-Whitney or Kruskal-Wallis ANOVA. ****P < .0001; ***P = .0001 to .001; **P = .001 to .01; *P = .01 to .05.
Microbiome-derived indoles mitigate morbidity and mortality in a mouse model of GVHD. (A) Left panel: Changes in urinary 3-IS before (day −1) and after (day 1, 2, 7) lethal TBI at 11 Gy (2 × 5.5 Gy) without subsequent BMT (combined data from 2 experiments, n = 10, sampled at multiple time points). Right panel: 3-IS before (day −6) and 1 day after (day 1) completion of 6-day chemo regimen with busulfan (80 mg/kg total) and cyclophosphamide (200 mg/kg total), without subsequent BMT. Combined data from 2 experiments, n = 10, sampled at multiple time points. (B-F) B10.BR recipient mice were treated with streptomycin and then colonized with streptomycin and nalidixic acid resistant K12 or K12ΔTnaA E coli 1 week prior to lethal irradiation and allo-BMT with TCD-BM + T cells from C57Bl/6 donor mice. Various parameters were tracked before irradiation/allo-BMT (day −1) and then weekly for 5 weeks following transplant. Single experiment with n = 15 per condition and 5 mice censored per condition on day 21 for various assays. (B) Colonization as measured by colony-forming unit (CFU)/g of bacteria in feces assessed on E coli selective plates containing streptomycin and nalidixic acid (n = 15 per condition). (C) 3-IS levels in urine (n = 15 per condition). (D) Weight loss. (E) Bacterial translocation to MLN (day 21, n = 5 per condition). (F) Kaplan-Meier survival curve with ticks indicating mice censored on day 21. Statistics: Mantel Cox Log-rank (survival curve), Mann-Whitney or Kruskal-Wallis ANOVA. ****P < .0001; ***P = .0001 to .001; **P = .001 to .01; *P = .01 to .05.
Microbiota-derived indoles mitigate morbidity and mortality in murine GVHD
To determine whether augmenting commensal indole production in the intestinal tract could diminish the severity of GVHD, recipient mice were stably colonized prior to allo-BMT (B6 → B10.BR) with a commensal E coli strain (MG1655*StrRNalR [K12]) that can deliver indole metabolites directly into the intestinal tract10,29 or, alternatively, with an isogenic mutant that lacks the tryptophanase gene (MG1655*ΔtnaAStrRNalR [K12ΔtnaA]) and produces neither indole nor its metabolites. All animals, irrespective of condition, maintained similar colonization of K12 or K12∆tnaA over the course of the experiment, although the levels of both species declined over time (Figure 1B). Colonization did not interfere with normal hematopoietic reconstitution of transplant recipients, as control mice receiving TCD-BM only, colonized with either strain, displayed typical weight gain following transplant and 100% survival (supplemental Figure 1). Accordingly, levels of urinary 3-IS prior to irradiation and transplant were approximately twofold higher in mice colonized with K12 compared with those colonized with K12ΔtnaA, and remained between 2- and 6.4-fold higher until 5 weeks posttransplant, when 3-IS in surviving K12-colonized mice decreased to levels equivalent to those of K12∆tnaA-colonized mice (Figure 1C). Mice colonized with K12 and transplanted with TCD-BM + T cells exhibited less weight loss at 5 weeks posttransplant, decreased translocation of bacteria to mesenteric lymph nodes (MLNs), and extended survival, compared with those colonized with K12∆tnaA (Figure 1D-F). Thus, sustained colonization of the intestinal tract with commensal bacteria that produce indoles improved survival and reduced pathology following allo-BMT.
ICA reduces GVHD-associated mortality, inflammatory cytokine production, and mucosal damage
Allo-BMT (B6 → B10.BR) recipient animals were administered ICA or vehicle, by daily gavage (100 or 150 mg/kg per day), beginning 1 day prior to lethal irradiation and 2 days before allo-BMT. In control animals transplanted with TCD-BM only, animals displayed typical weight gain following transplant and 100% survival, regardless of treatment (Figure 2A-B). In animals transplanted with TCD-BM + T cells, ICA prevented weight loss and extended survival in a dose-dependent manner compared with animals treated with vehicle (Figure 2A-B). Whereas all vehicle-treated animals died by day 42, survival rates at this time point were ∼50% in animals administered ICA at 100 mg/kg per day and ∼90% in animals administered 150 mg/kg per day. An experiment conducted using a different major histocompatibility complex–mismatched allo-BMT transplant model (B10.BR → B6) also yielded significantly improved survival in mice treated with 150 mg/kg ICA (supplemental Figure 2A-B).
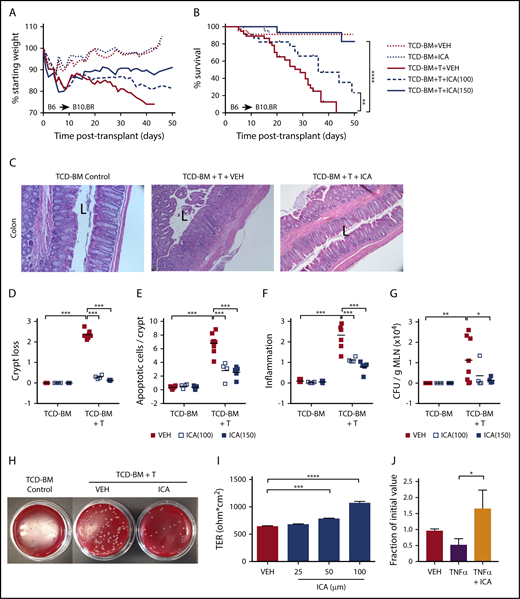
ICA reduces GVHD-related morbidity and mortality in a dose-dependent manner in allo-BMT recipients. (A-G) B10.BR recipients were lethally irradiated and subjected to allo-BMT with TCD-BM alone or in combination with purified T cells (TCD-BM + T) from C57Bl/6 donor mice to induce GVHD. Mice received daily oral gavage with 100 mg/kg or 150 mg/kg ICA or vehicle (VEH) starting 1 day prior to irradiation. All data from day 21 posttransplant. Representative data from 2 experimental repeats at each ICA dose; n = 15 to 20 per group, 5 mice censored per condition on day 21 for various assays. (A) Weight loss (n = 15-20). (B) Kaplan-Meier survival curve (n = 15-20) with ticks indicating mice censored for histological studies. (C) Hematoxylin and eosin (H&E) staining of distal colon in animals receiving 100 mg/kg ICA or VEH. (All images are ×200 magnification; “L” indicates the lumen). (D-F) Quantitation of colon histology. For each parameter, an average value per mouse was determined as detailed in supplemental Methods (n = 4 to 8 per condition). (D) Degree of crypt loss (0 = none → 3 = severe). (E) Apoptotic cells per crypt. (F) Degree of infiltrating immune cells (0 = none → 3 = severe). (G) Quantitation of CFU per gram MLN. (H) Image of representative result of dilution plating of MLN homogenates to determine CFU/g MLN. (I) TER measured across Caco-2 cell monolayers after treatment with increasing concentrations of ICA. Combined data from 3 experiments. (J) TER measured across Caco-2 cell monolayers damaged with TNF-α and treated with ICA (100 µM). Combined data from 2 experiments. Statistics: Mantel Cox Log-rank (survival curve), ANOVA. ****P < .0001; ***P = .0001 to .001; **P = .001 to .01; *P = .01 to .05.
ICA reduces GVHD-related morbidity and mortality in a dose-dependent manner in allo-BMT recipients. (A-G) B10.BR recipients were lethally irradiated and subjected to allo-BMT with TCD-BM alone or in combination with purified T cells (TCD-BM + T) from C57Bl/6 donor mice to induce GVHD. Mice received daily oral gavage with 100 mg/kg or 150 mg/kg ICA or vehicle (VEH) starting 1 day prior to irradiation. All data from day 21 posttransplant. Representative data from 2 experimental repeats at each ICA dose; n = 15 to 20 per group, 5 mice censored per condition on day 21 for various assays. (A) Weight loss (n = 15-20). (B) Kaplan-Meier survival curve (n = 15-20) with ticks indicating mice censored for histological studies. (C) Hematoxylin and eosin (H&E) staining of distal colon in animals receiving 100 mg/kg ICA or VEH. (All images are ×200 magnification; “L” indicates the lumen). (D-F) Quantitation of colon histology. For each parameter, an average value per mouse was determined as detailed in supplemental Methods (n = 4 to 8 per condition). (D) Degree of crypt loss (0 = none → 3 = severe). (E) Apoptotic cells per crypt. (F) Degree of infiltrating immune cells (0 = none → 3 = severe). (G) Quantitation of CFU per gram MLN. (H) Image of representative result of dilution plating of MLN homogenates to determine CFU/g MLN. (I) TER measured across Caco-2 cell monolayers after treatment with increasing concentrations of ICA. Combined data from 3 experiments. (J) TER measured across Caco-2 cell monolayers damaged with TNF-α and treated with ICA (100 µM). Combined data from 2 experiments. Statistics: Mantel Cox Log-rank (survival curve), ANOVA. ****P < .0001; ***P = .0001 to .001; **P = .001 to .01; *P = .01 to .05.
Consistent with increased survival rates, colon histopathology was noticeably improved in animals transplanted with TCD-BM + T cells and treated with ICA compared with those treated with vehicle (Figure 2C), although ICA was without detectable effect on hepatic GVHD, as assessed by histological infiltration of immune cells in the portal tracts (supplemental Figure 2D). Colons from ICA-treated mice showed decreased crypt loss (Figure 2D), fewer apoptotic cells per crypt (Figure 2E), and decreased inflammation (Figure 2F) at day 21 posttransplant, although protective effects of ICA were evident as early as day 7 (supplemental Figure 2C). Additionally, among recipients of TCD-BM + T cells, ICA decreased numbers of bacteria in the MLN at day 21, indicating a more intact intestinal barrier (Figure 2G-H). In accordance with these data, ICA increased transepithelial resistance (TER) across monolayers of cultured Caco-2 cells, or in cells previously exposed to tumor necrosis factor (TNF)-α to disrupt barrier integrity (Figures 2I-J). Thus, ICA enhances and restores epithelial barrier integrity.
Bioluminescent imaging of transplant recipients receiving TCD-BM plus luc+ donor T cells (B6 → B10.BR transplant model) allowed monitoring of in vivo donor T-cell expansion and organ distribution of donor T cells posttransplant. ICA-treated animals showed a nonsignificant trend toward lower levels of bioluminescence in whole animal imaging (supplemental Figure 4A) and in GVHD-target organs (supplemental Figure 4B-D), with significant differences in the bioluminescence of lungs of ICA-treated recipients at day +21 posttransplant (supplemental Figure 4C). Although no significant difference in luminescence of donor luc+ T cells in the intestinal tract of recipients was evident with ICA treatment by day 21 posttransplant, inflammatory cytokines (TNF-α, interferon-γ [IFN-γ], and interleukin-6 [IL-6]) and chemokines (CXCL1, CCL2, and CCL3) were significantly decreased in colon homogenates of TCD-BM + T cell animals treated with ICA compared with those treated with vehicle (Figure 3A-B). Plasma levels of IL-27 and IL-1a were similarly lower with ICA treatment (Figure 3C), as were percentages of CD69-, PD1-, and IL-17–positive donor T cells (Figure 3E-F). Although ICA has been shown to augment barrier integrity in intestinal epithelia via transient production of IL-22 by group 3 innate lymphoid (ILC3) cells,11 no detectable changes in IL-22 were evident at day 21 posttransplant in colon homogenates or plasma, regardless of treatment (Figure 3D), nor at any earlier time points tested (supplemental Figure 3A). By day 21 posttransplant, ICA-treated mice did not show a detectable effect on infiltration of immune cells in the portal tracts of the liver (supplemental Figure 2D) or differences in luminescence of liver-infiltrating luc+ donor T cells (supplemental Figure 4D), indicating a limited effect of ICA on GVHD in this organ.
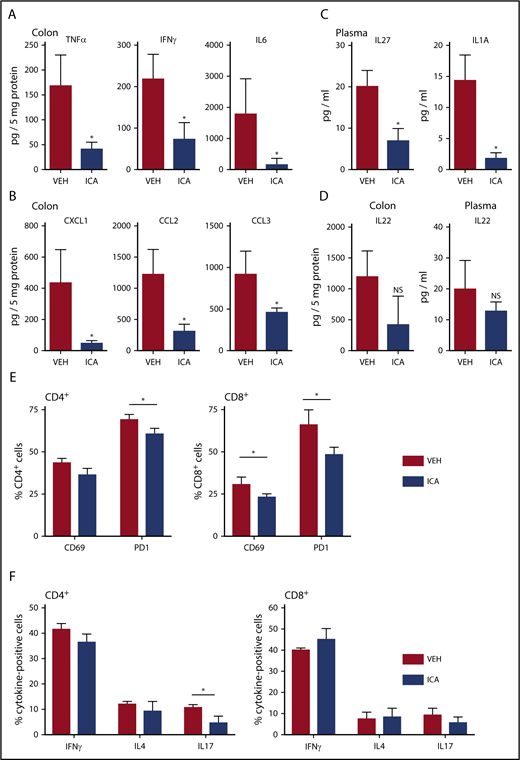
ICA decreases GVHD-associated inflammatory cytokines in allo-BMT recipients. (A-F) Lethally irradiated B10.BR recipients were transplanted with TCD-BM in combination with purified T cells from C57Bl/6 mice to induce GVHD. Mice received daily oral gavage of 150 mg/kg ICA. Samples were collected at day 21 posttransplant (n = 5 mice per condition, assayed in triplicate). Representative data from 1 of 3 experimental repeats. Cytokines (A) and chemokines (B) significantly altered in colon homogenates in mice transplanted with T-cell-depleted BM + T and following treatment with ICA (day 21). (C) Cytokines significantly altered in plasma in mice transplanted with T-cell-depleted BM + T and following treatment with ICA (day 21). (D) IL-22 in colon (left) and plasma (right) in mice transplanted with T-cell-depleted BM + T and following treatment with ICA (day 21). (E) Percentages of CD69 and PD1 positive CD4 donor T cells (left) or CD8 donor T cells (right) in mice treated with ICA or VEH. (F) Percentages of cytokine expressing CD4 donor T cells (left) or CD8 donor T cells (right) in mice treated with ICA or VEH. Statistics: Mann-Whitney rank sum. Error bars represent standard deviations. *P = .01 to .05; NS, not significant. Mantel Cox log-rank (survival curve).
ICA decreases GVHD-associated inflammatory cytokines in allo-BMT recipients. (A-F) Lethally irradiated B10.BR recipients were transplanted with TCD-BM in combination with purified T cells from C57Bl/6 mice to induce GVHD. Mice received daily oral gavage of 150 mg/kg ICA. Samples were collected at day 21 posttransplant (n = 5 mice per condition, assayed in triplicate). Representative data from 1 of 3 experimental repeats. Cytokines (A) and chemokines (B) significantly altered in colon homogenates in mice transplanted with T-cell-depleted BM + T and following treatment with ICA (day 21). (C) Cytokines significantly altered in plasma in mice transplanted with T-cell-depleted BM + T and following treatment with ICA (day 21). (D) IL-22 in colon (left) and plasma (right) in mice transplanted with T-cell-depleted BM + T and following treatment with ICA (day 21). (E) Percentages of CD69 and PD1 positive CD4 donor T cells (left) or CD8 donor T cells (right) in mice treated with ICA or VEH. (F) Percentages of cytokine expressing CD4 donor T cells (left) or CD8 donor T cells (right) in mice treated with ICA or VEH. Statistics: Mann-Whitney rank sum. Error bars represent standard deviations. *P = .01 to .05; NS, not significant. Mantel Cox log-rank (survival curve).
ICA provides a survival benefit in early and late stages of GVHD
To determine whether continued administration of ICA at late stages of GVHD was required to maintain survival, transplant recipients (B6 TCD-BM + T → B10.BR) were treated with ICA or vehicle until all vehicle-treated mice had died (day 45), at which point ICA administration was discontinued. Even in the absence of continuing treatment, previously treated animals gained weight and survived through day 60 posttransplant, the longest time assessed (Figure 4A). To determine the optimal time of ICA administration for the maximal protective effect, mice were transplanted with TCD-BM + T cells (B6 → B10.BR), and ICA was provided only from day −2 to day 12 (early ICA), or alternatively, from day 12 to day 53 (late ICA). No difference in weight loss or survival was evident between mice receiving early ICA and those given ICA throughout the experiment, with 78% of mice surviving to day 53, the longest time assessed (Figure 4B). By contrast, when ICA was provided only after day 12 (late ICA), ∼64% of animals died before day 30 at a rate comparable to that seen with vehicle throughout. However, after day 30, the remaining animals treated with late ICA maintained a stable weight and survived through day 53, whereas those given vehicle throughout the experiment died by day 41. Together, these data suggest that ICA exerts a maximal protective effect when administered early, at the time of transplant and initiation of GVHD, but also provides a survival advantage at later stages in the disease.
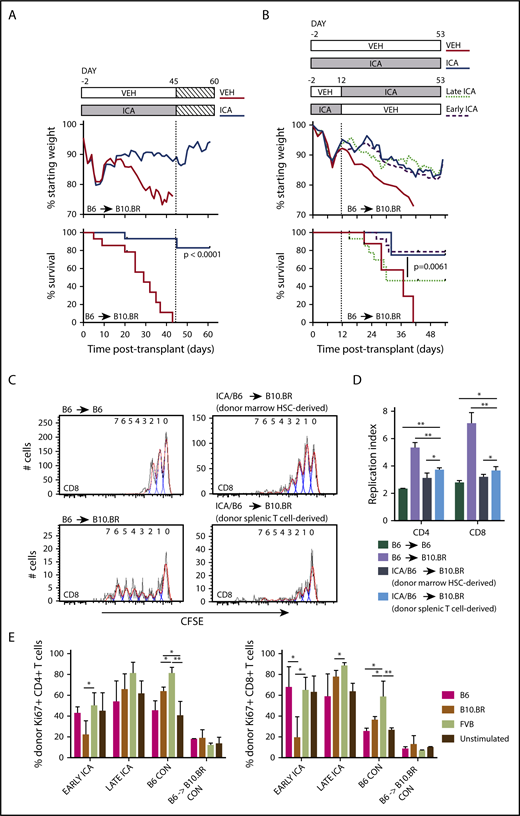
ICA treatment of allo-BMT recipients leads to sustained survival after removal of ICA and induces tolerance in allogeneic T cells. (A) Lethally irradiated B10.BR recipients were transplanted with TCD-BM in combination with purified T cells (TCD-BM + T) from C57Bl/6 (B6) mice to induce GVHD. Mice received daily oral gavage of 150 mg/kg ICA or vehicle through day 45 posttransplant, at which point ICA delivery was terminated. Weight loss and survival were tracked through day 60. (A) Treatment schema (top). Weight loss (middle). Survival curves representing a subset of vehicle-treated recipients (n = 9) and ICA-treated recipients (N = 10) from Figure 2, followed for an additional 15 days after ICA treatment was terminated (bottom). (B) Lethally irradiated B10.BR recipients were transplanted with TCD-BM in combination with purified T cells from C57Bl/6 mice to induce GVHD. Top panel: Treatment schema. Early ICA mice received daily oral gavage of ICA from day −2 to day 12 and vehicle day 13 to day 53. Late ICA mice received daily oral gavage of vehicle from day −2 to day 12 and ICA day 13 to day 53. Control mice received ICA or vehicle throughout. Middle panel: Weight loss. Lower panel: Kaplan-Meier survival curve. Early ICA and late ICA, n = 15 per group. Controls, n = 4 per group. (C-D) T cells were harvested from spleens of ICA-treated survivors (n = 8, from panel A) at 60 days posttransplant (15 days after termination of ICA delivery), labeled with carboxyfluorescein diacetate succinimidyl ester (CFSE), and used for secondary transfer. Splenocytes were harvested from secondary recipients 3 days after transfer, and proliferation profiles assessed by Flow Cytometry. (C) CFSE proliferation profiles of CD8 T cells in control B6 → B6 syngeneic transfer (upper left), N = 3; control B6 → B10.BR allogeneic transfer (lower left), N = 4; marrow-derived T cells from ICA-treated survivors → B10.BR recipients (upper right) and donor spleen-derived T cells from ICA-treated survivors → B10.BR recipients (lower right), N = 4. Flow cytometry gating was used to quantify T cells which were marrow hematopoietic stem cell (HSC) derived vs donor splenic T-cell derived. (D) Replication indices for the CD8 CFSE profiles depicted in panel C as well as CD4 CFSE profiles. (E) Splenocytes from Early ICA and late ICA survivors at day 53 posttransplant (from panel B) were tested, along with splenocytes from B6 control and B6 → B10.BR control with chronic GVHD, in MLR. Stimulators included irradiated splenocytes from B6, B10.BR, and FVB. At 48 hours, culture wells were harvested and analyzed for donor-derived CD4 (left) and CD8 T-cells (right) and Ki67 expression. Error bars represent standard deviations. Statistics: Mantel Cox log-rank (survival curve), ANOVA, Student t test. **P = .001 to .01; *P = .01 to .05.
ICA treatment of allo-BMT recipients leads to sustained survival after removal of ICA and induces tolerance in allogeneic T cells. (A) Lethally irradiated B10.BR recipients were transplanted with TCD-BM in combination with purified T cells (TCD-BM + T) from C57Bl/6 (B6) mice to induce GVHD. Mice received daily oral gavage of 150 mg/kg ICA or vehicle through day 45 posttransplant, at which point ICA delivery was terminated. Weight loss and survival were tracked through day 60. (A) Treatment schema (top). Weight loss (middle). Survival curves representing a subset of vehicle-treated recipients (n = 9) and ICA-treated recipients (N = 10) from Figure 2, followed for an additional 15 days after ICA treatment was terminated (bottom). (B) Lethally irradiated B10.BR recipients were transplanted with TCD-BM in combination with purified T cells from C57Bl/6 mice to induce GVHD. Top panel: Treatment schema. Early ICA mice received daily oral gavage of ICA from day −2 to day 12 and vehicle day 13 to day 53. Late ICA mice received daily oral gavage of vehicle from day −2 to day 12 and ICA day 13 to day 53. Control mice received ICA or vehicle throughout. Middle panel: Weight loss. Lower panel: Kaplan-Meier survival curve. Early ICA and late ICA, n = 15 per group. Controls, n = 4 per group. (C-D) T cells were harvested from spleens of ICA-treated survivors (n = 8, from panel A) at 60 days posttransplant (15 days after termination of ICA delivery), labeled with carboxyfluorescein diacetate succinimidyl ester (CFSE), and used for secondary transfer. Splenocytes were harvested from secondary recipients 3 days after transfer, and proliferation profiles assessed by Flow Cytometry. (C) CFSE proliferation profiles of CD8 T cells in control B6 → B6 syngeneic transfer (upper left), N = 3; control B6 → B10.BR allogeneic transfer (lower left), N = 4; marrow-derived T cells from ICA-treated survivors → B10.BR recipients (upper right) and donor spleen-derived T cells from ICA-treated survivors → B10.BR recipients (lower right), N = 4. Flow cytometry gating was used to quantify T cells which were marrow hematopoietic stem cell (HSC) derived vs donor splenic T-cell derived. (D) Replication indices for the CD8 CFSE profiles depicted in panel C as well as CD4 CFSE profiles. (E) Splenocytes from Early ICA and late ICA survivors at day 53 posttransplant (from panel B) were tested, along with splenocytes from B6 control and B6 → B10.BR control with chronic GVHD, in MLR. Stimulators included irradiated splenocytes from B6, B10.BR, and FVB. At 48 hours, culture wells were harvested and analyzed for donor-derived CD4 (left) and CD8 T-cells (right) and Ki67 expression. Error bars represent standard deviations. Statistics: Mantel Cox log-rank (survival curve), ANOVA, Student t test. **P = .001 to .01; *P = .01 to .05.
ICA treatment led to recipient-specific tolerance in CD4+ and CD8+ T cells
The observation that mice survived after ICA was discontinued raised the possibility that donor allogeneic T cells became tolerized to host antigens in surviving animals. To test this, splenocytes were recovered from surviving ICA-treated TCD-BM + T cell recipient mice at 60 days posttransplant, CFSE labeled, and transplanted into new B10.BR recipients. Splenic T cells used for the initial transplants were isolated from C57Bl/6 H2Kb CD45.2+ mice, whereas TCD-BM was isolated from H2Kb CD45.1+ animals, facilitating identification of donor T-cell populations derived from hematopoietic stem cells (CD45.1+) or mature donor T cells in the original graft (CD45.2+) by flow cytometry. CFSE-labeled T cells from untreated donor B6 mice were used for control syngeneic (B6 → B6) and allogeneic (B6 → B10.BR) transplants. Three days following secondary transplant, T cells were recovered from spleens of secondary and control transplant recipients and assayed for levels of CFSE as a measure of homeostatic T-cell proliferation in syngeneic recipients and alloreactive proliferation in allogeneic recipients. Donor spleen-derived T cells from ICA-treated survivors had low proliferation profiles (Figure 4C, lower right) and replication indices (Figure 4D, light blue bar) following secondary transfer into B10.BR recipients, similar to the proliferation of marrow-derived T cells from ICA-treated survivors (Figure 4C, upper right; Figure 4D, dark blue bar) and homeostatic proliferation of T cells in B6 → B6 syngeneic controls (Figure 4C, upper left; Figure 4D, dark green bar). T cells from ICA-treated mice had far less proliferation than T cells recovered from B6 → B10.BR allogeneic controls (Figures 4C, lower left; Figure 4D, lavender bar), consistent with recipient-specific tolerance.
We next compared proliferative responses of CD4+ and CD8+ T cells derived from either early ICA or late ICA day 53 survivors, B6 → B10.BR TCD-BM plus T cell survivors with low-level, chronic GVHD, or control C57Bl/6 animals, in mixed lymphocyte reactions (MLRs) with various stimulator cell types (Figure 4E). As expected, control (nontransplant) C57Bl/6 T cells were responsive to FVB and B10.BR antigens, but less responsive to syngeneic B6 antigens. By contrast, T cells from B6 → B10.BR mice with low-level GVHD exhibited limited responses to all stimulators, consistent with development of GVHD-associated anergy. Of importance, CD4+ and CD8+ T cells from the ICA-treated mice, especially the early ICA group, still exhibited responsiveness to FVB, but were significantly less responsive to B10.BR stimulators. Together, these data suggest that T cells from the ICA-treated survivors are not anergic, but rather show evidence of recipient-specific tolerance.
ICA does not inhibit the GVL activity of allogeneic T cells
To test whether ICA might limit mortality associated with GVHD while still permitting GVL activity, 200 000 C1498ff cells, a luc+ myeloid leukemia cell line,30 were injected into irradiated B6 albino recipient mice 1 day prior to transplantation with B10.BR TCD-BM alone or TCD-BM + 3 × 10⁶ splenocytes. This splenocyte dose contained 1 × 10⁶ allogeneic T cells, which does not result in lethal GVHD in most recipients (Figure 5A-B), thereby allowing evaluation of the effects of ICA on GVL and tumor burden. Bioluminescent imaging of C1498ff cells to visualize and quantitate tumor size (Figure 5C-D) indicated that transplantation with TCD-BM alone and treatment with ICA resulted in significant tumor burden by day 22 (Figure 5C, left), and all animals died from leukemia within 35 days (Figure 5B), a time course similar to that observed using 200 000 C1498 in B6 BM transplant recipients, as reported previously.31 Thus, ICA had no apparent effect on tumor growth in the absence of T cells. Mice transplanted with TCD-BM + splenocytes showed significantly improved survival compared with TCD-BM only control, irrespective of ICA treatment (Figure 5B), with fewer mice with detectable tumors at day 22 (Figure 5C-D, left), and no detectable tumors in surviving mice by day 56 (Figure 5C-D, right). Thus, ICA inhibits GVHD, but does not interfere with GVL.
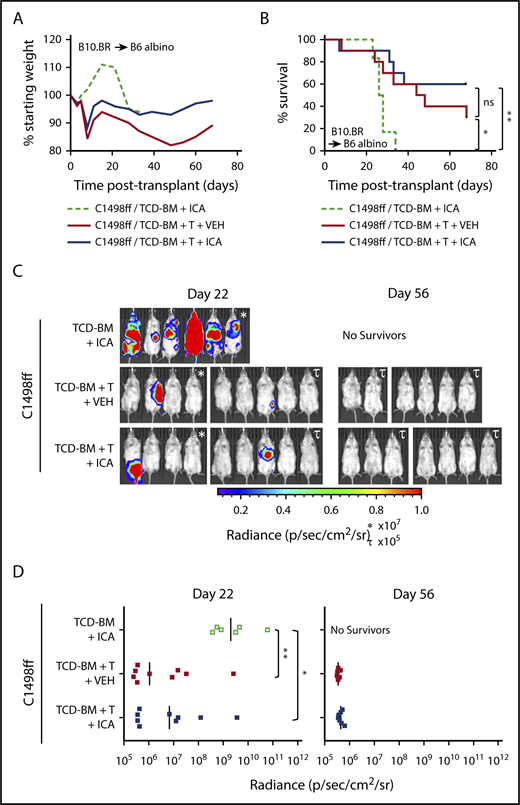
ICA does not inhibit the GVL activity of allogeneic T cells. (A-D) B6 albino recipients were injected with C1498ff on day −2, lethally irradiated on day −1, and transplanted on day 0 with 5 × 10⁶ TCD-BM cells alone (n = 6) or in combination with 3 × 10⁶ splenocytes (TCD-BM + T, n = 9 per group) from B10.BR donor mice. Mice received daily oral gavage with 150 mg/kg ICA or vehicle (VEH) starting 5 days prior to irradiation. (A) Weight loss. (B) Kaplan-Meier survival curve. (C) Visualization of C1498ff by in vivo bioluminescent imaging on day 22 (left) and day 56 (right) posttransplant. Two different luminescence scales are used to best show detectable tumors in different cages of mice. (D) Quantitation of C1498ff bioluminescence on day 22 (left) and day 56 (right) posttransplant. Statistics: Mantel Cox log-rank (survival curve), Kruskal-Wallis ANOVA. ****P < .0001; ***P = .0001 to .001; **P = .001 to .01; *P = .01 to .05; ns, not significant.
ICA does not inhibit the GVL activity of allogeneic T cells. (A-D) B6 albino recipients were injected with C1498ff on day −2, lethally irradiated on day −1, and transplanted on day 0 with 5 × 10⁶ TCD-BM cells alone (n = 6) or in combination with 3 × 10⁶ splenocytes (TCD-BM + T, n = 9 per group) from B10.BR donor mice. Mice received daily oral gavage with 150 mg/kg ICA or vehicle (VEH) starting 5 days prior to irradiation. (A) Weight loss. (B) Kaplan-Meier survival curve. (C) Visualization of C1498ff by in vivo bioluminescent imaging on day 22 (left) and day 56 (right) posttransplant. Two different luminescence scales are used to best show detectable tumors in different cages of mice. (D) Quantitation of C1498ff bioluminescence on day 22 (left) and day 56 (right) posttransplant. Statistics: Mantel Cox log-rank (survival curve), Kruskal-Wallis ANOVA. ****P < .0001; ***P = .0001 to .001; **P = .001 to .01; *P = .01 to .05; ns, not significant.
ICA alters gene expression associated with GVHD
We next identified genes regulated by ICA in the gut epithelium that are associated with protection against GVHD. Transcript levels were assessed by microarray in intestinal RNA samples derived from animals subjected to transplant with TCD-BM or TCD-BM + T cells and treated with either vehicle or ICA for 21 days. Quantitative reverse transcription polymerase chain reaction analysis of 2 genes, Slfn4 and Cml5, was performed on samples from all transplant and treatment combinations to validate expression levels obtained by microarray (supplemental Figure 5). In vehicle treated mice, comparison of data from animals transplanted with TCD-BM + T cells vs those transplanted with TCD-BM alone identified 376 genes whose expression significantly changed with GVHD (Figure 6A; GVHD-dependent genes). In animals transplanted with TCD-BM + T cells, comparison of data from animals treated with ICA vs those treated with vehicle identified 97 differentially expressed genes associated with ICA-induced protection against GVHD (Figure 6A; ICA- and GVHD-dependent genes). Interestingly, comparison of these 2 gene sets revealed only 26 common genes (Figure 6A). Thus, expression of only a small number of genes associated with development of GVHD were altered by ICA treatment.
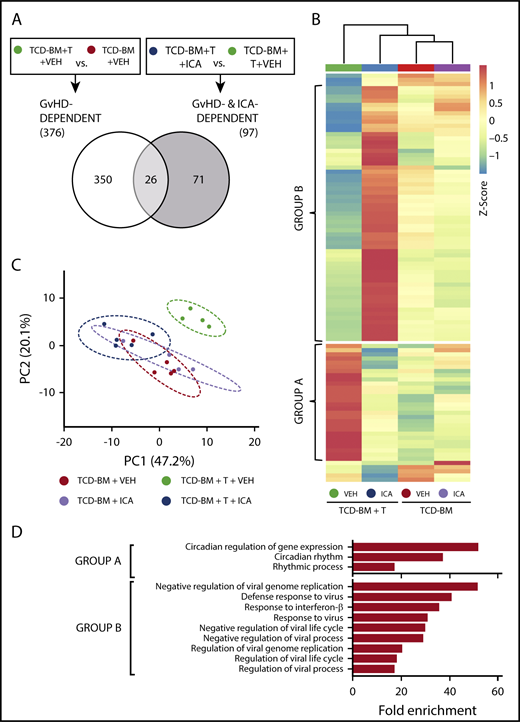
ICA regulates expression of genes in the type I interferon (IFN1) and circadian rhythm pathways. (A) Venn diagram indicating the schema for identification of both GVHD-dependent and GVHD- and ICA-dependent gene expression changes assessed 21 days after B6 → B10.BR transplant. (B) Hierarchical clustering of 97 z-score normalized GVHD- and ICA-dependent genes in all 4 experimental conditions (TCD-BM or TCD-BM + T treated with either VEH or ICA). Each column represents averaged z-score data from n = 4 (TCD-BM) or n = 5 (TCD-BM + T) animals. Group A represents genes downregulated by ICA in TCD-BM + T transplanted animals. Group B represents genes upregulated by ICA in TCD-BM + T transplanted animals. (C) Principal component analysis of GVHD- and ICA-dependent genes; n = 4 (TCD-BM) or n = 5 (TCD-BM + T). (D) Gene ontology analysis (GoAmigo) of group A and group B GVHD- and ICA-dependent genes. Statistics: 1-way and 2-way ANOVA tests were performed to determine significant differential expression of genes among groups and identify common genes. Differential expression filtering was performed using an unadjusted P value <.05 and absolute fold change >1.5.
ICA regulates expression of genes in the type I interferon (IFN1) and circadian rhythm pathways. (A) Venn diagram indicating the schema for identification of both GVHD-dependent and GVHD- and ICA-dependent gene expression changes assessed 21 days after B6 → B10.BR transplant. (B) Hierarchical clustering of 97 z-score normalized GVHD- and ICA-dependent genes in all 4 experimental conditions (TCD-BM or TCD-BM + T treated with either VEH or ICA). Each column represents averaged z-score data from n = 4 (TCD-BM) or n = 5 (TCD-BM + T) animals. Group A represents genes downregulated by ICA in TCD-BM + T transplanted animals. Group B represents genes upregulated by ICA in TCD-BM + T transplanted animals. (C) Principal component analysis of GVHD- and ICA-dependent genes; n = 4 (TCD-BM) or n = 5 (TCD-BM + T). (D) Gene ontology analysis (GoAmigo) of group A and group B GVHD- and ICA-dependent genes. Statistics: 1-way and 2-way ANOVA tests were performed to determine significant differential expression of genes among groups and identify common genes. Differential expression filtering was performed using an unadjusted P value <.05 and absolute fold change >1.5.
Following z-score normalization, expression levels of the 97 identified ICA- and GVHD-dependent genes were compared across all 4 conditions (Figure 6B). Most of these genes did not show significant up- or downregulation in animals transplanted with TCD-BM only, regardless of treatment (Figure 6B, columns 3 and 4), and principal component analysis confirmed that the variance in expression from TCD-BM only animals with or without ICA was similar (Figure 6C, red vs lavender). In contrast, among animals transplanted with TCD-BM + T cells, significant differential expression was evident between animals treated with ICA vs those treated with vehicle (Figure 6B, columns 3 and 4) with variance in expression from ICA-treated animals grouping more closely with TCD-BM controls (Figure 6C, green vs dark blue).
The majority of ICA- and GVHD-dependent genes could be resolved into 2 distinct groups, designated A and B (Figures 6B, D). Expression of group A genes was upregulated in animals with GVHD (TCD-BM + T + VEH) (Figure 6B, column 1) compared with TCD-BM only recipients, and expression in TCD-BM + T recipient mice treated with ICA remained similar to that of TCD-BM only controls. By contrast, expression of group B genes decreased in animals with GVHD (TCD-BM + T + VEH) compared with TCD-BM only controls (Figure 6B, column 1 vs columns 3 and 4), but markedly increased relative to all other conditions in TCD-BM + T animals treated with ICA (Figure 6B, column 2 vs 1, 3 and 4). Thus, in animals treated with ICA and protected from GVHD, group A genes were downregulated to control levels, and group B genes were upregulated relative to all conditions.
ICA regulates expression of genes in the IFN1 and circadian rhythm pathways
Gene ontology analysis of ICA and GVHD-dependent genes (Figure 6D) identified a small subset of group A genes associated with regulating circadian rhythm pathway, although the majority of group A genes did not map to any identifiable pathway. In contrast, the majority of group B genes were associated with the IFN1 antiviral response. Interferome analysis of group B genes identified 36 out of 52 genes (69%) to be IFN1-stimulated genes (ISGs) (Table 1). These include Ifit1, tetherin (Bst2), viperin (Rsad2), and Irf7, which are typically upregulated by viral RNA in conjunction with peroxysomal RIG-I, MDA5, and IRF3.32,33 Notably, neither changes in IFN-α cytokine levels nor changes in the expression levels of genes encoding IFN-αR1 or IFN-αR2 receptors were evident with GVHD or ICA treatment (supplemental Figure 6).
ISGs induced by ICA
| Gene name | Description | Fold change | P |
|---|---|---|---|
| Arntl | Aryl hydrocarbon receptor nuclear translocator-like | 1.64 | .00011 |
| Bst2 | Bone marrow stromal cell antigen 2 | 1.87 | .00537 |
| Cpa3 | Carboxypeptidase A3 mast cell | 1.83 | .00564 |
| Ddx60 | DEAD (Asp-Glu-Ala-Asp) box polypeptide 60 | 2.06 | .03479 |
| Dhx58 | DEXH (Asp-Glu-X-His) box polypeptide 58 | 2.13 | .00408 |
| Herc6 | Hect domain and RLD 6 | 1.87 | .00195 |
| Hsh2d | Hematopoietic SH2 domain containing | 1.66 | .01769 |
| Ifi27l2a | Interferon α-inducible protein 27 like 2A | 1.89 | .01071 |
| Ifi44 | Interferon-induced protein 44 | 3.05 | .00181 |
| Ifit1 | Interferon-induced protein with tetratricopeptide repeats 1 | 2.10 | .01085 |
| Ifit2 | Interferon-induced protein with tetratricopeptide repeats 2 | 2.07 | .00796 |
| Igkv6-23 | Immunoglobulin κ variable 6-23 | 4.20 | .02328 |
| Irf7 | Interferon regulatory factor 7 | 1.55 | .02016 |
| Isg15 | ISG15 ubiquitin-like modifier | 2.08 | .00542 |
| Mx1 | Myxovirus (influenza virus) resistance 1 | 2.08 | .00989 |
| Mx2 | Myxovirus (influenza virus) resistance 2 | 2.55 | .00052 |
| Lpl | Lipoprotein lipase | 1.92 | .03890 |
| Oas1a | 2'-5′ Oligoadenylate synthetase 1A | 1.64 | .00308 |
| Oas1b | 2'-5′ Oligoadenylate synthetase 1B | 2.19 | .00462 |
| Oas1g | 2'-5′ Oligoadenylate synthetase 1G | 1.75 | .00343 |
| Oas2 | 2'-5′ Oligoadenylate synthetase 2 | 3.29 | .00255 |
| Oas3 | 2'-5′ Oligoadenylate synthetase 3 | 1.78 | .01963 |
| Oasl1 | 2'-5′ Oligoadenylate synthetase-like 1 | 1.65 | .01097 |
| Oasl2 | 2'-5′ Oligoadenylate synthetase-like 2 | 1.68 | .01201 |
| Parp11 | Poly (ADP-ribose) polymerase family member 11 | 1.51 | .00655 |
| Rnf213 | Ring finger protein 213 | 1.83 | .00128 |
| Rsad2 | Radical S-adenosyl methionine domain containing 2 | 2.27 | .01089 |
| Rtp4 | Receptor transporter protein 4 | 1.62 | .02657 |
| Sass6 | Spindle assembly 6 homolog (Caenorhabditis elegans) | 1.55 | .00132 |
| Slfn2 | Schlafen 2 | 1.57 | .01767 |
| Slfn4 | Schlafen 4 | 3.46 | .00182 |
| Slfn5 | Schlafen 5 | 2.00 | .00092 |
| Trim30a | Tripartite motif-containing 30A | 2.10 | .00866 |
| Trim34a | Tripartite motif-containing 34A | 1.74 | .02671 |
| Usp18 | Ubiquitin specific peptidase 18 | 2.71 | .00332 |
| Xaf1 | XIAP associated factor 1 | 1.71 | .00268 |
Table lists the group B genes (group B genes are those upregulated by ICA in TCD-BM + T transplanted animals; see Figure 6) that were identified as ISGs by Interferome database analysis.
ICA acts via IFN1 to limit radiation damage and promote epithelial regeneration
Although traditionally associated with antiviral responses, IFN1 signaling has recently been linked to intestinal homeostasis and repair34-36 and is also reported to play a protective role in GVHD.37,38 In particular, activation of IFN1 signaling in intestinal epithelia during allo-BMT has been shown to minimize intestinal damage caused by pretransplant irradiation, improving barrier integrity and mitigating subsequent GVHD.37 Microbiota-derived indoles, including ICA, mitigate gut damage caused by both TBI (Figure 7B-G) and chemotherapy (supplemental Figure 7). Our transcriptomic data raise the possibility that ICA mitigates GVHD severity by upregulating the IFN1 pathway and limiting intestinal damage caused by pretransplant TBI. To test this, wild-type (WT) mice, or those lacking IFN1 signaling (IFNαR−/−), were treated daily with ICA or vehicle, starting 1 day prior to 11 Gy TBI. As shown in Figure 7A, ICA extended survival of WT animals (top), but not IFNαR−/− animals (bottom), following TBI. At 3 days postirradiation, ICA limited both diarrhea and translocation of bacteria from the intestinal lumen to MLN in WT animals (Figures 7B-C, left). In contrast no such protective effects were evident in IFNαR−/− animals (Figures 7B-C, right). Thus, augmentation of epithelial barrier integrity by ICA is mediated by IFN1 signaling. Accordingly, treatment with ICA following TBI also resulted in reduced villus atrophy and larger regenerating crypt foci in the small intestine of WT animals but was without effect in IFNαR−/− animals (Figures 7D-E), suggesting that ICA works via IFN1 signaling to reduce damage to the epithelial barrier following TBI, or enhance repair, or both in the absence of GVHD.
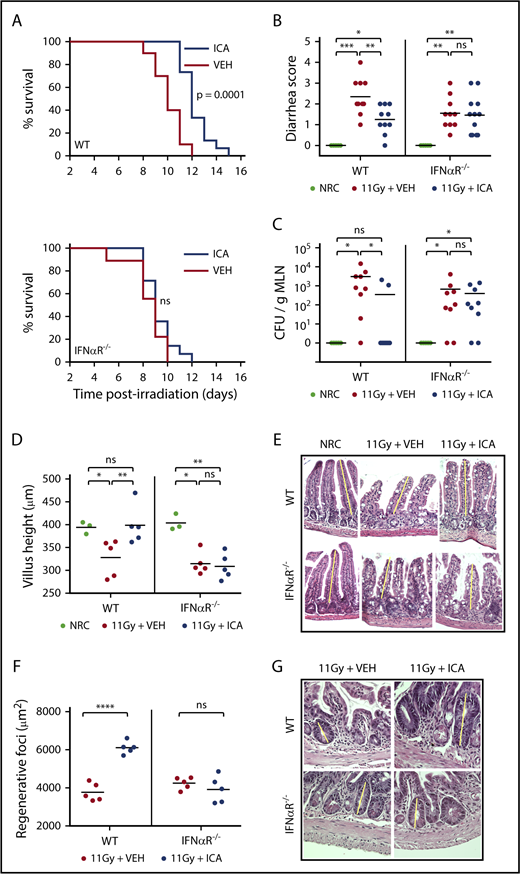
ICA reduces intestinal damage and extends survival following TBI. (A-G) C57B6 WT or C57B6 IFN-αR−/− mice were lethally irradiated (11 Gy) without subsequent BMT. Control animals were not irradiated (NRC, no radiation control). Mice received daily oral gavage with 150 mg/kg ICA or vehicle (VEH) starting 1 day prior to irradiation. Representative data from 2 experiments. (A) Kaplan-Meier survival curve (NRC, n = 5; VEH and ICA, n = 10). (B) Severity of diarrhea (day 3 postirradiation) (NRC, n = 5; VEH and ICA, n = 10). (C) Quantitation of CFU per gram MLN (day 3 postirradiation) (NRC, n = 5; VEH and ICA, n = 9). (D) Villus height (distal ileum, day 3 postirradiation) measured in H&E-stained sections (NRC, n = 3; VEH and ICA, n = 5). (E) H&E staining of distal ileum on day 3 postirradiation. Typical villus height measurements are indicated by yellow lines. Images are ×200 magnification. (F) Regenerating crypt foci. Area of regenerating crypt foci were determined by measuring height and width of foci, as identified by H&E staining (n = 5 all groups). (G) H&E staining of distal ileum on day 4 postirradiation. Yellow lines represent typical height measurements of regenerating foci. Width measurements were determined similarly. Images are ×400 magnification. Statistics: Mantel Cox log-rank (survival curve) or Kruskal-Wallis ANOVA. ****P < .0001; ***P = .0001 to .001; **P = .001 to .01; *P = .01 to .05; ns, not significant.
ICA reduces intestinal damage and extends survival following TBI. (A-G) C57B6 WT or C57B6 IFN-αR−/− mice were lethally irradiated (11 Gy) without subsequent BMT. Control animals were not irradiated (NRC, no radiation control). Mice received daily oral gavage with 150 mg/kg ICA or vehicle (VEH) starting 1 day prior to irradiation. Representative data from 2 experiments. (A) Kaplan-Meier survival curve (NRC, n = 5; VEH and ICA, n = 10). (B) Severity of diarrhea (day 3 postirradiation) (NRC, n = 5; VEH and ICA, n = 10). (C) Quantitation of CFU per gram MLN (day 3 postirradiation) (NRC, n = 5; VEH and ICA, n = 9). (D) Villus height (distal ileum, day 3 postirradiation) measured in H&E-stained sections (NRC, n = 3; VEH and ICA, n = 5). (E) H&E staining of distal ileum on day 3 postirradiation. Typical villus height measurements are indicated by yellow lines. Images are ×200 magnification. (F) Regenerating crypt foci. Area of regenerating crypt foci were determined by measuring height and width of foci, as identified by H&E staining (n = 5 all groups). (G) H&E staining of distal ileum on day 4 postirradiation. Yellow lines represent typical height measurements of regenerating foci. Width measurements were determined similarly. Images are ×400 magnification. Statistics: Mantel Cox log-rank (survival curve) or Kruskal-Wallis ANOVA. ****P < .0001; ***P = .0001 to .001; **P = .001 to .01; *P = .01 to .05; ns, not significant.
Discussion
The etiology of GVHD depends on damage to the intestinal epithelium caused by pretransplant irradiation and the consequent deleterious allogeneic inflammatory responses. Such responses include production of proinflammatory cytokines together with activation of donor T cells by host APCs that present epithelial antigens.39 The initial damage appears to initiate an inflammatory positive feedback cycle that exacerbates pathology, particularly in the intestinal tract, resulting in colitis and leakage of bacteria and bacterial factors into the lymph and blood. This report demonstrates that the microbiota, via secreted factors related to indole, can confer a protective effect by disrupting this cycle and promoting integrity of the intestinal epithelia barrier, as well as resistance to damage associated with radiation, chemotherapy, or inflammation.
Several reports indicate that indoles enhance T helper 17 responses in the intestinal tract and induce IL-22-mediated effects on stem cells.11,40 IL-22, which is produced ILC3s, protects intestinal epithelium during inflammatory bowel disease and experimental colitis by providing a signal for epithelial cell survival, proliferation, and wound healing in the stem cell compartment.41,42 During GVHD, IL-22 levels and numbers of ILC3s decline,43 which promotes loss of epithelial integrity. Notably, indoles acting via the aryl hydrocarbon receptor (AhR) have been shown to induce production of IL-22 by ILC3s.11 However, neither microarray analysis nor multiplex enzyme-linked immunosorbent assay indicated changes in AhR signaling or IL-22 production in ICA-treated animals at 21 days posttransplant, nor at any earlier time points tested. We could not directly evaluate the involvement of AhR in ICA-mediated protection from GVHD because AhR−/− mice lack not only AhR, but also ILC3s.44 Thus, transplants into AhR−/− recipients cannot distinguish potential AhR-dependent effects of ICA from those arising from the absence ILC3 cells. Secondary transplants into chimeric animals lacking AhR in either the parenchymal or hematopoietic compartment are likewise difficult to interpret, because ILC3s in chimeric animals remain of recipient origin even several months posttransplant.43
Although ICA significantly decreased intestinal damage following both TBI and chemotherapy, which likely contributed to improved outcomes, ICA treatment also led to host-specific tolerance of donor T cells in surviving animals (Figure 4), suggesting that indoles may have multiple effects at various stages of disease, and in multiple cell types or tissues. Whereas the protective response of ICA in the context of γ-irradiation depends on IFN1 responses, transcriptomic data indicate that ICA activates IFN1 responses, but only in the context of GVHD, suggesting the capacity of ICA to elicit a protective IFN1-dependent signaling response may be linked to concomitant immune-mediated inflammation. Although IFN1 signaling is typically indicative of antiviral responses, recent evidence suggests a role for IFN1 in anti-inflammatory responses as well, particularly in the intestinal tract.34-36 Although no viral infection is associated with GVHD, induction of ISGs by ICA may promote survival by stimulating tissue-protective responses akin to those required to survive viral infections.
IFN1 signaling in part mitigates GVHD by protecting the gut from radiation-induced tissue damage initiated by myeloablative conditioning prior to transplant and, by extension, activation of allogeneic T-cell responses associated with GVHD.37 IFN1 effects in this context depend on nonhematopoietic cells and require neither ILC3s nor IL-22. Protection from γ-irradiation by ICA depends on IFN1 signaling (Figure 7) and is characterized by increased barrier integrity that limits bacterial translocation (Figure 2) and by reduced damage and/or increased repair of the epithelia (Figure 7C-E). Thus, indoles acting via IFN1 signaling appear to limit epithelial damage and promote barrier integrity following γ-irrad2iation.
The observation that mortality increased as K12 colonization and urinary indole levels declined (Figure 1) and that IFN1 gene expression is elevated by ICA during this period (day 20-40) suggests that ICA signaling via IFN1 is required during this period. These data are in line with reports that IFN1 signaling primarily in the hematopoietic compartment is required to limit CD4-dependent GVHD in the colon and augment CD8-dependent GVL responses by donor CTLs.38 Suppression of T cells in the intestinal tract by activation of IFN1 signaling does not account for all of the protective effect of indoles because decreased donor T-cell infiltration in the lungs was seen with ICA treatment. Moreover, GVL, which appears unaffected by ICA (Figure 5), typically requires both CD4- and CD8-dependent T-cell responses.45
The capacity to dissociate GVHD from GVL with ICA or with colonization of the intestinal tract with tryptophanase-producing microbes may prove clinically significant. A concern with any prophylactic GVHD therapy is that the activation and proliferation of alloreactive T cells is suppressed, but not eliminated, such that withdrawal of the prophylactic drug would lead to recrudescence of T-cell activation. However, our data show that even short-term treatment with ICA, initiated at the time of transplant, promoted survival, and that recipient strain-specific tolerance of donor T cells was evident after 45 days of ICA exposure. Moreover, although the full protective effects of ICA were realized when it was administered only early posttransplant (day −2 to 12), an additional protective effect was evident when ICA was provided only after day 12 (Figure 4B). The reconstitution of normal levels of CD4+ and CD8+ donor-derived T cells after ICA treatment suggests that enteral ICA administration did not lead to global immunosuppression nor to any dysfunction of engrafted donor T cells that would pose an increased risk for opportunistic infections in those treated with ICA. Indeed, the capacity of donor-derived T cells from ICA-treated survivors to respond upon retransplantation or in MLRs suggests that ICA promotes development of recipient-specific tolerance rather than anergy. Accordingly, the preservation of the GVL effect in the presence of ICA suggests that activation of donor T cells by hemato-lymphoid antigens outside of the intestinal tract persists and results in killing of allo-antigen-expressing recipient-type leukemia cells. Previous studies have shown that low urinary 3-IS levels are correlated with severity of GVHD.19 However, ours is the first showing that enteral administration of ICA or indole expressing microbes can provide prophylactic cytoprotective activity in GVHD while maintaining GVL responses. The lack of evident toxicity following ICA administration and its presence as a prebiotic nutraceutical in a variety of common food stuffs14,46 support its further evaluation as a therapeutic for GVHD.
The online version of this article contains a data supplement.
The publication costs of this article were defrayed in part by page charge payment. Therefore, and solely to indicate this fact, this article is hereby marked “advertisement” in accordance with 18 USC section 1734.
Acknowledgments
The C1498ff tumor cell line was a kind gift from Bruce Blazar at the University of Minnesota. Tissue was processed for histological analysis by the Winship Research Pathology Core, Emory University. Cytokine analysis was performed by the Human Immune Monitoring Center at Stanford University.
This work was supported in part by the Emory Integrated Genomics Core and the Emory Integrated Computational Core, which are subsidized by the Emory University School of Medicine and are part of the Emory Integrated Core Facilities, and also by the Cancer Animal Models Shared Resource, a core supported by the Winship Cancer Institute of Emory University. Additional support was provided by the Georgia Clinical & Translational Science Alliance of the National Institutes of Health under award number UL1TR002378. This work was also supported by National Institute of Diabetes and Digestive and Kidney Diseases (R01DK074731) (D.K.), National Institute on Aging (R21AG054903) (D.K.), National Cancer Institute (R01CA188523) (E.K.W.), and National Heart, Lung, and Blood Institute (P01HL086773) (E.K.W.), National Institutes of Health; by an Emory University Research Committee Pilot award (D.K. and C.R.G.); by a Children’s Center for Transplantation and Immune-Mediated Disorders and Children’s Healthcare of Atlanta Pilot award (D.K., E.K.W., and M.Q.); by an American Society of Hematology Research Training Award for Fellows and a Rochfort Fellowship Award (Z.D.); by Crohn's and Colitis Foundation's Broad Medical Research Program Award (510260) (C.C. and D.K.); and by the National Center for Advancing Translational Sciences of the National Institutes of Health (UL1TR000454 and KL2TR000455) (M.Q.).
The content is solely the responsibility of the authors and does not necessarily reflect the official views of the National Institutes of Health.
Authorship
Contribution: A. Swimm and C.R.G. designed experiments, collected data, analyzed data, and prepared the manuscript; E.K.W., D.K., and M.Q. designed experiments, analyzed data, and prepared the manuscript; Z.D, S.R.,C.C., and A. Sharma designed experiments, collected, and analyzed data; and A.U.A., R.S., and D.P. collected and analyzed data.
Conflict-of-interest disclosure: E.K.W., D.K., A. Swimm, C.R.G., and S.R. have applied for a patent on “Methods of Managing Graft Versus Host Disease (GVHD) Using Indole Carboxyaldehydes or Derivatives Thereof.” The remaining authors declare no competing financial interests.
Correspondence: Daniel Kalman, 615 Michael St, Whitehead Research Building, Atlanta, GA 30322; e-mail: dkalman@emory.edu; and Edmund K. Waller, 1365B Clifton Rd, Winship Cancer Institute, Atlanta, GA 30322; e-mail: ewaller@emory.edu.

This feature is available to Subscribers Only
Sign In or Create an Account Close Modal