

TO THE EDITOR:
Several studies recently reported so-called racial differences between whites and blacks in certain processes involved in thrombosis and hemostasis.1-5 Among these reports was the finding that the A allele of the rs773902 single-nucleotide polymorphism (SNP) in the PAR4 gene (F2RL3), which creates a threonine residue at 120 protein position (Thr120) in place of alanine, was more common in blacks than in whites and was associated with higher PAR4-induced human platelet aggregation and Ca2+ flux.2 However, the geographic ancestry of study participants was ambiguous in these studies. Instead, self-identified race and ethnicity was employed, and population clusters of blacks and whites were identified, which were then verified with principal component analysis.2-4 Hence, attributes such as race, white, and black were used, classifications approved by the American Medical Association. However, the term blacks primarily referring to individuals with sub-Saharan African ancestry does not represent a homogeneous population, and populations in this category do not display a similar frequency of PAR4 Thr120 variant. We show here that the allele frequency of this SNP varies widely across sub-Saharan African populations.
Using pyrosequencing,6 we genotyped the PAR4 rs773902 SNP in the DNA of 101 unrelated ethnic Somali students and staff at the East Africa University in Bosaso, Puntland, Somalia, with different birth places in Somalia. Ethical permission was provided by the East Africa University in the state of Puntland, Somalia, and by the local ethics committee in Linköping, Sweden. Written informed consent was obtained from all study participants. DNA sequences flanking the mentioned SNP were amplified, employing polymerase chain reaction (PCR) primers ACCATGCTGCTGATGAACCTC (forward primer) and CAGGTGGTAGGCGATCCG (biotinylated reverse primer). The PCR reaction was run on a GeneAmp PCR 9700 system (Applied Biosystems; Bedford, MA), with initial hold step at 95°C for 15 minutes, followed by 50 cycles at 95°C for 30 seconds, 64°C for 45 seconds, and 72°C for 60 seconds and finally at 72°C for 5 minutes. Sequencing primer TGCTGATGAACCTCG was used for pyrosequencing, which was run on a PyroMark Q24 instrument (Qiagen, Hilden, Germany). PAR4 rs773902 SNP genotype data for different world populations were collected from the 1000 Genomes Project (1000 GP)7 as well as from the HapMap database,8 and the relative standard deviation vis-à-vis distribution of the A allele was calculated. Population haplotype and heterozygosity were analyzed using the Human Genome Diversity Project (HGDP) browser,9 as described by Conrad et al.10
We found divergent and inverse allele frequencies of the PAR4 rs773902 SNP in the Somali population compared with data previously reported for blacks in the United States.2 The A allele frequency of the PAR4 rs773902 SNP in Somalis was 38% compared with the previously reported 63% for blacks2 or 68% for Esan individuals in Nigeria according to the 1000 GP.7 Somali genotype data for the rs773902 SNP were instead closer to those of the Maasai people in Kenya (A allele frequency, 41%), as reported in the HapMap project,8 indicative of regional differences between West and East African populations (Figure 1A). Also, the frequency of this SNP in the Somali population (38%) was not far from that found in Peruvians from Lima, Peru (31%), reported in the 1000 GP (Figure 1A). As shown in Figure 1B, there are also significant variations within continents or even subcontinents regarding the frequency of the PAR4 rs773902 SNP, making geographical ancestry and/or ethnolinguistic group, rather than race, more appropriate for population genetic studies in this particular case. It is worth mentioning that Somalis, like other populations in the Horn of Africa, display Eurasian admixture11,12 as a result of early back-to-Africa migrations estimated to predate the agricultural revolution.11 Somalis are nevertheless a sub-Saharan African population.
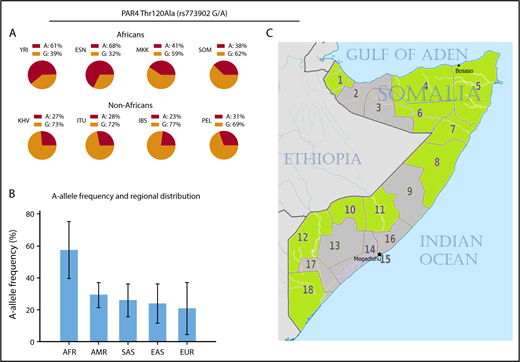
Frequencies of the PAR4 rs773902 SNP in different world populations. (A) Allele frequencies in African and non-African populations, including those reported in the 1000 GP and HapMap projects as well as the Somali genotype data presented in this letter. (B) Continental frequencies of the A allele using populations reported in the 1000 GP and HapMap projects. The African panel is represented by 6 West African and 2 East African populations. Error bars represent relative standard deviation of the mean. (C) The 18 regions of the Somali republic. Birthplaces (ie, provinces of birth) of the study participants are highlighted in green. AFR, African; AMR, admixed American; EAS, East Asian; ESN, Esan in Nigeria; EUR, European; IBS, Iberian population in Spain; ITU, Indian Telugu from the United Kingdom; KHV, Kinh in Ho Chi Minh City, Vietnam; MKK, Maasai in Kinyawa, Kenya; PEL, Peruvians from Lima, Peru; SAS, South Asian; SOM, Somalis in Puntland, Somalia; YRI, Yoruba in Ibadan, Nigeria.
Frequencies of the PAR4 rs773902 SNP in different world populations. (A) Allele frequencies in African and non-African populations, including those reported in the 1000 GP and HapMap projects as well as the Somali genotype data presented in this letter. (B) Continental frequencies of the A allele using populations reported in the 1000 GP and HapMap projects. The African panel is represented by 6 West African and 2 East African populations. Error bars represent relative standard deviation of the mean. (C) The 18 regions of the Somali republic. Birthplaces (ie, provinces of birth) of the study participants are highlighted in green. AFR, African; AMR, admixed American; EAS, East Asian; ESN, Esan in Nigeria; EUR, European; IBS, Iberian population in Spain; ITU, Indian Telugu from the United Kingdom; KHV, Kinh in Ho Chi Minh City, Vietnam; MKK, Maasai in Kinyawa, Kenya; PEL, Peruvians from Lima, Peru; SAS, South Asian; SOM, Somalis in Puntland, Somalia; YRI, Yoruba in Ibadan, Nigeria.
Although populations with Northern and Western European ancestry are relatively homogeneous, the situation is far more complex in sub-Saharan Africa. As the birthplace of Homo sapiens, Africa hosts the highest level of genetic diversity in the world in both nuclear and mitochondrial genomes.13 We compared the haplotype structures of a 100-kbp segment on chromosome 19 encompassing the PAR4 gene (Figure 2A) among populations on different continents using the HGDP. The HGDP does not contain Somali data, but the 3 other sub-Saharan African populations analyzed (San, Pygmy, and Bantu) showed highly mosaic and complex haplotype structures compared with non-Africans (Figure 2B), consistent with previously reported data showing that African haplotype blocks are more diverse, are shorter in length, and have lower levels of linkage disequilibrium compared with their counterparts in non-Africans.14 The heterozygosity pattern in the same chromosomal region also suggested a higher degree of allelic variation in sub-Saharan Africans when compared with Europeans (Figure 2C-D). The San, a population in southern Africa, showed the greatest reduction in heterozygosity among the 3 African populations. In contrast, the heterozygosity score of the Basque population, as well as Sardinian and Adygei populations, considered outliers in the European gene pool,15,16 did not substantially deviate from the average heterozygosity score of whites. Thus, comparing blacks and whites is not justifiable in this case, and classifications such as black race and black ethnicity do not make sense in medical settings. The case of African Americans is particularly problematic. Although many of the earliest African Americans may trace their ancestry to West Africa, other African Americans may descend from elsewhere on the African continent, and these may not necessarily share disease haplotypes with the former.
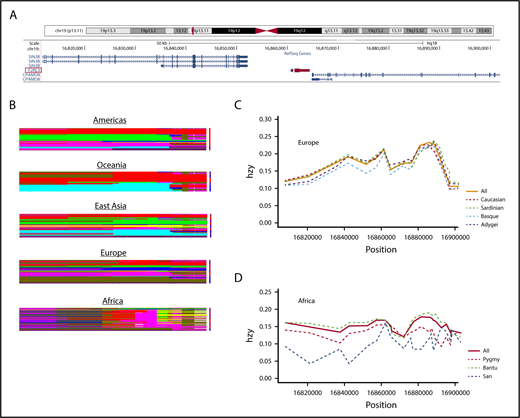
Haplotype and heterozygosity variations for populations in different continents using a 100-kbp region on chromosome 19 encompassing the PAR4 gene (F2RL3). (A) Snapshot viewing the region examined, which encodes 3 genes including F2RL3, utilizing the University of California Santa Cruz genome browser. The F2RL3 gene (3747 base pairs) is highlighted in red. (B) Continental haplotype plots. Rows and columns represent haplotypes and SNPs, respectively. Haplotypes of the same color are identical. The complexity of African haplotypes (shown here as denser and richer mosaics) is a result of haplotype diversity and lower degree of linkage disequilibrium. (C) Heterozygosity scores for European populations. Dashed lines denote subpopulations; solid line represents the average (all). For European populations, combined heterozygosity scores for Caucasians are also included. Horizontal axis shows position of chromosome 19, and vertical axis represents heterozygosity (hzy). European populations included are: Adygei (purple), Basque (blue), Sardinian (green), and Caucasian (red). (D) Heterozygosity graph similar to that shown in panel C for African populations, including San (blue), Pygmy (red), and Bantu (green). Note the higher heterozygosity variation in African populations compared with Europeans.
Haplotype and heterozygosity variations for populations in different continents using a 100-kbp region on chromosome 19 encompassing the PAR4 gene (F2RL3). (A) Snapshot viewing the region examined, which encodes 3 genes including F2RL3, utilizing the University of California Santa Cruz genome browser. The F2RL3 gene (3747 base pairs) is highlighted in red. (B) Continental haplotype plots. Rows and columns represent haplotypes and SNPs, respectively. Haplotypes of the same color are identical. The complexity of African haplotypes (shown here as denser and richer mosaics) is a result of haplotype diversity and lower degree of linkage disequilibrium. (C) Heterozygosity scores for European populations. Dashed lines denote subpopulations; solid line represents the average (all). For European populations, combined heterozygosity scores for Caucasians are also included. Horizontal axis shows position of chromosome 19, and vertical axis represents heterozygosity (hzy). European populations included are: Adygei (purple), Basque (blue), Sardinian (green), and Caucasian (red). (D) Heterozygosity graph similar to that shown in panel C for African populations, including San (blue), Pygmy (red), and Bantu (green). Note the higher heterozygosity variation in African populations compared with Europeans.
The HapMap and 1000 GP international projects have substantially contributed to our understanding of the human genome and population genetics. However, data provided by these organizations have limitations, because many regions and indeed a majority of the ethnolinguistic groups of the world are not covered. For example, only 7 of the 26 populations included in the 1000 GP represent African ancestry, despite the remaining 19 belonging to a single branch of the initial human diversity that left Africa ∼60 000 years ago. Moreover, of the 7 African populations in the 1000 GP, 6 represent ancestry in West Africa and just 1 elsewhere on the continent. Caution should therefore be taken when interpreting the information presented in these genetic databases.
In conclusion, we show that the allele frequency of the PAR4 rs773902 SNP in the Somali population is markedly different to that previously reported for blacks. Ethnicity based on geographical ancestry (eg, African Americans of West African ancestry, rather than black race or blacks) is preferred when investigating alleles associated with platelet reactivity or with any other physiological condition. Use of self-identified race and ethnicity and principal component analysis alone are not sufficient to establish a population structure with broad African designation. A better reference database of African variation will also be required. It is hoped that ongoing efforts, such as the African Genome Variation Project,17 will illuminate the genetic variation in Africa. In addition, sequencing or genotyping of sufficiently large numbers of DNA samples from each of the various ethnolinguistic groups of the world will be necessary in the future to acquire deep understanding of common disease alleles among human populations.
Acknowledgments
The authors acknowledge the students and staff of the East Africa University in Bosaso, Puntland, Somalia, for their enthusiasm in participating in this study.
Authorship
Contribution: M.K.H. designed the research, performed the analysis, and edited the manuscript; T.L.L. designed the research and edited the manuscript; and A.O. designed the research, analyzed the data, and wrote the paper.
Conflict-of-interest disclosure: The authors declare no competing financial interests.
Correspondence: Abdimajid Osman, Department of Clinical Chemistry, Ingång 64, plan 11, SE-581 85 Linköping, Sweden; e-mail: majid.osman@liu.se.

This feature is available to Subscribers Only
Sign In or Create an Account Close Modal