

Key Points
CD44 is a RAS/STAT5-dependent target in neoplastic mast cells and correlates with aggressiveness of mastocytosis.
Depletion of CD44 in neoplastic mast cells is associated with reduced invasion and prolonged survival in SCID mice.

Abstract
The Hermes receptor CD44 is a multifunctional adhesion molecule that plays an essential role in the homing and invasion of neoplastic stem cells in various myeloid malignancies. Although mast cells (MCs) reportedly express CD44, little is known about the regulation and function of this receptor in neoplastic cells in systemic mastocytosis (SM). We found that clonal CD34+/CD38− stem cells, CD34+/CD38+ progenitor cells, and CD117++/CD34− MCs invariably express CD44 in patients with indolent SM (ISM), SM with an associated hematologic neoplasm, aggressive SM, and MC leukemia (MCL). In addition, all human MCL-like cell lines examined (HMC-1, ROSA, and MCPV-1) displayed cytoplasmic and cell-surface CD44. We also found that expression of CD44 in neoplastic MCs depends on RAS-MEK and STAT5 signaling and increases with the aggressiveness of SM. Correspondingly, higher levels of soluble CD44 were measured in the sera of patients with advanced SM compared with ISM or cutaneous mastocytosis and were found to correlate with overall and progression-free survival. To investigate the functional role of CD44, a xenotransplantation model was employed using severe combined immunodeficient (SCID) mice, HMC-1.2 cells, and a short hairpin RNA (shRNA) against CD44. In this model, the shRNA-mediated knockdown of CD44 resulted in reduced MC expansion and tumor formation and prolonged survival in SCID mice compared with HMC-1.2 cells transduced with control shRNA. Together, our data show that CD44 is a RAS-MEK/STAT5-driven MC invasion receptor that correlates with the aggressiveness of SM. Whether CD44 can serve as therapeutic target in advanced SM remains to be determined in forthcoming studies.
Introduction
Mastocytosis is a neoplasm defined by abnormal expansion and multifocal accumulation of clonal mast cells (MCs) in one or more organ systems.1-8 The disease can be divided into cutaneous and systemic variants.7-15 Cutaneous mastocytosis (CM) usually manifests in childhood and shows a benign and often self-limiting clinical course.13,15 Systemic mastocytosis (SM) is diagnosed primarily in adults and is defined by involvement of visceral organs.5-12 These patients have persistent disease affecting multilineage and MC-committed hematopoietic progenitors. In most cases, the recurrent KIT mutation D816V is detected.16-19 Depending on the subtype of SM, this mutation is found in neoplastic MCs but may also be detected in other leukocytes and even in immature CD34+ stem cells (SCs) and progenitor cells (PCs) in the bone marrow (BM).16,19,20 In addition, MCs in SM typically express CD2 and/or CD25 in an aberrant manner.5-12,20-22
The clinical course in SM is variable, ranging from indolent entities to aggressive variants with short survival times.2-12,23-25 Aggressive SM (ASM) is characterized by marked or even excessive infiltration of internal organs by neoplastic MCs with subsequent organ damage.9-12,23-25 MC leukemia (MCL) is a rare, fatal subvariant characterized by devastating expansion of MCs in hematopoietic tissues.9-12,23-27 The prognosis in MCL is particularly poor.23-28
So far, little is known about mechanisms and molecules contributing to malignant expansion of neoplastic MCs and their progenitors in patients with advanced SM. The KIT mutation D816V is also expressed in neoplastic MCs in indolent SM (ISM),18-20 which argues against its role in disease progression. More recently, a number of additional molecular defects have been identified in neoplastic cells in advanced SM.29-33 These lesions are considered to promote oncogenic signaling and disease progression.34 Moreover, the genetic background, epigenetic events, and the microenvironment may contribute to clonal expansion and abnormal distribution of neoplastic MCs in SM.35-39 One important aspect is the interaction between clonal cells and the tissue microenvironment. These interactions are considered to facilitate the distribution and homing of SCs and MCs, with subsequent accumulation in various organs. With regard to MC accumulation, several different adhesion molecules, including CD2, CD47, CD54, and CD58, have been discussed as functionally relevant antigens.40-44 However, little is known about invasion receptors contributing to homing of neoplastic SCs and MCs in advanced SM.
The Hermes receptor CD44 has been implicated in the homing of lymphocytes and normal SCs in hematopoietic organs.45,46 In addition, CD44 has been described as a functionally relevant marker in normal hematopoietic SCs as well as in neoplastic SCs in various myeloid malignancies.46-53 In particular, CD44 is considered to contribute to critical SC functions, including SC homing to the niche, maintenance of quiescence, and survival.49-53 These functional contributions of CD44 to SC biology rely on its communication with neighboring molecules and cells in the niche.49-53 Numerous functionally distinct isoforms of CD44 have been described.45,46,50,54,55 The isoform CD44v6 has especially been implicated in the pathogenesis of hematologic neoplasms and solid tumors.45,46,50,54-62 Relevant ligands of CD44 include hyaluronan, collagen, fibronectin, certain selectins, and osteopontin.45,46,50,51
We and others have previously shown that normal tissue MCs express CD44.63-65 In addition, it has been described that neoplastic MCs in SM react with antibodies against CD44.40,66,67 However, little is known about the function and prognostic impact of CD44 in neoplastic MCs. The aims of our study were to examine the expression, regulation, function, and prognostic impact of CD44 in neoplastic SCs and MCs in various forms of SM and to correlate CD44 expression with the type and course of disease.
Methods
Patients, isolation of cells, and cell lines
A total of 161 patients with mastocytosis were examined. Median age was 54 years (range, 10-90 years). Diagnoses were established according to criteria provided by the World Health Organization.9-12,68,69 Patients were classified as CM (n = 15), ISM (n = 79), smoldering SM (SSM; n = 7), SM with an associated hematologic neoplasm (SM-AHN; n = 40), ASM (n = 12), and MCL (n = 8). Characteristics of patients and the control cohorts are shown in Table 1 and supplemental Tables 1-3 (available on the Blood Web site). BM biopsy material and aspirate samples were obtained at diagnosis and during follow-up, after written informed consent was given. The study was approved by the ethics committee of the Medical University of Vienna and conducted in accordance with the Declaration of Helsinki. The human MC lines HMC-1 (HMC-1.1 and HMC-1.2),70,71 MCPV-1 (MCPV-1.1 through MCPV-1.4),72 and ROSA (ROSAKIT WT and ROSAKIT D816V)73 were used. Details are provided in supplemental Methods.
Patient characteristics
| Diagnosis | n | F/M | Median age, y* | Median hemoglobin, g/dL | Median platelet count, ×109/L | Median white blood cell count, ×109/L | Patients with a known KIT mutation, % | Median % of MCs in BM sections by IHC† | Median serum tryptase, ng/mL | Median alkaline phosphatase, U/L |
|---|---|---|---|---|---|---|---|---|---|---|
| CM | 15 | 2.0 | 45 | 13.8 | 236 | 6.1 | 45.5 | <1 | 12.0 | 75 |
| ISM | 79 | 1.2 | 47 | 14.0 | 238 | 6.5 | 85.3 | 10.0 | 37.3 | 72 |
| SSM | 7 | 2.5 | 47 | 13.7 | 221 | 6.2 | 100.0 | 40.0 | 252.0 | 124 |
| SM-AHN | 40 | 0.3 | 65 | 10.7 | 75 | 9.3 | 84.2 | 15.0 | 105.5 | 130 |
| ASM | 12 | 0.5 | 58 | 10.3 | 106 | 5.9 | 83.3 | 25.0 | 113.5 | 194 |
| MCL | 8 | 0.6 | 60 | 10.0 | 61 | 5.3 | 75.0 | 75.0 | 431.5 | 101 |
| RBM | 5 | All M | 68 | 11.2 | 199 | 6.1 | — | — | — | — |
| ICUS | 3 | 0.5 | 61 | 14.3 | 86 | 3.7 | — | — | — | — |
| HD | 2 | All F | 40 | 10.2 | 497 | 12.1 | — | — | — | — |
| MGUS | 4 | 0.3 | 63 | 14.8 | 207 | 8.0 | — | — | — | — |
| AL amyloidosis | 2 | 1 | 64 | 12.3 | 279 | 7.7 | — | — | — | — |
| B-NHL | 36 | 0.4 | 66 | 11.7 | 237 | 7.8 | — | — | — | — |
| T-NHL | 5 | 1.5 | 42 | 13.5 | 257 | 10.0 | — | — | — | — |
| Healthy controls | 15 | 2.0 | 32 | — | — | — | — | — | — | — |
AL, amyloid light chain; B-NHL, B-cell non-Hodgkin lymphoma; F, female; HD, Hodgkin disease (without BM involvement); ICUS, idiopathic cytopenia of undetermined significance; M, male; MGUS, monoclonal gammopathy of undetermined significance; n, number; RBM, normal reactive BM (suspected lymphoproliferative disorder); T-NHL, T-cell non-Hodgkin lymphoma; y, years.
At the time of BM or serum sampling. In most cases, BM was obtained at diagnosis.
Percentage of MCs of all nucleated cells in the BM was determined by IHC using an antibody against tryptase.
Flow cytometric evaluation of CD44 expression on neoplastic cells
Expression of CD44 on CD45+/CD117++/CD34− MCs, CD45+/CD34+/CD38− SCs, and CD45+/CD34+/CD38+ PCs was examined by flow cytometry in heparinized BM samples (after erythrocyte lysis) obtained from 56 patients with mastocytosis (CM, n = 2; ISM, n = 20; SM-AHN, n = 22; ASM, n = 6; MCL, n = 6; supplemental Tables 1 and 4) and controls (lymphoproliferative disorders and normal/reactive BM, n = 57; Table 1; supplemental Table 2). In 6 SM patients, CD44 expression on MCs, SCs, and PCs was also determined during follow-up. Moreover, in SM-AHN patients with an associated acute myeloid leukemia (AML) or chronic myelomonocytic leukemia (CMML), CD44 expression was also examined on AML blast cells or CMML monocytes. Multicolor flow cytometry was performed according to published techniques using fluorochrome-conjugated monoclonal antibodies (mAbs) (supplemental Table 5).21,41,42 The Staining Index (SI) was calculated as median fluorescence intensity (MFI) produced by CD44 antibody divided by the MFI of the isotype-matched control antibody (supplemental Figure 1). The SIs obtained for MCs in control BM samples and patients with CM were independent of the MC load (supplemental Table 6) and diagnosis (supplemental Table 7). Flow cytometry was also performed to determine expression of CD44 on cell lines. MC lines were incubated with drugs for 48 or 96 hours before flow cytometry was performed. Details are described in supplemental Methods.
Immunohistochemistry (IHC) and immunocytochemistry (ICC)
IHC was performed on BM biopsy specimens of 12 patients with SM (supplemental Tables 1-4) and 1 patient with normal/reactive BM using mAbs against CD44 (DF1485) and tryptase (G3) as described previously.22,38,66 ICC was performed on cytospin preparations of 8 human MC lines and primary MCs of 2 patients with MCL using anti-CD44 mAb (DF1485) according to a published protocol.73,74 A detailed description of the staining techniques is provided in supplemental Methods.
Measurement of soluble CD44 (sCD44) in patients with SM
In 129 mastocytosis patients and 15 healthy controls (Table 1; supplemental Tables 1, 3, and 4), serum samples were examined for sCD44 levels using a commercial enzyme-linked immunosorbent assay (ELISA; Affymetrix eBioscience, Santa Clara, CA). The median age of healthy controls (32 years) was lower than that of mastocytosis patients (52 years). In 11 SM patients, sCD44 levels were determined at diagnosis and during follow-up. Details are described in supplemental Methods.
Quantitative PCR (qPCR)
CD44 messenger RNA (mRNA) levels were examined by qPCR in cell lines and in isolated mononuclear cells of 12 SM patients and 15 controls (supplemental Tables 1-4). Details are described in supplemental Methods. In addition, ROSA cells were incubated with the MEK1/2 inhibitor RDEA119 (refametinib) (0.1-5 µM) for 24 hours before qPCR was performed. PCR primer sequences are shown in supplemental Table 8.
Lentiviral transduction experiments
HMC-1.2 and ROSAKIT WT cells were transduced with K-RAS G12V, K-RAS WT, STAT5 S710F, or STAT5 WT as described previously72,75 or STAT5 short hairpin RNA (shRNA) (supplemental Table 9) or control shRNA as reported elsewhere.75,76 Afterward, CD44 expression was examined by flow cytometry. STAT5 knockdown was confirmed by qPCR (supplemental Figure 2A-B). For cell-mixing experiments, CD44 shRNA (supplemental Table 9) or control shRNA was transduced into HMC-1.2 cells using SGEP vector.77 CD44 knockdown was confirmed by flow cytometry (supplemental Figure 3A). The relative proliferative potential of transfected cells was determined by mixing with untransfected native cells (1:1). For in vivo xenograft studies, HMC-1.2 cells transduced with CD44 shRNA (supplemental Table 9) or control shRNA were used. Technical details are provided in supplemental Methods.
Xenograft mouse model
BALB/c severe combined immunodeficient (SCID) mice were used for animal experiments, consistent with United Kingdom Coordinating Committee on Cancer Research guidelines for the welfare and use of animals in cancer research.78 Experiments were approved by the local licensing authority (Hamburg, Germany) under project number G10/100. HMC-1.2 cells transduced with CD44 shRNA or control shRNA were injected subcutaneously into 15 SCID mice in each group. Data on survival, ulceration status, and tumor weight were captured. After DNA extraction from murine lungs, BM, and peripheral blood (PB), human Alu-sequence-specific qPCR was performed to quantify engraftment of HMC-1.2 cells as described previously.79,80 Technical details are described in supplemental Methods.
Statistical evaluation of data
All statistical methods used for data evaluation are described in supplemental Methods.
Results
Detection of cytoplasmic CD44 and CD44 mRNA in neoplastic MCs
As determined by IHC, neoplastic MCs expressed cytoplasmic CD44 regardless of the subtype of SM (Figure 1A-B). In all SM patients, the spindle-shaped tryptase+ MCs in the BM infiltrates were found to react with an antibody against CD44 (Figure 1A-B). No substantial differences in staining patterns or the intensity of cytoplasmic staining of MCs were found when comparing various groups of SM patients. Normal BM cells in the noninfiltrated marrow space in SM and control BM samples exhibited only low levels of CD44 (Figure 1A-B; supplemental Figure 4). Expression of CD44 in primary neoplastic MCs was confirmed by ICC (Figure 1C). We were also able to show that cytoplasmic CD44 is expressed in all human MC lines tested (Figure 1D). Finally, primary neoplastic MCs (Figure 1E) and all MC lines tested displayed CD44 mRNA in our qPCR experiments (Figure 1F). HMC-1 and MCPV-1 cells expressed higher levels of CD44 mRNA than ROSA or the chronic myeloid leukemia cell lines tested (Figure 1F).
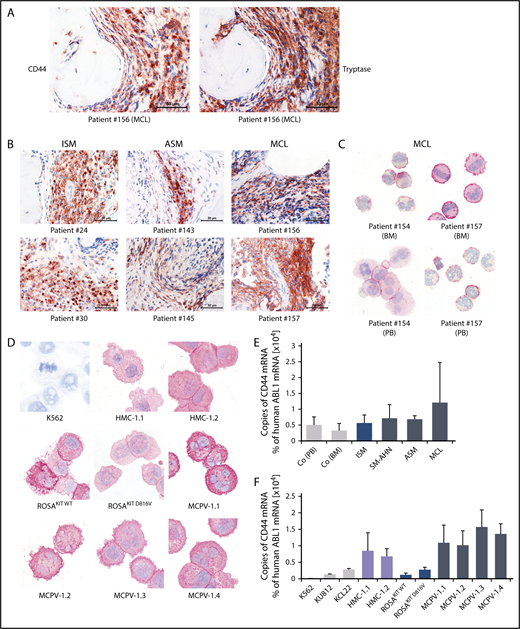
Detection of CD44 in neoplastic MCs by immunostaining and qPCR. (A) BM sections of a patient with MCL (patient 156 in supplemental Table 1) were stained by IHC with an antibody against CD44 (left) and tryptase (right). The spindle-shaped tryptase+ MCs coexpressed CD44. (B) CD44 was also stained in BM sections of patients with ISM (left), ASM (middle), and MCL (right). In all patients examined, CD44 was found to be expressed in the cytoplasm of neoplastic MCs. (C) CD44 expression in primary neoplastic BM MCs (top) and circulating PB MCs (bottom) was analyzed by ICC in 2 patients with MCL. (D) In addition, CD44 expression was determined in the human MC lines HMC-1, ROSA, and MCPV-1. The chronic myeloid leukemia (CML) cell line K562 served as a negative control. MCs stained positive for CD44 in all MCL patients (C) and cell lines (D) tested. Slides were examined using an Olympus DP21 camera connected to an Olympus BX50F4 microscope (Olympus Corporation; Shinjuku, Tokyo, Japan) equipped with 60×/0.90 UPlanFL (IHC) or 100×/1.35 UPlanAPO (Oil Iris; ICC) objective lenses. Images were prepared with 1000× (ICC) or 600× (IHC) magnifications and adjusted by Adobe Photoshop CS5 software version 12.0.4 (Adobe Systems, San Jose, CA). (E) CD44 mRNA expression in mononuclear cells (MNCs) obtained from BM of patients with ISM (n = 3), SM-AHN (n = 4), ASM (n = 2), or MCL (n = 3) or from normal/reactive BM (n = 9) and PB of 6 healthy controls was analyzed by qPCR. (F) CD44 mRNA expression levels were also analyzed by qPCR in various MCL-like cell lines (HMC-1, ROSA, and MCPV-1) and in the CML cell lines K562, KU812, and KCL22. Results are shown as percentage of CD44 mRNA copies relative to ABL1 mRNA levels and are expressed as mean ± standard deviation (SD) of all donors in each group (E) or as mean ± SD of 3 independent experiments (F).
Detection of CD44 in neoplastic MCs by immunostaining and qPCR. (A) BM sections of a patient with MCL (patient 156 in supplemental Table 1) were stained by IHC with an antibody against CD44 (left) and tryptase (right). The spindle-shaped tryptase+ MCs coexpressed CD44. (B) CD44 was also stained in BM sections of patients with ISM (left), ASM (middle), and MCL (right). In all patients examined, CD44 was found to be expressed in the cytoplasm of neoplastic MCs. (C) CD44 expression in primary neoplastic BM MCs (top) and circulating PB MCs (bottom) was analyzed by ICC in 2 patients with MCL. (D) In addition, CD44 expression was determined in the human MC lines HMC-1, ROSA, and MCPV-1. The chronic myeloid leukemia (CML) cell line K562 served as a negative control. MCs stained positive for CD44 in all MCL patients (C) and cell lines (D) tested. Slides were examined using an Olympus DP21 camera connected to an Olympus BX50F4 microscope (Olympus Corporation; Shinjuku, Tokyo, Japan) equipped with 60×/0.90 UPlanFL (IHC) or 100×/1.35 UPlanAPO (Oil Iris; ICC) objective lenses. Images were prepared with 1000× (ICC) or 600× (IHC) magnifications and adjusted by Adobe Photoshop CS5 software version 12.0.4 (Adobe Systems, San Jose, CA). (E) CD44 mRNA expression in mononuclear cells (MNCs) obtained from BM of patients with ISM (n = 3), SM-AHN (n = 4), ASM (n = 2), or MCL (n = 3) or from normal/reactive BM (n = 9) and PB of 6 healthy controls was analyzed by qPCR. (F) CD44 mRNA expression levels were also analyzed by qPCR in various MCL-like cell lines (HMC-1, ROSA, and MCPV-1) and in the CML cell lines K562, KU812, and KCL22. Results are shown as percentage of CD44 mRNA copies relative to ABL1 mRNA levels and are expressed as mean ± standard deviation (SD) of all donors in each group (E) or as mean ± SD of 3 independent experiments (F).
Neoplastic MCs express high levels of cell-surface CD44
As assessed by flow cytometry, CD44 was found to be expressed on HMC-1, ROSA, and MCPV-1 cells as well as on all non-MC lines tested, except K562 (supplemental Figure 5A-B). HMC-1.2 and ROSAKIT D816V cells exhibited higher levels of CD44 than HMC-1.1 and ROSAKIT WT cells lacking KIT D816V (supplemental Figure 5C). Moreover, in all 56 mastocytosis patients tested, primary neoplastic CD117++/CD34− MCs expressed CD44 (Figure 2A; supplemental Table 4). Normal/reactive BM MCs also expressed CD44 (Figure 2A; supplemental Table 2). However, levels of surface CD44 on neoplastic MCs were significantly higher than on MCs in normal/reactive BM (P < .05) (Figure 2A). Moreover, median CD44 expression on neoplastic MCs was found to increase with the aggressiveness of SM (Figure 2A).
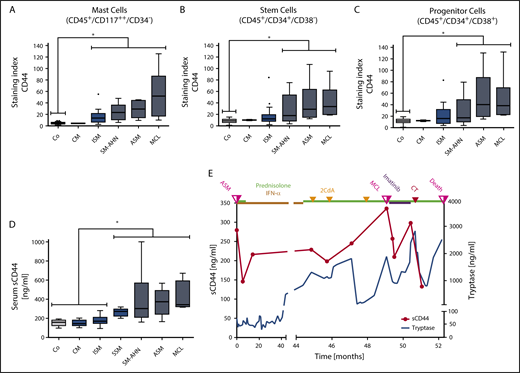
Detection of CD44 on the surface of neoplastic cells and in the sera of patients with mastocytosis. (A) BM cells obtained from controls (Co; patients with lymphoproliferative neoplasms or normal/reactive BM, n = 44) and patients with CM (n = 2), ISM (n = 20), SM-AHN (n = 22), ASM (n = 6), or MCL (n = 6) were analyzed by multicolor flow cytometry. Expression of CD44 on CD45+/CD117++/CD34− MCs is expressed as SI (MFI produced by CD44 antibody/MFI of the isotype-control antibody). (B-C) CD44 expression on CD34+/CD38− SCs (B) and CD34+/CD38+ PCs (C) was analyzed in BM samples of controls (Co; patients with lymphoproliferative neoplasms or normal/reactive BM, n = 55) and patients with CM (n = 2), ISM (n = 20), SM-AHN (n = 21), ASM (n = 6), or MCL (n = 6) by multicolor flow cytometry and is expressed as SI. Results are shown as boxplots (Tukey) and represent median values (black horizontal lines), the 25th to 75th percentiles (gray boxes), ranges (whiskers), and outliers (black dots). *P < .05 compared with control (Dunn’s multiple comparisons test). As visible, MCs, SCs, and PCs expressed higher levels of CD44 in advanced SM compared with CM or controls. (D) sCD44 (ng/mL) in the sera of healthy controls (Co; n = 15) or patients with CM (n = 15), ISM (n = 74), SSM (n = 7), SM-AHN (n = 20), ASM (n = 9), or MCL (n = 4) was measured by ELISA. Results are shown as boxplots (Tukey) and represent median values (black horizontal bars), the 25th to 75th percentiles (gray boxes), ranges (whiskers), and outliers (black dots). *P < .05 compared with control, CM, or ISM (Dunn’s multiple comparisons test). As visible, sCD44 levels in advanced SM were higher compared with ISM, CM, or healthy controls. (E) sCD44 (ng/mL) and serum tryptase (ng/mL) were measured over 52.3 months in the sera of a 21-year-old male patient with KIT D816V-negative ASM (patient 149 in supplemental Table 1). Initially, the patient received prednisolone (50 mg/day) and interferon-α (IFN-α) (3 × 10⁶ international units every second day). Because of resistance, the patient then received 3 cycles of cladribine (2CdA) (0.14 mg/kg, days 1-5) combined with prednisolone (12.5 mg/day). Despite therapy, the patient progressed to MCL. After progression to MCL (KIT D816V negative), the patient first received imatinib (400 mg/day) and prednisolone (25 mg/day), which was followed by a transient decrease in tryptase and sCD44 levels. However, no major response was achieved and the patient was then treated with induction polychemotherapy (CT) consisting of daunorubicin (45 mg/m2, days 1-3), etoposide (100 mg/m2, days 1-5), and cytarabine (2 × 100 mg/m2, days 1-7), (DAV 3+5+7 protocol). However, despite a short-lived response, the patient died 3.2 months after progression to MCL. sCD44 and tryptase levels decreased after induction polychemotherapy and increased with disease progression.
Detection of CD44 on the surface of neoplastic cells and in the sera of patients with mastocytosis. (A) BM cells obtained from controls (Co; patients with lymphoproliferative neoplasms or normal/reactive BM, n = 44) and patients with CM (n = 2), ISM (n = 20), SM-AHN (n = 22), ASM (n = 6), or MCL (n = 6) were analyzed by multicolor flow cytometry. Expression of CD44 on CD45+/CD117++/CD34− MCs is expressed as SI (MFI produced by CD44 antibody/MFI of the isotype-control antibody). (B-C) CD44 expression on CD34+/CD38− SCs (B) and CD34+/CD38+ PCs (C) was analyzed in BM samples of controls (Co; patients with lymphoproliferative neoplasms or normal/reactive BM, n = 55) and patients with CM (n = 2), ISM (n = 20), SM-AHN (n = 21), ASM (n = 6), or MCL (n = 6) by multicolor flow cytometry and is expressed as SI. Results are shown as boxplots (Tukey) and represent median values (black horizontal lines), the 25th to 75th percentiles (gray boxes), ranges (whiskers), and outliers (black dots). *P < .05 compared with control (Dunn’s multiple comparisons test). As visible, MCs, SCs, and PCs expressed higher levels of CD44 in advanced SM compared with CM or controls. (D) sCD44 (ng/mL) in the sera of healthy controls (Co; n = 15) or patients with CM (n = 15), ISM (n = 74), SSM (n = 7), SM-AHN (n = 20), ASM (n = 9), or MCL (n = 4) was measured by ELISA. Results are shown as boxplots (Tukey) and represent median values (black horizontal bars), the 25th to 75th percentiles (gray boxes), ranges (whiskers), and outliers (black dots). *P < .05 compared with control, CM, or ISM (Dunn’s multiple comparisons test). As visible, sCD44 levels in advanced SM were higher compared with ISM, CM, or healthy controls. (E) sCD44 (ng/mL) and serum tryptase (ng/mL) were measured over 52.3 months in the sera of a 21-year-old male patient with KIT D816V-negative ASM (patient 149 in supplemental Table 1). Initially, the patient received prednisolone (50 mg/day) and interferon-α (IFN-α) (3 × 10⁶ international units every second day). Because of resistance, the patient then received 3 cycles of cladribine (2CdA) (0.14 mg/kg, days 1-5) combined with prednisolone (12.5 mg/day). Despite therapy, the patient progressed to MCL. After progression to MCL (KIT D816V negative), the patient first received imatinib (400 mg/day) and prednisolone (25 mg/day), which was followed by a transient decrease in tryptase and sCD44 levels. However, no major response was achieved and the patient was then treated with induction polychemotherapy (CT) consisting of daunorubicin (45 mg/m2, days 1-3), etoposide (100 mg/m2, days 1-5), and cytarabine (2 × 100 mg/m2, days 1-7), (DAV 3+5+7 protocol). However, despite a short-lived response, the patient died 3.2 months after progression to MCL. sCD44 and tryptase levels decreased after induction polychemotherapy and increased with disease progression.
Neoplastic SCs and PCs in advanced SM express high levels of CD44
SM is considered to be a SC disorder involving CD34+ SCs.20,39,81 As assessed by flow cytometry, CD34+/CD38− SCs expressed CD44 in all SM variants and all patients tested (Figure 2B; supplemental Tables 2 and 4). Significantly higher levels of CD44 were detected on CD34+/CD38− SCs in advanced SM (SM-AHN/ASM/MCL) compared with SCs in normal/reactive BM (P < .05) (Figure 2B). In contrast, the levels of CD44 on CD34+/CD38− SCs were only slightly higher in ISM than in normal/reactive BM (Figure 2B). Moreover, the median levels of CD44 on SCs increased with the aggressiveness of SM (Figure 2B). Similar results were obtained for CD34+/CD38+ PCs (Figure 2C; supplemental Tables 2 and 4). These data suggest that neoplastic SCs and PCs in advanced SM display high levels of CD44.
Comparing CD44 expression on MCs, SCs, and PCs in individual patient cohorts revealed that the levels of surface CD44 on MCs, SCs, and PCs are comparable in advanced SM, whereas in ISM and control BM samples, CD44 levels on PCs were significantly higher than CD44 levels on MCs and SCs (P < .05) (supplemental Figure 6). Finally, we found that AML blasts in patients with SM-AML and leukemic monocytes in patients with SM-CMML displayed substantial amounts of surface CD44 (supplemental Figure 7).
Levels of sCD44 correlate with the variant of mastocytosis
sCD44 was detected in the sera of patients with CM, ISM, SSM, SM-AHN, ASM, and MCL as well as in healthy controls (supplemental Tables 3 and 4). Interestingly, significantly higher levels of sCD44 were detected in patients with advanced SM (SSM, SM-AHN, ASM, and MCL) compared with those with ISM or CM or healthy controls (P < .05) (Figure 2D). Furthermore, median sCD44 levels in patients with ASM or MCL were higher than sCD44 levels in SSM or SM-AHN (Figure 2D).
CD44 levels during progression, therapy, and relapse in patients with SM
To further examine CD44 as potential biomarker in SM, we measured sCD44 and surface CD44 on neoplastic cells in 16 SM patients during follow-up. Eleven of these patients received interventional therapy (supplemental Table 10). Serum tryptase levels decreased during successful therapy and increased with disease progression (Figure 2E; supplemental Figure 8). Similarly, sCD44 levels decreased after successful therapy and increased during progression (Figure 2E; supplemental Figure 8). In patients with ISM and a stable clinical course, tryptase levels slightly increased or remained stable, and sCD44 levels did not substantially change over time (supplemental Figure 9). CD44 expression on BM MCs, SCs, and PCs increased with progression in most patients and remained stable in patients with ISM (supplemental Figure 10). During successful therapy with targeted drugs or chemotherapy, CD44 expression on neoplastic cells did not change in one patient who later relapsed (patient 154) but decreased in 2 other patients (129 and 156) (supplemental Figure 10).
Role of the RAS-MEK and STAT5 signaling pathways in expression of CD44 in neoplastic MCs
To define signaling pathways underlying CD44 expression in neoplastic MCs, we applied various signal transduction inhibitors. The KIT-targeting drugs applied (nilotinib, ponatinib, and PKC412 [midostaurin]) and the Bruton tyrosine kinase–targeting drug ibrutinib did not modulate expression of CD44 on HMC-1, ROSA, or MCPV-1 cells (supplemental Figure 11). BEZ235, an inhibitor of phosphoinositide-3-kinase and mechanistic target of rapamycin, was found to upregulate CD44 expression on all human MC lines tested (supplemental Figure 12). The MEK1/2 inhibitor RDEA119 (refametinib) was found to downregulate expression of CD44 in ROSAKIT WT and ROSAKIT D816V cells after 24 and 48 hours (Figure 3A-B). In the other cell lines examined, RDEA119 was also found to downregulate expression of CD44, but the effect was less pronounced (Figure 3A). The STAT5 blocker pimozide suppressed expression of CD44 in all human MC lines tested (Figure 3C). Since RAS activation has recently been implicated in progression of SM,30 we expressed wild-type RAS (K-RAS WT) and oncogenic K-RAS G12V in HMC-1.2 and ROSAKIT WT cells. In these experiments, K-RAS WT and K-RAS G12V augmented CD44 expression in HMC-1.2 and ROSAKIT WT cells (Figure 4A). The effect of K-RAS G12V on CD44 expression was stronger compared with that of K-RAS WT. RAS-induced expression of CD44 was reverted by RDEA119 (Figure 4B). Next, we applied shRNA against STAT5. The shRNA-mediated STAT5 knockdown (confirmed by qPCR) was found to decrease CD44 expression in HMC-1.2 and ROSAKIT WT cells (Figure 4C; supplemental Figure 2). We also overexpressed an oncogenic (mutated) variant of STAT5 (S710F) and WT STAT5 in HMC-1.2 and ROSAKIT WT cells and found that enforced expression of WT STAT5 or oncogenic STAT5 leads to an upregulation of CD44 (Figure 4D). As expected, oncogenic STAT5 produced stronger effects on CD44 expression compared with WT STAT5. Next, we tested the effects of demethylating agents (5-azacytidine, decitabine), the BET inhibitor JQ1, and lenalidomide. Both demethylating agents promoted expression of CD44 in all MC lines (Figure 5). JQ1 and lenalidomide were also found to upregulate CD44, but the effects of these drugs were less pronounced (supplemental Figure 13).

MEK inhibitors and STAT5 inhibitors downregulate expression of CD44 in neoplastic MCs. (A) HMC-1, ROSA, and MCPV-1 cells were incubated with the MEK1/2 inhibitor RDEA119 (refametinib) (0.1-5 μM) at 37°C for 48 hours. Then, expression of CD44 was analyzed by flow cytometry. Bars represent the expression levels of CD44 (SI) as percentage of dimethyl sulfoxide (DMSO) control (Co) expressed as mean ± SD of at least 3 independent experiments. *P < .05 compared with control (Student t test). (B) ROSAKIT WT and ROSAKIT D816V cells were incubated with RDEA119 (0.1-5 µM) at 37°C for 24 hours. Then, cells were subjected to RNA isolation and CD44 mRNA levels were measured by qPCR. Bars represent percentage of CD44 mRNA copies relative to ABL1 mRNA levels. Results are expressed as mean ± SD of 3 independent experiments. *P < .05 compared with control (Student t test) (left). In addition, expression of CD44 was analyzed by flow cytometry. Bars represent the expression of CD44 (SI) as percentage of DMSO control (Co) expressed as mean ± SD of 4 independent experiments. *P < .05 compared with control (Student t test) (right). (C) HMC-1, ROSA, and MCPV-1 cells were incubated with the STAT5 blocker pimozide (2.5-10 μM) at 37°C for 48 hours. Then, expression of CD44 was analyzed by flow cytometry. Bars represent the expression of CD44 (SI) as percentage of DMSO control (Co) expressed as mean ± SD of 4 independent experiments. *P < .05 compared with control (Student t test).
MEK inhibitors and STAT5 inhibitors downregulate expression of CD44 in neoplastic MCs. (A) HMC-1, ROSA, and MCPV-1 cells were incubated with the MEK1/2 inhibitor RDEA119 (refametinib) (0.1-5 μM) at 37°C for 48 hours. Then, expression of CD44 was analyzed by flow cytometry. Bars represent the expression levels of CD44 (SI) as percentage of dimethyl sulfoxide (DMSO) control (Co) expressed as mean ± SD of at least 3 independent experiments. *P < .05 compared with control (Student t test). (B) ROSAKIT WT and ROSAKIT D816V cells were incubated with RDEA119 (0.1-5 µM) at 37°C for 24 hours. Then, cells were subjected to RNA isolation and CD44 mRNA levels were measured by qPCR. Bars represent percentage of CD44 mRNA copies relative to ABL1 mRNA levels. Results are expressed as mean ± SD of 3 independent experiments. *P < .05 compared with control (Student t test) (left). In addition, expression of CD44 was analyzed by flow cytometry. Bars represent the expression of CD44 (SI) as percentage of DMSO control (Co) expressed as mean ± SD of 4 independent experiments. *P < .05 compared with control (Student t test) (right). (C) HMC-1, ROSA, and MCPV-1 cells were incubated with the STAT5 blocker pimozide (2.5-10 μM) at 37°C for 48 hours. Then, expression of CD44 was analyzed by flow cytometry. Bars represent the expression of CD44 (SI) as percentage of DMSO control (Co) expressed as mean ± SD of 4 independent experiments. *P < .05 compared with control (Student t test).
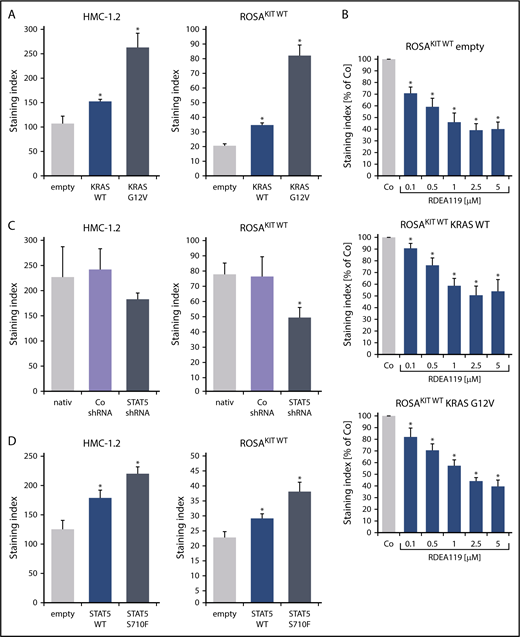
K-RAS and STAT5 upregulate expression of CD44 in neoplastic MCs. (A) HMC-1.2 (left) and ROSAKIT WT (right) cells were transduced with lentiviral vectors encoding K-RAS WT or oncogenic K-RAS G12V as described in the text. Then, expression of CD44 was analyzed by flow cytometry. Bars represent the expression of CD44 as SI (MFI produced by CD44 antibody/MFI of the isotype-control antibody). *P < .05 compared with empty vector control (Student t test). (B) ROSAKIT WT cells transduced with lentiviral vectors endcoding K-RAS WT or oncogenic K-RAS G12V were incubated with the MEK1/2 inhibitor RDEA119 (refametinib) (0.1-5 μM) at 37°C for 48 hours. Then, expression of CD44 was analyzed by flow cytometry. Bars represent the CD44 levels (SI) as percentage of DMSO control (Co) expressed as mean ± SD of 4 independent experiments. *P < .05 compared with control (Student t test). (C) HMC-1.2 (left) and ROSAKIT WT (right) cells were transduced with an shRNA against STAT5 as described in the text. Then, expression of CD44 was analyzed by flow cytometry at day 4 after transduction. Bars represent the expression CD44 as SI. *P < .05 compared with control (Co) shRNA (Student t test). (D) HMC-1.2 (left) and ROSAKIT WT (right) cells were transduced with lentiviral vectors encoding STAT5 WT or oncogenic STAT5 S710F as described in the text. Then, expression of CD44 was analyzed by flow cytometry. Bars represent the expression CD44 as SI. *P < .05 compared with empty vector control (Student t test).
K-RAS and STAT5 upregulate expression of CD44 in neoplastic MCs. (A) HMC-1.2 (left) and ROSAKIT WT (right) cells were transduced with lentiviral vectors encoding K-RAS WT or oncogenic K-RAS G12V as described in the text. Then, expression of CD44 was analyzed by flow cytometry. Bars represent the expression of CD44 as SI (MFI produced by CD44 antibody/MFI of the isotype-control antibody). *P < .05 compared with empty vector control (Student t test). (B) ROSAKIT WT cells transduced with lentiviral vectors endcoding K-RAS WT or oncogenic K-RAS G12V were incubated with the MEK1/2 inhibitor RDEA119 (refametinib) (0.1-5 μM) at 37°C for 48 hours. Then, expression of CD44 was analyzed by flow cytometry. Bars represent the CD44 levels (SI) as percentage of DMSO control (Co) expressed as mean ± SD of 4 independent experiments. *P < .05 compared with control (Student t test). (C) HMC-1.2 (left) and ROSAKIT WT (right) cells were transduced with an shRNA against STAT5 as described in the text. Then, expression of CD44 was analyzed by flow cytometry at day 4 after transduction. Bars represent the expression CD44 as SI. *P < .05 compared with control (Co) shRNA (Student t test). (D) HMC-1.2 (left) and ROSAKIT WT (right) cells were transduced with lentiviral vectors encoding STAT5 WT or oncogenic STAT5 S710F as described in the text. Then, expression of CD44 was analyzed by flow cytometry. Bars represent the expression CD44 as SI. *P < .05 compared with empty vector control (Student t test).
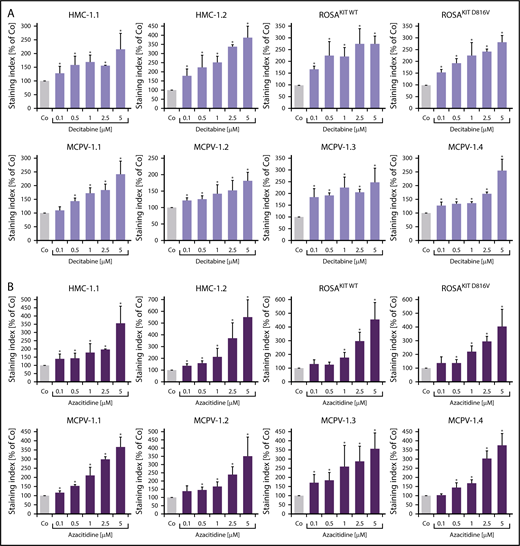
Demethylating agents upregulate expression of CD44 in neoplastic MCs. (A-B) HMC-1, ROSA, and MCPV-1.1 cells were incubated with decitabine (0.1-5 μM) (A) or 5-azacitidine (0.1-5 μM) (B) at 37°C for 96 hours. Then, expression of CD44 was analyzed by flow cytometry. Bars represent the expression of CD44 (SI) as percentage of control (Co) expressed as mean ± SD of 3 independent experiments. *P < .05 compared with control (Student t test).
Demethylating agents upregulate expression of CD44 in neoplastic MCs. (A-B) HMC-1, ROSA, and MCPV-1.1 cells were incubated with decitabine (0.1-5 μM) (A) or 5-azacitidine (0.1-5 μM) (B) at 37°C for 96 hours. Then, expression of CD44 was analyzed by flow cytometry. Bars represent the expression of CD44 (SI) as percentage of control (Co) expressed as mean ± SD of 3 independent experiments. *P < .05 compared with control (Student t test).
RNA interference–induced knockdown of CD44 is associated with reduced metastasis formation and prolonged survival in a xenograft model
First, we examined the effects of various CD44-specific shRNAs on growth of HMC-1.2 cells. However, no substantial effects of the CD44 knockdown on proliferation of HMC-1.2 cells were seen (supplemental Figure 3B). Next, we injected CD44 or control shRNA-transduced HMC-1.2 cells subcutaneously into 15 SCID mice per group. In the group inoculated with HMC-1.2 CD44-knockdown cells, 1 animal did not develop a subcutaneous tumor and was excluded from analyses. All other mice developed subcutaneous tumors consisting of HMC-1.2 cells. In mice injected with CD44-knockdown HMC-1.2 cells, we found a significantly longer survival (Figure 6A) (P < .05) and a slightly reduced growth of primary tumor nodules (Figure 6B). However, growth reduction was not significant (P > .05), and the tumor ulceration rate was not significantly influenced by the CD44 knockdown (P > .05) (Figure 6C). Next, we examined HMC-1.2 cell invasion in various mouse organs (BM, lungs, and PB) by human Alu-sequence–specific qPCR. In these experiments, lung metastasis was significantly reduced by the CD44 knockdown (Figure 6D) (P < .05). In contrast, the CD44 knockdown was only associated with a slightly lower median MC load in the PB (P > .05), and no substantial difference was seen when comparing BM levels of engrafted HMC-1.2 cells in the 2 mouse groups (Figure 6D). In a linear prediction model, the slopes of the regression lines computed by relating the numbers of disseminated HMC-1.2 cells in the animals’ lungs and PB to the primary tumor weight showed significant differences when comparing the CD44-knockdown group with the control group (Figure 6E) (P < .05). In both organs, the slope of the regression line was “negative” for the CD44-knockdown group but “positive” for the control group (Figure 6E). Such a difference in the slope of the regression line could not be found in the BM (not shown). These data suggest that CD44 plays a role in redistribution and invasion of neoplastic MCs in extramedullary organs.
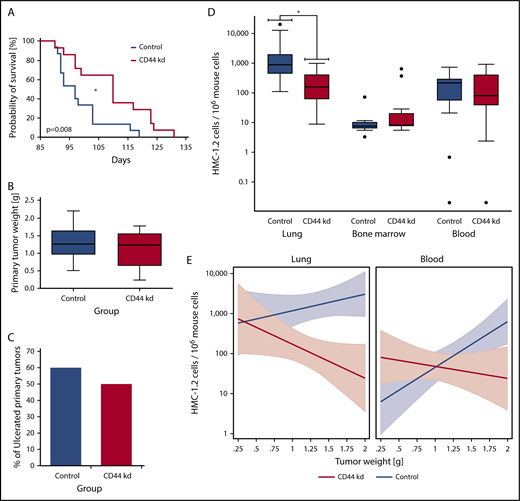
CD44 knockdown leads to prolonged OS as well as reduced metastasis formation in SCID mice. After lentiviral transduction with CD44 or control shRNA, HMC-1.2 cells were injected subcutaneously into 15 SCID mice per group. (A) Kaplan-Meier survival analysis for the CD44-knockdown (CD44 kd; red curve) and control (Co; blue curve) groups was performed. Median survival was significantly different between groups (CD44 knockdown, 110 days; control, 97 days; *P < .05, log-rank test). (B) Primary tumor weight in mice receiving HMC-1.2 CD44-knockdown cells (red box) compared with mice injected with control HMC-1.2 cells (Co; blue box) was slightly reduced (P > .05, Mann-Whitney U test). Results are shown as boxplots (Tukey) with median (black line), 25th to 75th percentile (boxes), and ranges without outliers (whiskers). (C) Bars represent the percentage of ulcerated primary tumors in mice receiving HMC-1.2 CD44-knockdown cells (red bar) compared with mice injected with control HMC-1.2 cells (Co; blue bar). CD44 knockdown did not significantly change the ulceration rate in these experiments (P > .05, Fisher exact test). (D) For control (blue boxes) and CD44-knockdown (red boxes) mice, the estimated numbers of observed MCs (human HMC-1.2 cells) per 106 murine cells, determined by human Alu-sequence–specific qPCR in lung, BM, and blood, are shown as logarithmic boxplots (Tukey) with median (black line), 25th to 75th percentile (boxes), ranges (whiskers), and outliers (black dots). As visible, metastatic lung infiltration by disseminated human HMC-1.2 cells transduced with CD44 shRNA was significantly lower compared with controls (CD44 knockdown: median, 142.6; mean ± SD, 238.0 ± 292.9; control: median, 877.5; mean ± SD, 3550 ± 5933). *P < .05 (Mann-Whitney U test). Median number of circulating CD44-depleted HMC-1.2 cells in the animals’ blood was slightly lower compared with control HMC-1.2 cells (CD44 knockdown: median, 81.6; mean ± SD, 224.4 ± 268.5; control: median, 215.1; mean ± SD, 216.1 ± 200.4) (P > .05, Mann-Whitney U test). A similar trend could not be observed in the BM. (E) In a linear prediction model, the numbers of observed disseminated MCs (human HMC-1.2 cells) per 106 murine cells in the lungs (left) and blood (right) in the CD44-knockdown (red curves) and control (blue curves) groups with 95% confidence intervals (colored areas) were related to the primary tumor weight. Interestingly, the slopes of the corresponding regression lines were significantly different (P < .05) when comparing the CD44-knockdown (red curves) and control (blue curves) groups.
CD44 knockdown leads to prolonged OS as well as reduced metastasis formation in SCID mice. After lentiviral transduction with CD44 or control shRNA, HMC-1.2 cells were injected subcutaneously into 15 SCID mice per group. (A) Kaplan-Meier survival analysis for the CD44-knockdown (CD44 kd; red curve) and control (Co; blue curve) groups was performed. Median survival was significantly different between groups (CD44 knockdown, 110 days; control, 97 days; *P < .05, log-rank test). (B) Primary tumor weight in mice receiving HMC-1.2 CD44-knockdown cells (red box) compared with mice injected with control HMC-1.2 cells (Co; blue box) was slightly reduced (P > .05, Mann-Whitney U test). Results are shown as boxplots (Tukey) with median (black line), 25th to 75th percentile (boxes), and ranges without outliers (whiskers). (C) Bars represent the percentage of ulcerated primary tumors in mice receiving HMC-1.2 CD44-knockdown cells (red bar) compared with mice injected with control HMC-1.2 cells (Co; blue bar). CD44 knockdown did not significantly change the ulceration rate in these experiments (P > .05, Fisher exact test). (D) For control (blue boxes) and CD44-knockdown (red boxes) mice, the estimated numbers of observed MCs (human HMC-1.2 cells) per 106 murine cells, determined by human Alu-sequence–specific qPCR in lung, BM, and blood, are shown as logarithmic boxplots (Tukey) with median (black line), 25th to 75th percentile (boxes), ranges (whiskers), and outliers (black dots). As visible, metastatic lung infiltration by disseminated human HMC-1.2 cells transduced with CD44 shRNA was significantly lower compared with controls (CD44 knockdown: median, 142.6; mean ± SD, 238.0 ± 292.9; control: median, 877.5; mean ± SD, 3550 ± 5933). *P < .05 (Mann-Whitney U test). Median number of circulating CD44-depleted HMC-1.2 cells in the animals’ blood was slightly lower compared with control HMC-1.2 cells (CD44 knockdown: median, 81.6; mean ± SD, 224.4 ± 268.5; control: median, 215.1; mean ± SD, 216.1 ± 200.4) (P > .05, Mann-Whitney U test). A similar trend could not be observed in the BM. (E) In a linear prediction model, the numbers of observed disseminated MCs (human HMC-1.2 cells) per 106 murine cells in the lungs (left) and blood (right) in the CD44-knockdown (red curves) and control (blue curves) groups with 95% confidence intervals (colored areas) were related to the primary tumor weight. Interestingly, the slopes of the corresponding regression lines were significantly different (P < .05) when comparing the CD44-knockdown (red curves) and control (blue curves) groups.
Impact of CD44 on survival of patients with mastocytosis
We also examined the prognostic impact of CD44. High CD44 expression on MCs, as determined by flow cytometry (SI ≥ 19; supplemental Figure 14), was found to correlate with poor overall survival (OS) (Figure 7A) and reduced event-free survival (EFS) (supplemental Figure 15A). Higher levels of CD44 on CD34+/CD38− SCs and CD34+/CD38+ PCs were also found to be associated with reduced OS (Figure 7B-C) and reduced EFS (supplemental Figure 15B-C). When determining the impact of CD44 exclusively in advanced SM patients, similar differences in OS and EFS were found by using the same cutoff values for CD44 expression on MCs, SCs, and PCs (supplemental Figure 16). Moreover, we found that higher sCD44 levels (≥200 ng/mL) in the sera of our mastocytosis patients are associated with reduced OS (Figure 7D) and EFS (supplemental Figure 15D) compared with patients with lower sCD44 (<200 ng/mL). In addition, higher sCD44 levels were found to be associated with a reduced probability of progression-free survival (PFS) (Figure 7E). Furthermore, high sCD44 levels (≥300 ng/mL) in the sera of advanced SM patients were associated with poor OS and EFS compared with those with lower sCD44 levels (<300 ng/mL) (supplemental Figure 17A-B). In patients with ISM, no such differences in OS and EFS were found (supplemental Figure 17C-D). In the Cox proportional hazards regression model, both sCD44 levels and World Health Organization classification were independent predictors of OS and EFS (P < .05) (supplemental Table 11).
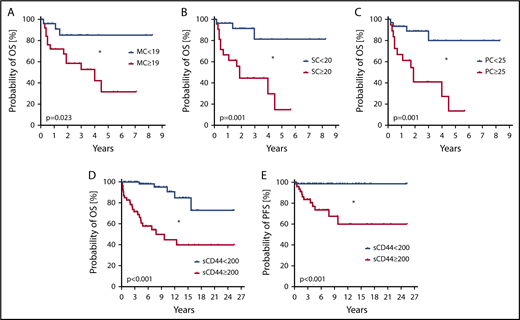
Prognostic impact of CD44 in patients with mastocytosis. (A-C) Probability of OS was determined for subgroups of patients with mastocytosis. Patients were split into subgroups based on higher (red curves) and lower expression (blue curves) levels of CD44 on CD117++/CD34− MCs (A), CD34+/CD38− SCs (B), and CD34+/CD38+ PCs (C). Cutoff values of SIs to define higher and lower CD44 surface expression levels based on receiver-operating characteristic curve analyses were 19 for MCs, 20 for SCs, and 25 for PCs. The analyzed patient cohort (n = 56) consisted of 2 patients with CM, 20 with ISM, 22 with SM-AHN, 6 with ASM, and 6 with MCL. The median follow-up of our patients was 2.8 years. The probability of OS was calculated by the product limit method of Kaplan and Meier. The differences in OS in the subgroups defined by higher or lower surface expression of CD44 were significant by log-rank test. *P < .05. (D-E) The probability of OS (D) and PFS (E) was determined in 129 patients with mastocytosis, consisting of 15 with CM, 74 with ISM, 7 with SSM, 20 with SM-AHN, 9 with ASM, and 4 with MCL. Based on receiver-operating characteristic curve analysis, patients were split into those with higher levels (≥200 ng/mL) of sCD44 (red curves) or lower levels of sCD44 (<200 ng/mL) (blue curves). The median follow-up of our patients was 6.6 years. The probability of OS and PFS was calculated by the product limit method of Kaplan and Meier. The differences in OS and PFS in the subgroups defined by higher or lower levels of sCD44 were significant by log-rank test. *P < .05.
Prognostic impact of CD44 in patients with mastocytosis. (A-C) Probability of OS was determined for subgroups of patients with mastocytosis. Patients were split into subgroups based on higher (red curves) and lower expression (blue curves) levels of CD44 on CD117++/CD34− MCs (A), CD34+/CD38− SCs (B), and CD34+/CD38+ PCs (C). Cutoff values of SIs to define higher and lower CD44 surface expression levels based on receiver-operating characteristic curve analyses were 19 for MCs, 20 for SCs, and 25 for PCs. The analyzed patient cohort (n = 56) consisted of 2 patients with CM, 20 with ISM, 22 with SM-AHN, 6 with ASM, and 6 with MCL. The median follow-up of our patients was 2.8 years. The probability of OS was calculated by the product limit method of Kaplan and Meier. The differences in OS in the subgroups defined by higher or lower surface expression of CD44 were significant by log-rank test. *P < .05. (D-E) The probability of OS (D) and PFS (E) was determined in 129 patients with mastocytosis, consisting of 15 with CM, 74 with ISM, 7 with SSM, 20 with SM-AHN, 9 with ASM, and 4 with MCL. Based on receiver-operating characteristic curve analysis, patients were split into those with higher levels (≥200 ng/mL) of sCD44 (red curves) or lower levels of sCD44 (<200 ng/mL) (blue curves). The median follow-up of our patients was 6.6 years. The probability of OS and PFS was calculated by the product limit method of Kaplan and Meier. The differences in OS and PFS in the subgroups defined by higher or lower levels of sCD44 were significant by log-rank test. *P < .05.
Discussion
We and others have previously shown that normal and neoplastic MCs display CD44.63-67,82,83 However, little is known about the regulation, function, and prognostic impact of CD44 in SM. We found that neoplastic MCs in SM display higher levels of CD44 than normal BM MCs. In addition, we found that CD34+/CD38− SCs and CD34+/CD38+ PCs in SM display CD44 and that the levels of CD44 correlate with the category of SM and disease aggressiveness. Our data also suggest that CD44 expression in neoplastic MCs is triggered by a signaling pathway involving RAS and STAT5 and that CD44 serves as an invasion receptor in advanced SM.
Expression of CD44 in neoplastic MCs was demonstrable by IHC, ICC, qPCR, and flow cytometry. MCs expressed cytoplasmic and cell-surface CD44 in all variants of SM and all patients examined. The MC lines tested (n = 8) also expressed CD44. Finally, we detected substantial amounts of sCD44 in the sera of our mastocytosis patients. While sCD44 levels were within normal range in patients with CM and ISM, elevated sCD44 levels were detected in advanced SM. These data suggest that neoplastic MCs not only synthesize and express CD44 but also release sCD44 into the circulation. In addition, high sCD44 levels were found to correlate with reduced OS in the total patient cohort as well as in the advanced SM group. In our flow cytometry experiments, higher levels of CD44 were detected on neoplastic MCs in patients with SM compared with controls, confirming our serological studies. Moreover, we found that higher levels of CD44 on MCs are indicative of reduced survival. These data suggest that overexpressed CD44 may serve as a new biomarker that contributes to grading and prognostication in mastocytosis. To further examine whether CD44 could serve as a biomarker in advanced SM, we analyzed surface CD44 expression and sCD44 levels before and during therapy with interventional drugs. We found that sCD44 levels and CD44 expression on MCs, SCs, and PCs increase during progression of SM. During therapy, sCD44 and surface CD44 decreased in responsive patients, whereas in those who relapsed or progressed despite therapy, CD44 levels increased.
Numerous studies have shown that leukemic clones are organized hierarchically and contain a small fraction of neoplastic SCs exhibiting self-renewing and long-term disease-propagating ability.84-87 Based on this concept, neoplastic SCs are regarded a primary target of curative anticancer therapies.85-89 In myeloid leukemias, neoplastic SCs often reside in a CD34+/CD38− cell fraction,84-87 and this seems to hold true also for SM.81,90 It is also well known that AML SCs display CD44.45-47 In this study, we found that CD34+/CD38− SCs in SM display CD44. In line with our previous data,81,90 these cells also coexpressed KIT and CD123, suggesting that these cells are probably of clonal origin. Both SCs and PCs, showed a homogeneous staining pattern without CD44-negative subpopulations in all SM patients tested. Together, these data suggest that neoplastic SCs and PCs in SM invariably display CD44, which would be in favor of treatment strategies employing CD44 as novel therapeutic target. On the other hand, CD44 was also detectable on normal SCs. However, the levels of CD44 on normal SCs were much lower than CD44 levels on SCs in advanced SM.
Another important aspect is that CD44 was also expressed on AML blasts and CMML monocytes in SM-AHN patients. In this regard, it is worth noting that CD44 is expressed in neoplastic cells in different hematologic neoplasms and even in nonhematologic malignancies.45-62 Moreover, it has been described that in other hematologic neoplasms, such as the myelodysplastic syndromes as well as in nonhematologic malignancies, such as oral squamous cell carcinoma, sCD44 levels correlate with survival.91-94 Furthermore, sCD44 is well-known as a biomarker for disease-monitoring in myelodysplastic syndromes and chronic lymphocytic leukemia.95-97
So far, little is known about the biochemical basis of CD44 expression in neoplastic MCs. We found that inhibitors directed against STAT5 or MEK counteract CD44 expression. We also found that WT K-RAS and oncogenic K-RAS G12V as well as WT STAT5 and oncogenic STAT5 S710F, when expressed in HMC-1.2 or ROSAKIT WT cells, enhance CD44 expression. These data suggest that CD44 expression in neoplastic MCs is triggered by a RAS-MEK and STAT5 pathway. However, other factors and pathways may also contribute to CD44 expression in neoplastic MCs. For example, exposure of MC lines to demethylating agents (decitabine, 5-azycytidine) or the BET inhibitor JQ1 was followed by upregulation of CD44, suggesting that epigenetic factors may also regulate CD44 expression.
CD44 is considered to play a role as a homing receptor for hematopoietic SCs and other lymphohematopoietic cells.45,46,50 However, so far, the functional role of CD44 on MCs and their progenitors remains unknown. Our data suggest that MCs can proliferate independent of CD44. In fact, an shRNA-induced knockdown of CD44 did not change proliferation in HMC-1.2 cells. However, the shRNA-induced CD44 knockdown in HMC-1.2 cells led to reduced metastasis formation and prolonged survival in a xenotransplantation mouse model. These data suggest that CD44 is a homing/invasion receptor that contributes to leukemic expansion of MCs in vivo in mice. Whether CD44 is a relevant invasion molecule in patients with advanced SM remains to be confirmed in forthcoming studies.
In summary, CD44 is a functionally relevant homing receptor in neoplastic MCs and their progenitors. In addition, CD44 levels correlate with the category of SM and prognosis. Since CD44 is expressed on neoplastic MCs as well as on their putative SCs in advanced SM, CD44 may be an interesting target of therapy.
The online version of this article contains a data supplement.
The publication costs of this article were defrayed in part by page charge payment. Therefore, and solely to indicate this fact, this article is hereby marked “advertisement” in accordance with 18 USC section 1734.
Acknowledgments
This study was supported by the German National Academic Foundation (Bonn, Germany), a Stem Cell Grant from the Medical University of Vienna, a research grant from the Fellinger Krebsforschung Foundation, and the Austrian Science Fund (FWF) (SFB grants F4701-B20 and F4704-B20).
Authorship
Contribution: N.M. established the study plan, performed immunostaining experiments, molecular analyses, drug incubation experiments, and ELISA studies, and drafted parts of the article; D.W., S.S., and U.S. performed mouse xenotransplantation experiments; G.E. performed molecular studies, staining experiments, and cell sorting experiments; M.J., A.R., W.R.S., P.B.S., and U.J. contributed patient samples and clinical data; D.B., G.S., and A.B. performed staining experiments, ELISA measurements, and qPCR; G.G. and G.H. performed transfection experiments and molecular studies; C.K. and L.M. contributed patient samples and performed histopathology and immunostaining experiments; J.Z. contributed to molecular studies and shRNA experiments; M.A., G.H., and P.V. contributed essential cell line models; N.M., S.S., and W.R.S. contributed statistical analyses; P.V. established the study design, supervised experiments, and wrote the manuscript; and all authors drafted and corrected parts of the manuscript and approved the final version of the final document.
Conflict-of-interest disclosure: M.J. received honoraria from Novartis and served in advisory boards organized by Novartis, Blueprint, and Deciphera. G.H. received honoraria and a research grant from Novartis. W.R.S. received honoraria from Novartis, Celgene, Teva, Jazz Pharmaceuticals, Ratiopharm, and Deciphera and a research grant from Meda Pharma. U.J. received honoraria and research funding from Novartis and Roche. J.Z. received institutional support from Boehringer-Ingelheim and is consultant and stockholder at Mirimus, Inc. M.A. received research grants from Blueprint and Deciphera, and received honoraria from Deciphera. A.R. served as a Consultant in a global Novartis trial examining the effects of midostaurin in advanced SM, received a research grant from Novartis and honoraria from Novartis and BMS, and served in advisory boards organized by Novartis, Blueprint, and Deciphera. P.V. received a research grant from Novartis, Blueprint, and Deciphera; received honoraria from Novartis, Celgene, Pfizer, and Deciphera; and served as a consultant in a Novartis trial examining the effects of midostaurin in advanced SM. The remaining authors declare no competing financial interests.
Correspondence: Peter Valent, Division of Hematology and Hemostaseology and Ludwig Boltzmann Cluster Oncology, Department of Internal Medicine I, Medical University of Vienna, Waehringer Guertel 18-20, A-1090 Vienna, Austria; e-mail: peter.valent@meduniwien.ac.at.
