

Key Points
RNA-seq analysis of CD34+ cells identifies novel aberrantly spliced genes and dysregulated pathways in splicing factor mutant MDS.
Aberrantly spliced isoforms predict MDS survival and implicate dysregulation of focal adhesion and exosomes as drivers of poor survival.

Abstract
SF3B1, SRSF2, and U2AF1 are the most frequently mutated splicing factor genes in the myelodysplastic syndromes (MDS). We have performed a comprehensive and systematic analysis to determine the effect of these commonly mutated splicing factors on pre-mRNA splicing in the bone marrow stem/progenitor cells and in the erythroid and myeloid precursors in splicing factor mutant MDS. Using RNA-seq, we determined the aberrantly spliced genes and dysregulated pathways in CD34+ cells of 84 patients with MDS. Splicing factor mutations result in different alterations in splicing and largely affect different genes, but these converge in common dysregulated pathways and cellular processes, focused on RNA splicing, protein synthesis, and mitochondrial dysfunction, suggesting common mechanisms of action in MDS. Many of these dysregulated pathways and cellular processes can be linked to the known disease pathophysiology associated with splicing factor mutations in MDS, whereas several others have not been previously associated with MDS, such as sirtuin signaling. We identified aberrantly spliced events associated with clinical variables, and isoforms that independently predict survival in MDS and implicate dysregulation of focal adhesion and extracellular exosomes as drivers of poor survival. Aberrantly spliced genes and dysregulated pathways were identified in the MDS-affected lineages in splicing factor mutant MDS. Functional studies demonstrated that knockdown of the mitosis regulators SEPT2 and AKAP8, aberrantly spliced target genes of SF3B1 and SRSF2 mutations, respectively, led to impaired erythroid cell growth and differentiation. This study illuminates the effect of the common spliceosome mutations on the MDS phenotype and provides novel insights into disease pathophysiology.
Medscape Continuing Medical Education online
![]()
In support of improving patient care, this activity has been planned and implemented by Medscape, LLC and the American Society of Hematology. Medscape, LLC is jointly accredited by the Accreditation Council for Continuing Medical Education (ACCME), the Accreditation Council for Pharmacy Education (ACPE), and the American Nurses Credentialing Center (ANCC), to provide continuing education for the healthcare team.
Medscape, LLC designates this Journal-based CME activity for a maximum of 1.00 AMA PRA Category 1 Credit(s)™. Physicians should claim only the credit commensurate with the extent of their participation in the activity.
All other clinicians completing this activity will be issued a certificate of participation. To participate in this journal CME activity: (1) review the learning objectives and author disclosures; (2) study the education content; (3) take the post-test with a 75% minimum passing score and complete the evaluation at http://www.medscape.org/journal/blood; and (4) view/print the certificate. For the CME questions, see page 1356.
Disclosures
CME questions author Laurie Barclay, freelance writer and reviewer, Medscape, LLC, owns stock, stock options, or bonds from Pfizer. Editor Nancy Berliner and the authors declare no competing financial interests.
Learning objectives
Upon completion of this activity, participants will be able to:
Describe the impact in splicing factor -mutant myelodysplastic syndromes of splicing factor 3B subunit 1 (SF3B1), serine/arginine-rich splicing factor 2 (SRSF2), and U2 small nuclear RNA auxiliary factor 1 (U2AF1) mutations on pre-mRNA splicing in purified bone marrow stem and progenitor cells, according to a comprehensive systematic analysis
Determine the associations between aberrantly spliced isoforms and clinical variables and patient survival, according to a comprehensive systematic analysis
Explain the functional impact of aberrant splicing of key target genes on erythroid cell growth and differentiation, according to a comprehensive systematic analysis
Release date: September 20, 2018; Expiration date: September 20, 2019
Introduction
The myelodysplastic syndromes (MDS) are myeloid malignancies arising from bone marrow (BM) hematopoietic stem cells (HSCs).1-5 The MDS are characterized by ineffective hematopoiesis resulting in peripheral blood cytopenias. Patients with MDS show increasing numbers of BM blasts over time, and 30% to 40% of cases progress to acute myeloid leukemia (AML).1-4
Splicing factor gene mutations occur in more than 50% of all patients with MDS, implicating spliceosome dysfunction as a key driver of disease pathophysiology.6 SF3B1, SRSF2, U2AF1, and ZRSR2 are the most frequently mutated splicing factor genes in MDS.7,8 These splicing factors are involved in recognition of 3′ splice sites during pre-mRNA splicing.9 SF3B1 stabilizes U2 snRNP binding to the branch point sequence,6,10 SRSF2 promotes exon recognition by binding mRNA exonic splicing enhancer motifs,6,11,12 whereas U2AF1 recognizes the AG dinucleotide at the 3′ splice sites.6,13 These mutated genes have different prognostic impacts and to some degree define distinct clinical phenotypes in MDS.8,14-17 SF3B1 mutations are strongly associated with the presence of ring sideroblasts.16,18
Splicing factor mutations are typically early events in MDS,19,20 and some are found in association with clonal hematopoiesis of indeterminate potential,21-23 suggesting that the presence of splicing factor mutations can result in clonal expansion in aging human BM. HSCs expressing splicing factor mutations show a compromised repopulation capacity in mice compared with wild-type HSCs, however,24-28 and precisely how splicing factor mutations confer a positive selection advantage in the BM remains a mystery.
Mouse models expressing splicing factor mutations show some features of MDS, including expansion of stem and progenitor cells in the BM and leukopenia.24,26-28 Although these models have significantly advanced our understanding of how splicing factor mutations lead to particular hematological phenotypes, the differences in intronic sequences and consensus-binding motifs between mice and humans mean that the splicing abnormalities observed in the mice often differ from those observed in patients.25,26
Aberrant RNA splicing occurs as a consequence of splicing factor gene mutations in several human malignancies.29-33 Some studies have investigated aberrant splicing in MDS and AML patients with splicing factor mutations,24,28,34-38 but included small numbers of splicing factor mutant (SFmut) cases and/or analyzed unfractionated BM or mononuclear cell samples.
Here, we performed a comprehensive and systematic analysis to determine the effect of SF3B1, SRSF2, and U2AF1 mutations on pre-mRNA splicing in purified BM stem and progenitor cells from a large cohort of patients with MDS. The major cellular processes and dysregulated pathways were identified in the CD34+ cells and in precursors of MDS-affected lineages of SFmut patients with MDS. We have determined the associations between aberrantly spliced isoforms and clinical variables and patient survival. Furthermore, we studied the functional effect of aberrant splicing of key target genes on erythroid cell growth and differentiation.
Materials and methods
Patients and samples
CD34+ cells were isolated from the BM samples of 84 patients with MDS (supplemental Table 1, available on the Blood Web site) and 8 healthy control individuals using MACS columns (Miltenyi Biotec, Germany). Of the 84 MDS cases, 28 were SF3B1 mutant (SF3B1mut), 8 SRSF2 mutant (SRSF2mut), 6 U2AF1 mutant (U2AF1mut), and 2 ZRSR2 mutant (with comutation of SRSF2), and 40 had no mutations in splicing factor genes (SFwt), as determined by targeted next-generation sequencing data8 (supplemental Table 1; supplemental Table 2; supplemental Figure 1A).
Granulocytic, monocytic, and erythroid precursors were purified from the BM samples of 11 patients with MDS (7 SF3B1mut and 4 SRSF2mut) and 5 healthy control individuals. Mononuclear cells were isolated from BM aspirates using density gradient centrifugation (Biocoll, Biochrom, Germany). After staining with CD34-APC (8G12), CD45-FITC (2D1), and CD14-PE (MφP9) (all from BD Biosciences, San Jose, CA), monocytes/macrophages restricted precursors (CD34−CD45+SSCmedCD14+), granulocytic precursors (CD34−CD45medSSChigh), and erythroid precursors (CD34−CD45−) were isolated by FACS using a FACSAria cell sorter and the FACSDIVA software (BD Biosciences). After sorting, morphology and purity of the isolated cell populations were determined and the purity was higher than 95%. Here, the mutational profile of the patients with MDS was determined using a next-generation sequencing-based myeloid gene panel20 (supplemental Table 3; supplemental Figure 1B).
The research was approved by the relevant institutional review boards or ethics committees, and all participants gave written informed consent.
RNA sequencing and data analysis
Total RNA was extracted using TRIzol (Thermo Scientific), with a linear acrylamide carrier, treated with DNase I (Life Technologies) and purified using Agencourt RNAClean XP beads (Beckman Coulter). RNA quality was assessed using a 2100 Bioanalyzer (Agilent), and RNA integrity numbers were greater than 8 for all samples. cDNA libraries were produced using a SMARTer library preparation protocol (Clontech). Sequencing was performed on an Illumina HiSeq4000 with 100-bp paired-end reads. The reads were mapped to human genome GRCh37 using HISAT2 version 2.0.0-beta.39 Uniquely mapped read pairs were counted using featureCounts,40 included with subread v1.5.0.41 Quality control was performed on the mapped files using Picard CollectRnaSeqMetrics (http://broadinstitute.github.io/picard; supplemental Data 1). Differential splicing was assessed using rMATS v3.2.2beta,34,42,43 with the BAM alignments generated by HISAT2. Aberrant splicing events associated with each mutated splicing factor were identified on the basis of the overlap between the lists of significant events identified by rMATS consistently in the comparisons of SFmut MDS both with SFwt MDS and with healthy control individuals (false discovery rate [FDR], <0.05 and inclusion level difference of >0.1 or <−0.1). The data discussed in this article have been deposited in the NCBI’s Gene Expression Omnibus (GEO) repository (GEO accession number: GSE114922).
Gene ontology (GO) analysis was performed on the genes showing significant aberrant splicing events (FDR <0.05), using goseq.44 A weighted bias correction based on the number of exons in each gene from Ensembl-GRCh37 was applied. Pathway analysis and upstream regulator analysis was performed on the genes showing significant aberrant splicing events (FDR <0.05) using Ingenuity Pathway Analysis (IPA) software (Qiagen).
Association of aberrant splicing with clinical variables
Clinical variables were analyzed for correlation with the rMATS-generated event inclusion levels for each MDS sample. Association between aberrant splicing events and clinical variables was determined using Spearman correlation for continuous variables (hemoglobin, white blood cell counts, absolute neutrophil count [ANC], platelet count [Plt], BM blasts, and age) and a Kruskal-Wallis test for categorical variables (sex, International Prognostic Scoring System, and transfusion dependence), with Bonferroni multiple hypothesis correction.
Functional studies
CD34+ cells from healthy donors (Lonza) were cultured in erythroid differentiation media for 14 days, as described previously.45 SEPT2 and AKAP8 genes were knocked down individually, using Mission shRNA lentiviral vectors (Sigma-Aldrich). Lentiviruses were produced and used to transduce CD34+ cells from healthy donors, as described previously.43
Additional method details are described in the supplemental Information.
Results
Aberrant pre-mRNA splicing in CD34+ cells of MDS cases with SF3B1, SRSF2, and U2AF1 mutations
To identify aberrantly spliced transcripts associated with SF3B1, SRSF2, and U2AF1 mutations in MDS hematopoietic stem and progenitor cells, we performed RNA-seq on CD34+ cells from 82 patients with MDS and 8 healthy control individuals. The rMATS bioinformatics pipeline34,42,43 was used to detect alternative (including cryptic) splicing events and categorize them as alternative 3′ splice site (A3SS) usage, alternative 5′ splice site (A5SS) usage, exon skipping (SE), mutually exclusive exons (MXE), or retained introns (RI).
SF3B1mut, SRSF2mut, or U2AF1mut patients were compared both with healthy control individuals and with SFwt patients, identifying more than 200 misregulated splicing events for each mutated splicing factor (Figure 1A-C; supplemental Data 2). SF3B1 mutations were associated with a higher proportion of A3SS and RI events, whereas SRSF2 mutations and U2AF1 mutations were associated with a higher proportion of SE and RI events (Figure 1D-F).
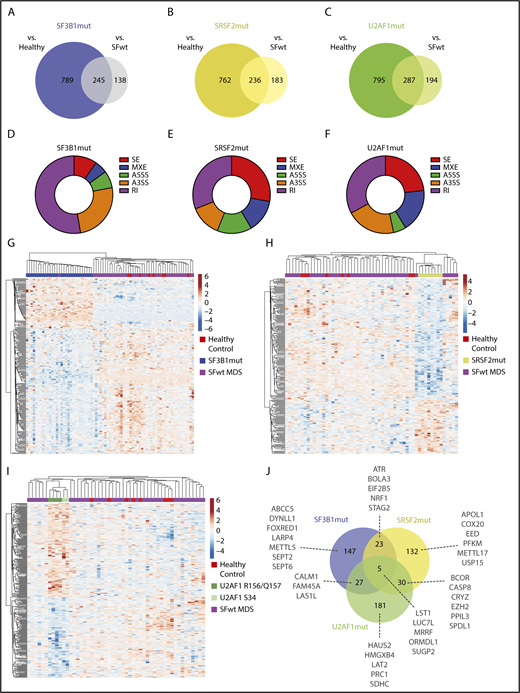
Aberrant splicing events in CD34+cells of patients with SFmut MDS. (A-C) Venn diagrams showing the aberrant splicing events identified in SF3B1 (A), SRSF2 (B), and U2AF1 (C) mutant MDS cases vs healthy control individuals and patients with SFwt MDS. (D-F) Doughnut charts showing the distribution of the aberrant splicing events identified in SF3B1 (D), SRSF2 (E), and U2AF1 (F) mutant MDS cases by event type. For each category, the number of significant aberrant splicing events was normalized to the total number of events identified by the rMATS pipeline. (G-I) Hierarchical clustering of SF3B1 (G), SRSF2 (H), and U2AF1 (I) mutant MDS samples, with wild-type MDS and healthy control samples using the rMATS-calculated inclusion levels of the 245, 236, and 287 aberrant splicing events identified.
Aberrant splicing events in CD34+cells of patients with SFmut MDS. (A-C) Venn diagrams showing the aberrant splicing events identified in SF3B1 (A), SRSF2 (B), and U2AF1 (C) mutant MDS cases vs healthy control individuals and patients with SFwt MDS. (D-F) Doughnut charts showing the distribution of the aberrant splicing events identified in SF3B1 (D), SRSF2 (E), and U2AF1 (F) mutant MDS cases by event type. For each category, the number of significant aberrant splicing events was normalized to the total number of events identified by the rMATS pipeline. (G-I) Hierarchical clustering of SF3B1 (G), SRSF2 (H), and U2AF1 (I) mutant MDS samples, with wild-type MDS and healthy control samples using the rMATS-calculated inclusion levels of the 245, 236, and 287 aberrant splicing events identified.
Hierarchical clustering performed using the aberrant splicing events identified for each mutated splicing factor showed that SF3B1mut cases clustered together and separately from SFwt cases and healthy control individuals (Figure 1G). Similarly, SRSF2mut cases clustered together (Figure 1H). Most U2AF1 mutations affect the S34 and R156/Q157 codons within the 2 zinc finger (ZF) domains.9 All U2AF1mut cases clustered together, with the S34 mutants and the R156/Q157 mutants in 2 subclusters (Figure 1I).
Among the top 40 aberrant splicing events in SF3B1mut MDS (supplemental Table 4), the largest proportion was A3SS (n = 21/40), followed by RI (n = 11/40). In contrast, among the highest-ranking aberrant splicing events in SRSF2mut (supplemental Table 4) and U2AF1mut MDS (supplemental Table 4), the largest proportion was SE (n = 31/40 and n = 27/40, respectively).
Mutations in splicing factor genes define distinct clinical phenotypes in MDS.6,14 We investigated the overlap of the aberrantly spliced genes identified in SF3B1mut, SRSF2mut, and U2AF1mut patients. The aberrant splicing events associated with each mutated splicing factor mainly affected different genes, although some overlap was observed (Figure 1J). A total of 147, 132, and 181 genes were aberrantly spliced distinctly in association with SF3B1mut, SRSF2mut, and U2AF1mut MDS cases, respectively (supplemental Data 3). These aberrantly spliced genes include SEPT2 and DYNLL1 in SF3B1mut cases, PKFM and METTL17 in SRSF2mut cases, and HMGXB4 and LAT2 in U2AF1mut cases. An aberrant splicing event (RI) in the caspase 1 (CASP1) gene, the key effector of pyroptosis,46 was observed in SF3B1mut MDS cases in our study. Five genes (LST1, LUC7L, MRRF, ORMDL1, SUGP2) were common to SF3B1mut, SRSF2mut, and U2AF1mut MDS. Some recurrently mutated genes in MDS were aberrantly spliced in SF3B1mut and SRSF2mut cases (ie, STAG247,48 ), or in SRSF2mut and U2AF1mut cases (ie, EZH249 and BCOR). We found increased inclusion of a “poison” cassette exon of EZH2 in SRSF2mut cases, as previously reported,24 and observed the same aberrant splicing event in U2AF1mut cases.
Significantly dysregulated gene expression was observed for 33 (16%) of the aberrantly spliced genes identified in SF3B1mut MDS cases, with a lower percentage observed for SRSF2mut-associated and U2AF1mut-associated aberrantly spliced genes (supplemental Data 3). We did not observe a difference in gene expression levels between nonsense-mediated mRNA decay (NMD)-sensitive and NMD-insensitive events associated with SRSF2 mutations and U2AF1 mutations (supplemental Figure 2A-B). These data are in agreement with other studies.24,35 For events associated with SF3B1 mutations, gene expression levels were overall lower for NMD-sensitive events (supplemental Figure 2C). Given the known function of SF3B1, we examined the aberrant A3SS events associated with SF3B1 mutation and found a more pronounced reduction of gene expression levels for NMD-sensitive events (median log2 fold −0.2 compared with median log2 fold −0.03 for NMD-insensitive events), although this did not reach statistical significance (supplemental Figure 2D).
GO analysis of aberrantly spliced genes in SFmut MDS
We performed GO analysis on the genes showing significant aberrant splicing events in SFmut MDS (supplemental Data 4). A marked convergence of significant GO themes was identified, with 74 GOs common to all SFmut MDS groups (Figure 2A; supplemental Data 5). We refined these overlapping GOs using REVIGO, which removes redundant GO terms and visualizes the most informative ontology themes. This analysis showed a strong cluster of GOs associated with mRNA metabolism, including RNA splicing, RNA processing, and mRNA translation (Figure 2A). Another strong GO cluster identified was associated with ribonucleoprotein complex biogenesis, which includes mitochondrial organization and translation. REVIGO treemap analysis of the 65 overlapping GO terms associated with SF3B1mut and SRSF2mut identified ontologies associated with ribonucleoprotein complex assembly, ligase activity (including regulation of mitotic cell cycle phase transition), and cellular response to DNA damage (supplemental Figure 3A). The REVIGO treemap of 118 GO terms associated only with SF3B1mut MDS showed multiple GO terms associated with cellular response to DNA damage stimulus and cell cycle processes (supplemental Figure 3B).
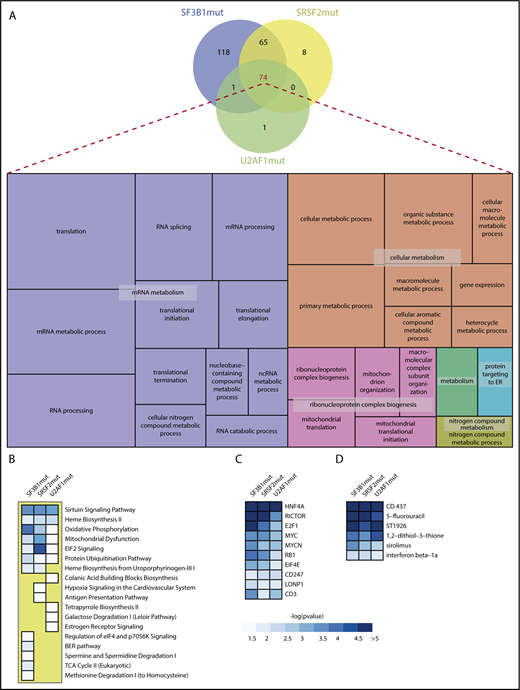
Gene ontology and Ingenuity pathway analysis of aberrantly spliced genes in SFmut MDS. (A) Venn diagram showing the overlap of significant GOs identified in SF3B1, SRSF2, and U2AF1 mutant MDS, and visualization of the significant BP GO terms common to all splicing factor mutant MDS using a REVIGO treemap. REVIGO panel sizes are inversely proportional to enrichment P values. (B-D) Ranked heat maps, as determined by collective significance across all splicing factor mutation groups, showing the significant dysregulated pathways (B), top 10 transcriptional regulators (C), and top 6 drug/chemical gene sets (D) in SF3B1, SRSF2, and U2AF1 mutant MDS. Only heat map tiles with a -log10pvalue > 1.3 (P value < .05) are shown. Within each heat map, dysregulated pathways, transcriptional regulators and drug/chemical names are ranked by the lowest P-value identified in the SFmut group.
Gene ontology and Ingenuity pathway analysis of aberrantly spliced genes in SFmut MDS. (A) Venn diagram showing the overlap of significant GOs identified in SF3B1, SRSF2, and U2AF1 mutant MDS, and visualization of the significant BP GO terms common to all splicing factor mutant MDS using a REVIGO treemap. REVIGO panel sizes are inversely proportional to enrichment P values. (B-D) Ranked heat maps, as determined by collective significance across all splicing factor mutation groups, showing the significant dysregulated pathways (B), top 10 transcriptional regulators (C), and top 6 drug/chemical gene sets (D) in SF3B1, SRSF2, and U2AF1 mutant MDS. Only heat map tiles with a -log10pvalue > 1.3 (P value < .05) are shown. Within each heat map, dysregulated pathways, transcriptional regulators and drug/chemical names are ranked by the lowest P-value identified in the SFmut group.
Pathway analysis of aberrantly spliced genes in SFmut MDS
Pathway analysis was performed using IPA on the genes showing significant aberrant splicing events in SFmut MDS (Figure 2B; supplemental Tables 5-7). Interestingly, all 3 mutated splicing factors shared 6 common significant biological pathways, with the sirtuin signaling pathway as the top ranking pathway (Figure 2B; supplemental Figure 4). Among the significant pathways uniquely dysregulated in one SFmut MDS group, the regulation of eIF4 and p70S6K signaling pathway (a key pathway for translational regulation) was dysregulated in SF3B1mut MDS (Figure 2B; supplemental Table 5), whereas hypoxia signaling was dysregulated in SRSF2mut MDS (Figure 2B; supplemental Table 6).
Next, using IPA, we performed an analysis of upstream transcriptional regulators (including transcription factors), aiming to evaluate the significance of the overlap between the significant aberrantly spliced genes associated with each mutant splicing factor and genes regulated by a transcriptional regulator. This analysis showed a significant overlap for all 3 mutated splicing factors with several transcriptional regulators, including HNF4A, RICTOR, E2F1, MYC, and RB1 (Figure 2C).
A similar approach identified drugs/chemicals that can affect the expression of the genes found to be aberrantly spliced in SFmut MDS. Two retinoid drugs (CD437 and ST1926), the nucleotide antagonist 5-fluorouracil, and the mTOR inhibitor sirolimus (rapamycin) were significant for all 3 mutated splicing factors (Figure 2D), indicating that a significant proportion of the target genes of these compounds are aberrantly spliced in SFmut MDS.
Aberrantly spliced genes involved in heme metabolism and iron processing in SFmut MDS
SF3B1mut, SRSF2mut, and U2AF1mut MDS cases showed significant dysregulation of the heme biosynthesis II pathway (Figure 2B). Given the striking phenotypic association between ring sideroblasts and SF3B1 mutation in MDS,16,18 we performed an extensive investigation of the influence of splicing factor mutations on heme metabolism or iron processing. Of 200 and 150 genes involved in heme metabolism or in iron homeostasis and transport (supplemental Methods), respectively, we found several showing aberrant splicing events in SF3B1mut, SRSF2mut, and U2AF1mut MDS cases, with a higher number of events occurring in SF3B1mut MDS cases (supplemental Data 6).
We have previously reported aberrant splicing of the iron transporter ABCB7 in MDS RARS,34 and here we have found the same aberrant splicing event in the ABCB7 mRNA (FDR=5.20 × 10⁻¹¹ in SF3B1mut MDS vs healthy control individuals and FDR=0 in SF3B1mut MDS vs SFwt MDS) and significant ABCB7 downregulation in SF3B1mut cases (adjusted P = 1.48 × 10⁻¹² and fold change = −2.4 in SF3B1mut MDS vs healthy control individuals, and adjusted P = 3.65 × 10⁻³¹ and fold change = −2.23 in SF3B1mut MDS vs SFwt MDS).
Aberrantly spliced genes involved in R-loop formation and DNA repair in SFmut MDS
Dysregulation of splicing factor genes has been associated with the formation of R-loops (structures resulting from the invasion of nascent RNA into DNA) and activation of the DNA damage response (DDR).50-52 Several significant GOs dysregulated in SFmut MDS in our study have been associated with increased R-loop formation, including mitochondrial dysfunction,53,54 aberrant RNA processing,52,55,56 and defective ribonucleoprotein particle biogenesis.57 Of 41 genes described in the literature as involved in suppression/regulation of R-loop formation and in the DDR,58-63 we found aberrant splicing of 4 genes (ERCC3, FANCI, SETX, and ATR) in SF3B1mut cases, 3 genes (CHEK1, SETX, and ATR) in SRSF2mut cases, and 2 genes (ERCC8 and FANCM) in U2AF1mut cases (supplemental Table 8).
Properties of dysregulated splice sites
We analyzed various properties of the major misregulated splicing events. SF3B1mut-misregulated A3SSs showed varying sequence profiles between canonical and cryptic sites (supplemental Figure 5A) and the characteristic 16 nt peak separation of upstream cryptic sites from their associated canonical sites (supplemental Figure 5B).34,64-66 Exons downregulated in association with U2AF1 mutations in the ZF1 and ZF2 domains (S34 and R156/Q157, respectively) showed altered 3′ splice site (3SS) logos (supplemental Figure 5C) consistent with contact by ZF1 and ZF2 at the −3 and +1 positions.35 SRSF2mut-misregulated exons showed no alterations in splice site compositions (supplemental Figure 5D), but consistent with previous observations,24 CCNG motifs were enriched in upregulated cassette exons and GGNG motifs in downregulated exons (supplemental Figure 5E).
Retained introns were the most common aberrant event in SF3B1mut cells, with the majority showing decreased retention (ie, increased splicing) in SF3B1mut MDS (supplemental Figure 6A). We observed that among the most affected RI events, a number used 3SSs that were also annotated as the upstream of a pair of A3SSs (supplemental Figure 6B-C). For example, ERCC3 showed reduced retention of intron 10 in conjunction with use of an A3SS 18 nt upstream of the canonical 3SS, with the change in intron retention exceeding the change in A3SS use (supplemental Figure 6B). DOM3Z showed reduced intron retention using an upstream A3SS, although in this case there was no observed switching in A3SS use (supplemental Figure 6C). This novel observation suggests that reduced intron retention might be linked to the ability of SF3B1 mutants to select an upstream A3SS.
Associations between aberrant splicing and clinical variables or patient survival in MDS
We investigated the correlations between aberrantly spliced events and clinical variables. Clinical variables showing a significant difference between SFmut and SFwt patients with MDS were lower percentage of BM blasts and higher number of white blood cells, ANC, and Plt in the SF3B1mut group (supplemental Table 9). Fifteen aberrant splicing events, all identified in SF3B1mut MDS, were significantly correlated with a clinical variable (BM blasts, Plt, or ANC) (Table 1; Figure 3A-D). These include RI events of AP1G2, DOM3Z, and ERCC3 with ANC, and a RI event of NICN1 with Plt, indicating increased aberrant splicing of these genes in MDS cases with higher ANC and higher platelets, respectively.
List of aberrant splicing events, identified in SF3B1mut MDS, significantly correlated with a clinical variable
| Event ID | Gene | Event type | Chr | Strand | Start position | End position | Spearman correlation variable | cor_estimate | P | adj.P |
|---|---|---|---|---|---|---|---|---|---|---|
| 6795 | PARVG | A3SS | 22 | + | 44582456 | 44583758 | BM blast % | 0.58 | 4.38E-07 | .003031 |
| 5420 | RPRD1A | RI | 18 | − | 33605560 | 33607038 | BM blast % | 0.58 | 6.21E-07 | .004292 |
| 3146 | DOM3Z | RI | 6 | − | 31938382 | 31938924 | ANC | −0.57 | 1.00E-06 | .006916 |
| 12280 | CXXC1 | SE | 18 | − | 47811694 | 47811721 | ANC | −0.56 | 1.28E-06 | .00888 |
| 3305 | AP1G2 | RI | 14 | − | 24031170 | 24031624 | ANC | −0.56 | 1.68E-06 | .011579 |
| 2362 | SNRPN | A3SS | 15 | + | 25219434 | 25219603 | ANC | −0.55 | 3.14E-06 | .021689 |
| 5460 | TCEA2 | A3SS | 20 | + | 62703210 | 62703294 | ANC | 0.54 | 3.24E-06 | .022393 |
| 6627 | NICN1 | A3SS | 3 | − | 49462381 | 49462579 | Plt | −0.54 | 3.80E-06 | .026281 |
| 6153 | ABCC5 | A3SS | 3 | − | 183703091 | 183703243 | ANC | −0.54 | 4.23E-06 | .029229 |
| 518 | ERCC3 | RI | 2 | − | 128046912 | 128047400 | ANC | −0.54 | 4.71E-06 | .032551 |
| 2359 | SNRPN | A3SS | 15 | + | 25219457 | 25219603 | ANC | −0.54 | 5.02E-06 | .03468 |
| 7563 | PPOX | A3SS | 1 | + | 161137128 | 161137276 | ANC | 0.53 | 5.99E-06 | .041411 |
| 4975 | GPR108 | A3SS | 19 | − | 6730997 | 6731122 | ANC | −0.53 | 6.43E-06 | .044443 |
| 5816 | PSTPIP1 | A3SS | 15 | + | 77328142 | 77328276 | ANC | −0.53 | 6.49E-06 | .044832 |
| 4728 | NICN1 | RI | 3 | − | 49462381 | 49462871 | Plt | −0.53 | 6.75E-06 | .046655 |
ANC, absolute neutrophil count; BM blast %, bone marrow blast percentage; Plt, platelet count.
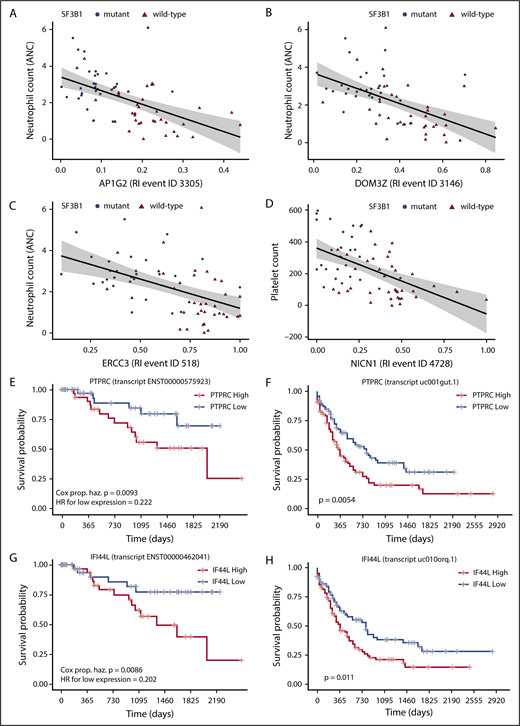
Associations between aberrant splicing and clinical variables or patient survival. (A-C) Scatterplots of aberrant splicing values in AP1G2 (A), DOM3Z (B), and ERCC3 (C) and neutrophil counts (ANC) in patients with MDS. (D) Scatterplot of aberrant splicing values in NICN1 and platelet counts in patients with MDS. (E-H) Kaplan-Meier survival plots for individual isoforms of PTPRC and IFI44L in our MDS cohort (E and G, respectively), and the Cancer Genome Atlas AML cohort (F and H, respectively).
Associations between aberrant splicing and clinical variables or patient survival. (A-C) Scatterplots of aberrant splicing values in AP1G2 (A), DOM3Z (B), and ERCC3 (C) and neutrophil counts (ANC) in patients with MDS. (D) Scatterplot of aberrant splicing values in NICN1 and platelet counts in patients with MDS. (E-H) Kaplan-Meier survival plots for individual isoforms of PTPRC and IFI44L in our MDS cohort (E and G, respectively), and the Cancer Genome Atlas AML cohort (F and H, respectively).
We investigated the association of expression of isoforms produced by aberrant splicing events identified earlier with patient survival. Isoforms arising from significantly differentially regulated splicing events between SFmut and both SFwt patients with MDS and healthy control individuals were identified. Multivariate Cox proportional hazard modeling of survival of patients stratified by median expression of individual isoforms identified 14 genes with isoforms that significantly predicted survival in MDS (Table 2; Figure 3E,G; supplemental Table 10; supplemental Figure 7). In all cases, the isoforms that predicted survival were ones that would be generated because of the aberrant splicing event identified. The affected isoforms showed striking enrichment (7/14) in genes involved in the formation of extracellular exosomes and focal cellular adhesion. Isoforms from the genes (CRTC2, CAP1, IFI44, IFI44L, CD46, FCGR2A, and PTPRC) from these pathways were investigated further using the AML data from the Cancer Genome Atlas. Patients were stratified by median expression of individual isoforms of the genes identified in the MDS cohort. Of the 7 extracellular exosome/focal adhesion genes identified as significant survival predictors in MDS, 5 genes (CAP1, IFI44, IFI44L, PTPRC, FCGR2A) also expressed isoforms that were significantly predictive of survival in the AML Cancer Genome Atlas cohort (Figure 3F,H).
Genes with isoforms that significantly predicted survival in MDS in multivariate models
| Gene | Associated splice factor mutation or mutations | Function/pathway | P (multivariate survival) |
|---|---|---|---|
| CAP1 | SRSF2 | Focal adhesion & extracellular exosomes | .0044 |
| PTPRC | U2AF1 (S34) | Focal adhesion & extracellular exosomes | .0093 |
| IFI44 | SRSF2, U2AF1 (S34) | Interferon, extracellular exosomes | .012 |
| IFI44L | U2AF1 (S34) | Interferon, extracellular exosomes | .0086 |
| CD46 | U2AF1 (S34) | Focal adhesion & extracellular exosomes | .039 |
| CRTC2 | SF3B1 | Extracellular exosomes | .035 |
| FCGR2A | U2AF1 (S34) | Extracellular exosomes | .016 |
| PPOX | SF3B1, U2AF1 (R156/Q157) | Heme biosynthesis | .031 |
| AHSA2 | SF3B1 | HSP90 ATPase | .029 |
| DHP5 | SF3B1 | Translation elongation factor 2 modification | .026 |
| MECR | U2AF1 (S34 & R156/Q157) | Mitochondrial reductase | .022 |
| NASP | U2AF1 (S34) | HSP90 binding | .014 |
| PFDN5 | U2AF1 (R156/Q157) | Prefoldin subunit | .042 |
| PABPC4 | U2AF1 (R156/Q157) | NMD mRNA decay | .036 |
Aberrant pre-mRNA splicing in CD34+ cells of MDS cases with ZRSR2 mutations
ZRSR2 is another recurrently mutated splicing factor gene in MDS.7,8 We performed RNA-seq on CD34+ cells from 2 MDS cases with ZRSR2 mutations to determine the aberrant splicing events in these samples. As these 2 ZRSR2 mutant cases also harbored a SRSF2 mutation, we compared them with SRSF2 mutant cases (without ZRSR2 mutations) and with healthy control individuals to identify the aberrant splicing events that can be attributed to the presence of the ZRSR2 mutations. Using rMATS, a total of 137 misregulated splicing events were identified, including 11 A3SS, 6 A5SS, 51 RI, 63 SE, and 6 MXE events (supplemental Figure 8A; supplemental Data 7). Pathway analysis performed on the genes showing significant aberrant splicing events showed dysregulation of pathways including sirtuin signaling and protein ubiquitination (supplemental Figure 8B; supplemental Table 11).
Aberrant splicing in BM cell populations of SFmut MDS
We performed RNA-seq on the granulocytic, monocytic, and erythroid precursors purified from BM of SF3B1mut and SRSF2mut patients with MDS and healthy control individuals (supplemental Table 3). Principal component analysis showed clustering of all samples by cell type (supplemental Figure 9).
rMATS analysis identified many unique aberrant splicing events in each cell population for SF3B1mut or SRSF2mut samples compared with healthy control individuals, with a limited overlap between cell populations (Figure 4A-B; supplemental Data 8). This suggests that SF3B1 and SRSF2 mutations affect splicing in a hematopoietic cell type-specific manner. Pathway analysis of the genes showing significant aberrant splicing events showed that 2 pathways involved in translation, EIF2 signaling and regulation of eIF4 and p70S6K signaling, were significantly dysregulated in all cell populations in both SF3B1mut and SRSF2mut MDS (Figure 4C,F). The analysis of upstream transcriptional regulators and drugs and chemicals is shown in Figure 4D-E,G-H for SF3B1mut and SRSF2mut MDS, respectively.
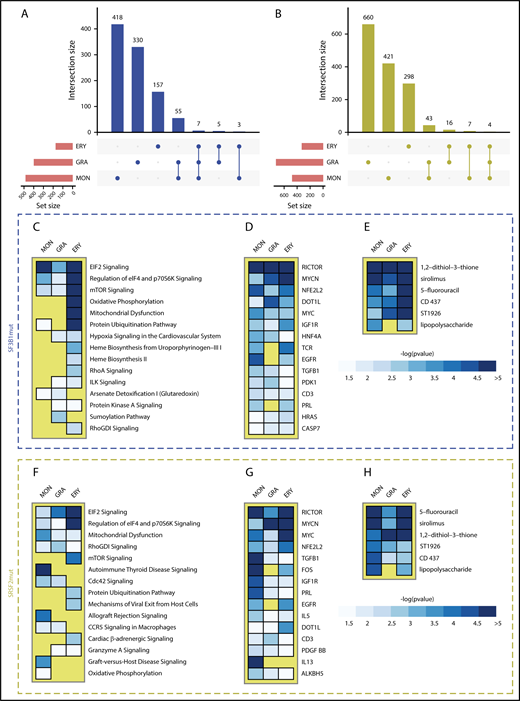
Aberrant splicing in BM cell populations of SFmut MDS. (A-B) UpSet plots showing the overlap of aberrant splicing events identified in monocyte (MON), granulocyte (GRA), and erythroid (ERY) precursor cell populations isolated from SF3B1 (A) and SRSF2 (B) mutant MDS patient samples. (C-H) Ranked heat maps showing the top 15 dysregulated pathways (C,F), top 15 transcriptional regulators (D,G), and top 6 drug/chemical gene sets (E,H) in MON, GRA, and ERY populations of SF3B1 mutant and SRSF2 mutant patients with MDS. Only heat map tiles with a -log10pvalue > 1.3 (P value < .05) are shown. Within each heat map, dysregulated pathways, transcriptional regulators and drug/chemical names are ranked by the IPA ranking score.
Aberrant splicing in BM cell populations of SFmut MDS. (A-B) UpSet plots showing the overlap of aberrant splicing events identified in monocyte (MON), granulocyte (GRA), and erythroid (ERY) precursor cell populations isolated from SF3B1 (A) and SRSF2 (B) mutant MDS patient samples. (C-H) Ranked heat maps showing the top 15 dysregulated pathways (C,F), top 15 transcriptional regulators (D,G), and top 6 drug/chemical gene sets (E,H) in MON, GRA, and ERY populations of SF3B1 mutant and SRSF2 mutant patients with MDS. Only heat map tiles with a -log10pvalue > 1.3 (P value < .05) are shown. Within each heat map, dysregulated pathways, transcriptional regulators and drug/chemical names are ranked by the IPA ranking score.
We analyzed panels of 120, 164, and 85 genes described in the literature as involved in erythroid,67 granulocyte68 and monocyte69 function (supplemental Data 9). Aberrantly spliced genes include GYPB and HMBS in the erythroid precursors of SF3B1mut and SRSF2mut MDS cases, and CSF1R and CSF3R, respectively, in the monocyte and granulocyte precursors of SRSF2mut cases.
We determined the overlap between the aberrant splicing events identified in the granulocytic, monocytic, and erythroid precursors of SF3B1mut and SRSF2mut patients with MDS, and the aberrant splicing events identified in the CD34+ cells of SF3B1mut and SRSF2mut patients with MDS. Many aberrant splicing events were common between CD34+ cells and 1 or more of the granulocytic, monocytic, and erythroid precursor populations for SF3B1 mutations or SRSF2 mutations (supplemental Figure 10). Three genes (SEPT2, DDX24, and DYNLL1) and 1 gene (RIMKLB) were aberrantly spliced in common to all 4 cell populations for SF3B1 mutations or SRSF2 mutations, respectively.
Functional effects of splicing aberrations associated with splicing factor mutations
We validated selected aberrant splicing events identified in SFmut MDS using RT-PCR (supplemental Figure 11A-J). Of these, the AKAP8 SE and SEPT2 A3SS events identified generate premature termination codons predicted to trigger NMD and were associated with significant downregulation in SRSF2mut and SF3B1mut MDS, respectively (supplemental Figure 11B,F). AKAP8 and SEPT2 play important roles in the regulation of mitosis and cell growth.70,71 Cell growth is dysregulated in MDS,1-4 and thus we selected AKAP8 and SEPT2 for functional studies.
Patients with MDS suffer from anemia.1 The effect of the splicing abnormalities of AKAP8 and SEPT2 on erythroid cell growth and differentiation was studied by knocking down these genes individually in human BM CD34+ cells subsequently differentiated toward the erythroid lineage. Erythroid cells with AKAP8 or SEPT2 knockdown showed significantly impaired growth and G1/S transition arrest compared with the scramble control (Figure 5A-C,H-J). Knockdown of these genes resulted in a significant decrease in the intermediate erythroid cell population (CD71+CD235a+ and CD36+CD235a+) on day 11 (Figure 5D-E,K-L) and the late erythroid cell population (CD71−CD235a+) on day 14 of culture (Figure 5F,M), and in a significant reduction in the number of BFU-E and CFU-E in colony-forming cell assays (Figure 5G,N), compared with the scramble control.
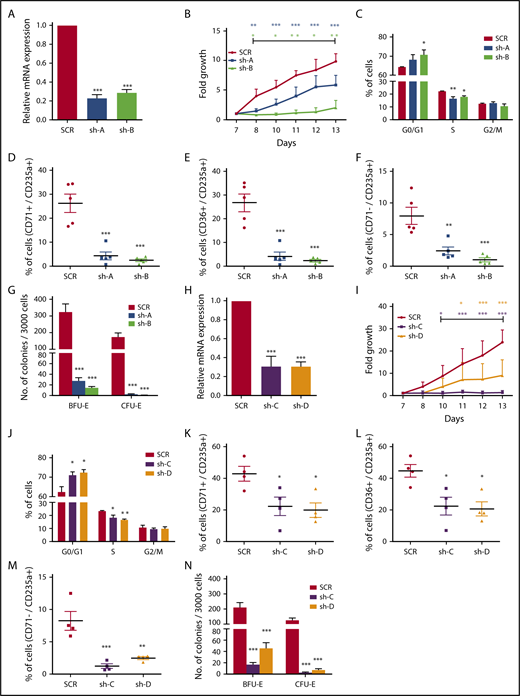
Functional effects of AKAP8 and SEPT2 knockdown on erythroid differentiation. (A,H) Real-time quantitative PCR showing the mRNA knockdown of AKAP8 (A) and SEPT2 (H) in erythroid cells. (B,I) Growth curves for erythroid cells with knockdown of AKAP8 (B) and SEPT2 (I). (C,J) Cell cycle analysis of erythroid cells with knockdown of AKAP8 (C) and SEPT2 (J) on day 11 of culture. (D-F and K-M) Flow cytometry quantification of erythroid differentiation. (D and K) Percentage of CD71+CD235a+ cells in erythroid cultures with knockdown of AKAP8 (D) and SEPT2 (K) on day 11. (E and L) Percentage of CD36+CD235a+ cells in erythroid cultures with knockdown of AKAP8 (E) and SEPT2 (L) on day 11. (F and M) Percentage of CD71−CD235a+ cells in erythroid cultures with knockdown AKAP8 (F) and SEPT2 (M) on day 14. (G and N) Number of BFU-E and CFU-E obtained from CD34+ progenitors with knockdown of AKAP8 (G) and SEPT2 (N) after 14 days in methylcellulose (colony-forming cell assays). Results shown in A-G were obtained from 5 independent experiments, except for C (3 replicates). Results shown in H-N were obtained from 4 independent experiments. Data represent the mean ± SEM. All P-values were obtained by 1-way ANOVA with Bonferroni’s posttest with the exception of G and N, in which 2-way ANOVA with Bonferroni’s posttest was used. *P < .05; **P < .01; ***P < .001.
Functional effects of AKAP8 and SEPT2 knockdown on erythroid differentiation. (A,H) Real-time quantitative PCR showing the mRNA knockdown of AKAP8 (A) and SEPT2 (H) in erythroid cells. (B,I) Growth curves for erythroid cells with knockdown of AKAP8 (B) and SEPT2 (I). (C,J) Cell cycle analysis of erythroid cells with knockdown of AKAP8 (C) and SEPT2 (J) on day 11 of culture. (D-F and K-M) Flow cytometry quantification of erythroid differentiation. (D and K) Percentage of CD71+CD235a+ cells in erythroid cultures with knockdown of AKAP8 (D) and SEPT2 (K) on day 11. (E and L) Percentage of CD36+CD235a+ cells in erythroid cultures with knockdown of AKAP8 (E) and SEPT2 (L) on day 11. (F and M) Percentage of CD71−CD235a+ cells in erythroid cultures with knockdown AKAP8 (F) and SEPT2 (M) on day 14. (G and N) Number of BFU-E and CFU-E obtained from CD34+ progenitors with knockdown of AKAP8 (G) and SEPT2 (N) after 14 days in methylcellulose (colony-forming cell assays). Results shown in A-G were obtained from 5 independent experiments, except for C (3 replicates). Results shown in H-N were obtained from 4 independent experiments. Data represent the mean ± SEM. All P-values were obtained by 1-way ANOVA with Bonferroni’s posttest with the exception of G and N, in which 2-way ANOVA with Bonferroni’s posttest was used. *P < .05; **P < .01; ***P < .001.
Discussion
The processes and pathways by which splicing factor mutations exert their effects are not established in the stem/progenitor cells and erythroid and myeloid precursors in MDS.
The analysis of a large dataset allowed us for the first time to compare and contrast the effects of different mutated splicing factor genes in MDS CD34+ cells. Many significant aberrant splicing events associated with SF3B1, SRSF2, and U2AF1 mutations were identified, including A3SS, RI, and SE. These events may alter isoform expression and affect protein levels and function: some A3SS can result in a frameshift leading to stop codon generation and gene downregulation via NMD; RI events can lead to NMD or to an increase in mRNA stability;72 and SE events result in alternative isoform generation, often not expected to alter gene expression levels.6,24,35,50,73 We present the first evidence of a common mechanistic pathway underlying retention of intron sequences and the use of A3SSs in cells harboring SF3B1 mutations. This event occurred, for example, in ERCC3, encoding the XPB component of TFIIH, which has roles as a transcription factor and in DNA repair. Loss of XPB activity contributes to R-loop-mediated DNA damage.62 Use of the upstream A3SS in the upregulated intron would insert 6 amino acids between the helicase and ResIII domains and may affect protein function.
The large majority of aberrantly spliced genes associated with each mutated splicing factor were different, although some overlap was observed. Aberrant splicing of 5 genes was observed in SF3B1mut, SRSF2mut, and U2AF1mut MDS, and thus represent common targets. Of these, LUC7L and SUGP2 encode proteins involved in splicing,74,75 with LUC7L associated with the U1 snRNP splicing complex involved in 5′ splice site selection.75 Dysregulation of the MRRF gene, involved in mitochondrial translational, leads to changes in mitochondrial morphology and function.76
Several biological processes were significantly affected in all 3 SFmut MDS groups, including RNA splicing, RNA processing, mRNA translation, and mitochondrial translation. Thus, splicing factor mutations affect cellular processes that are fundamental for the flow of information from the genome to proteins. Tightly controlled protein synthesis is critical for HSC (and progenitor) function and serves as a tumor suppressive mechanism,77 implicating the aberrant splicing of multiple translation-related genes in SFmut MDS in disease pathogenesis.
Several commonly dysregulated pathways were associated with all 3 mutated splicing factors, some of which are relevant to the known MDS pathophysiology, including mitochondrial dysfunction, oxidative phosphorylation, and heme biosynthesis, linking aberrant splicing with impaired mitochondrial function in MDS. Mitochondrial dysfunction is a well-recognized feature of MDS,78,79 and mice with mitochondrial dysfunction develop some MDS features including macrocytic anemia.80 The most significant dysregulated pathway across the 3 mutated splicing factors was sirtuin signaling, a pathway not previously associated with MDS. Sirtuins are histone deacetylases, some of which reside in the mitochondria,81 with diverse roles in regulating metabolism, inflammation, genome stability, and cell proliferation, and have been implicated in aging, cancer and survival.82,83
Dysregulation of splicing factors leads to R-loop formation with associated genomic instability, resulting in activation of the DDR.50-52 Elevated R-loops have been shown in Srsf2(P95H) mice,51 and SRSF2 is involved in maintaining genomic stability.51,52 Thus, R-loop formation and activation of the DDR are tightly linked cellular processes, and interestingly, regulators of these processes show aberrant splicing in our study. Biological processes associated with DDR and cell cycle regulation were significantly affected in both SF3B1mut and SRSF2mut MDS. SF3B1, SRSF2, and other splicing factors are components of a DNA damage-induced mRNA splicing complex,84 linking splicing factors to the DDR. Several genes regulated by this complex, including LIG1 and BRCC3,85,86 showed aberrant splicing in SFmut cases in our study. Several genes involved in the suppression/regulation of R-loop formation were aberrantly spliced in SFmut MDS in our study, including SETX and ATR.87-89 SETX resolves R-loops89 and its loss leads to aberrant R-loop accumulation.87 Aberrant splicing of R-loop-related genes may contribute to increased formation of R-loops in SFmut MDS. This might be expected to result in an increased mutation frequency and explain in part the clonal advantage of SFmut MDS HSCs.
Dysregulation of cell growth is a feature of MDS.1 We found that genes regulated by the transcriptional regulators HNF4A, RICTOR, E2F1, MYC, MYCN, and RB1, all major controllers of cell growth/cell cycle,90-93 showed significant enrichment for aberrantly spliced genes. HNF4A inhibition promotes tumorigenesis in solid cancers.94 Our data suggest for the first time a role of HNF4A in SFmut MDS disease pathophysiology.
Taken together, these data demonstrate that splicing factor mutations in MDS result in different mechanistic alterations in splicing and largely affect different genes, but these converge in overlapping (approximately one third of the total number) dysregulated pathways and cellular processes, suggesting common mechanisms of action. Many of the dysregulated pathways and cellular processes identified can be linked to the known disease pathophysiology and to the phenotypes associated with splicing factor mutations in MDS, whereas several have not previously been associated with MDS.
The association of aberrantly spliced isoforms with clinical parameters and with patient survival in MDS is an important aspect that has not been previously investigated. We identified several aberrant splicing events associated with clinical features for SF3B1mut MDS, demonstrating that specific splicing events may contribute directly to aspects of the disease phenotype. The first evidence that disparate splicing mutations in MDS may affect survival via effects on a common pathway involving focal adhesion and extracellular exosomes is presented here. We showed that the isoform changes that are induced in MDS significantly affect patient survival in multivariate models, and the same genes significantly affect survival in AML. Focal adhesion and extracellular exosomes play a role in cancer and leukemia,95,96 and our data implicate their dysregulation as drivers of poor survival in both MDS and AML.
The effect of splicing factor mutations remains largely unexplored in the different lineages affected in MDS,43 and we showed aberrant splicing of important genes for erythroid, granulocyte, and monocyte function in the respective cell population in SFmut MDS. For example, we have shown aberrant splicing of CSF3R, a critical regulator of granulopoiesis,97 in SRSF2mut granulocyte precursors, and of CSF1R, a controller of macrophage production and function,98 in SRSF2mut monocyte/macrophage precursors. Pathways playing critical roles in translational regulation were significantly dysregulated in all cell populations in both SF3B1mut and SRSF2mut MDS, suggesting that this process may be impaired in the erythroid and myeloid precursors of SFmut MDS.
To date, very few of the aberrantly spliced isoforms identified in SFmut malignancies have been functionally characterized.6 We identified aberrant splicing of the mitosis regulators SEPT299,100 and AKAP8,71 leading to their downregulation in the CD34+ cells of SF3B1mut and SRSF2mut MDS, respectively. Anemia is a hallmark of MDS,1 and we found that knockdown of SEPT2 or AKAP8 in human hematopoietic progenitors resulted in markedly impaired erythroid cell growth and differentiation. These results suggest that aberrant splicing of SEPT2 or AKAP8 may lead to impaired erythropoiesis in association with SF3B1 and SRSF2 mutations in MDS.
This comprehensive study provides novel insights into SFmut MDS disease pathophysiology, with newly identified clinical associations, and dysregulated genes and pathways representing potential new therapeutic targets.
The online version of this article contains a data supplement.
The publication costs of this article were defrayed in part by page charge payment. Therefore, and solely to indicate this fact, this article is hereby marked “advertisement” in accordance with 18 USC section 1734.
Acknowledgments
This study was funded by Bloodwise (UK) and in part by the European Union FP7 program “SyStemAge”. P.V. acknowledges funding from the Medical Research Council (MRC) Molecular Haematology Unit (MHU) Grant, MRC Disease Team Awards (G1000729/94931 and MR/L008963/1) and the Oxford Partnership Comprehensive Biomedical Research Centre (National Institute for Health Research [NIHR] Biomedical Research Centre [BRC] Funding scheme oxfbrc-2012-1 and 2017). L.M. acknowledges funding from Associazione Italiana per la Ricerca sul Cancro (AIRC, Investigator Grant 20125). M.C. acknowledges research grants from AIRC (Special Program Molecular Clinical Oncology 5 per Mille, project 1005) and from Fondazione Regionale Ricerca Biomedica (FRRB, project no. 2015-0042).
Authorship
Contribution: A.P., R.N.A., V.S., S. Singh, H.D., and S.R. performed experiments; A.P., A.R., P.H., A.G., P.V., S.K., L.M., M.L.H., A.-C.G., A.D.H., T.L., E.H.-L., M.C., and J. Boultwood provided essential patient samples and clinical data; A.P., R.N.A., V.S., E.S., E.R., A. Sanchi, J. Broxholme, H.L., S.T., A. Schuh, A.H., E.P., C.W.J.S., S. Smith, and J. Boultwood analyzed data; A.P., C.W.J.S., S. Smith, and J. Boultwood designed the research; A.P., R.N.A., V.S., S. Singh, C.W.J.S., S. Smith, and J. Boultwood wrote the paper; and all authors approved the manuscript and the submission.
Conflict-of-interest disclosure: The authors declare no competing financial interests.
Correspondence: Jacqueline Boultwood, Bloodwise Molecular Haematology Unit, Nuffield Division of Clinical Laboratory Sciences, Radcliffe Department of Medicine, University of Oxford, John Radcliffe Hospital, Oxford OX3 9DU, United Kingdom; e-mail: jacqueline.boultwood@ndcls.ox.ac.uk.

This feature is available to Subscribers Only
Sign In or Create an Account Close Modal