

Key Points
Mobilized hematopoietic stem cells transduced with IV injected HD-Ad5/35++ vectors home to the BM persist long term.
Our approach allows for the stable genetic modification of primitive, long-term persisting HSPCs.
Abstract
Current protocols for hematopoietic stem/progenitor cell (HSPC) gene therapy, involving the transplantation of ex vivo genetically modified HSPCs are complex and not without risk for the patient. We developed a new approach for in vivo HSPC transduction that does not require myeloablation and transplantation. It involves subcutaneous injections of granulocyte-colony-stimulating factor/AMD3100 to mobilize HSPCs from the bone marrow (BM) into the peripheral blood stream and the IV injection of an integrating, helper-dependent adenovirus (HD-Ad5/35++) vector system. These vectors target CD46, a receptor that is uniformly expressed on HSPCs. We demonstrated in human CD46 transgenic mice and immunodeficient mice with engrafted human CD34+ cells that HSPCs transduced in the periphery home back to the BM where they stably express the transgene. In hCD46 transgenic mice, we showed that our in vivo HSPC transduction approach allows for the stable transduction of primitive HSPCs. Twenty weeks after in vivo transduction, green fluorescent protein (GFP) marking in BM HSPCs (Lin−Sca1+Kit− cells) in most of the mice was in the range of 5% to 10%. The percentage of GFP-expressing primitive HSPCs capable of forming multilineage progenitor colonies (colony-forming units [CFUs]) increased from 4% of all CFUs at week 4 to 16% at week 12, indicating transduction and expansion of long-term surviving HSPCs. Our approach was well tolerated, did not result in significant transduction of nonhematopoietic tissues, and was not associated with genotoxicty. The ability to stably genetically modify HSPCs without the need of myeloablative conditioning is relevant for a broader clinical application of gene therapy.
Introduction
Hematopoietic stem/progenitor cells (HSPCs) are an important gene therapy target, as recent clinical trials have shown clear therapeutic benefits for otherwise incurable blood diseases.1 Current HSPC gene therapy protocols involve the transplantation of ex vivo lentivirus vector transduced HSPCs and are associated with a number of drawbacks. Ex vivo culturing of HSPCs in the presence of multiple cytokines can affect their multipotency and engraftment potential. Furthermore, most protocols involve myeloablation resulting in blood-cell depletion and susceptibility to infections and mucosal damage. Thus, the development of an in vivo HSPC transduction approach, circumventing conditioning and transplantation would be highly desirable.
Direct transduction of HSPCs localized in the bone marrow (BM) is inefficient because of physical barriers formed by the BM stroma. Mobilization, an enforced egress of HSPCs from the BM, can be achieved by a variety of approaches.2 A combination of granulocyte colony-stimulating factor (G-CSF) and the CXCR4 antagonists AMD3100 (Mozobil, Plerixa) has been shown to efficiently mobilize primitive progenitor cells in animal models and in humans.3 A problem for in vivo HSPC transduction is the low number of HSPCs in the BM. Only about 1 in 108 nucleated marrow cells are HSPCs4 ; the vast majority of cells in the BM are blood cell progenitor cells with different levels of lineage commitment. A long-term therapeutic effect of gene therapy requires that gene transfer vectors target these rare HSPCs.
CD46 complement regulatory protein is expressed on all human HSPCs.5 We identified CD46 as the high-affinity receptor for a number of adenoviruses (Ads), including serotype 11, 16, 21, 35, and 50.6 The receptor interacting moiety in the capsid of Ads is the C-terminal globular trimeric fiber domain, called the fiber knob. Both others and we have shown that Ad vectors containing the Ad35 fiber or fiber knob (Ad5/35) efficiently transduce human and non-human primate HSPCs in vitro.7-10
Materials and methods
Reagents
G-CSF/Filgrastim was from Amgen (Thousand Oaks, CA). AMD3100 was from Sigma (St. Louis, MO).
Ad vectors
The first-generation Ad5/35++-green fluorescent protein (GFP) vector,11 Ad5-GFP vector,8 and the Sleeping Beauty (SB) 100× transposase encoding helper-dependent adenovirus (HD-Ad)-SB vectors12 are described elsewhere. Generation of the transposon vector HD-Ad–GFP genome using a recombineering strategy13 is described in detail in the supplemental Methods (see “Adenovirus vectors”), available on the Blood Web site.
Cells
Human CD34+-enriched cells from G-CSF mobilized normal donors were obtained from the Fred Hutchinson Cancer Research Center Cell Processing Core Facility and cultured as described previously.8 Colony-forming unit (CFU) assays were performed using ColonyGEL (ReachBio, Seattle, WA) human or mouse complete medium according to the manufacturer’s specifications.
Tissue immunofluorescence analysis
Before tissue harvest, blood was flushed from the circulation with phosphate buffered saline using the heart as a pump. Tissues were frozen in optimal cutting temperature compound. Sections (6 μm) were fixed in 4% paraformaldehyde and either remained unstained or was stained with rat anti-mouse CD45 primary antibody (Ab) (BD Biosciences, Franklin Lakes, NJ). Specific binding of primary Abs was visualized with secondary anti-rat Alexa Fluor 488 Ab. After washing, the slides were mounted with Vectashield containing 4′,6-diamidino-2-phenylindole (DAPI) (Vector Laboratories, Inc., Burlingame, CA). Immunofluorescence microphotographs were taken at room temperature on a Leica DMLB microscope (40× oil lens) (Leica, Wetzlar, Germany) with a Leica DFC300FX digital camera and Leica Application Suite version 2.4.1 R1 (Leica Microsystems, Heerbrugg, Switzerland).
Integration site analysis
Genomic DNA was isolated from GFP+ hCD46tg colonies using the DNeasy Blood and Tissue Kit (Qiagen, Valencia, CA). These CFU colonies were obtained from Lin−/GFP+ BM cells of in vivo transduced hCD46tg animals. Amplification of SB genomic DNA junctions was performed by linear amplification-mediated polymerase chain reaction (PCR) as described previously14 and in detail in the supplemental Methods (see “Construction of integration site libraries”).
Mouse studies
hCD46-transgenic mice
C57Bl/6 based transgenic mice that contained the human CD46 genomic locus and provide CD46 expression at a level and in a pattern similar to humans were described earlier.15
Mobilization and in vivo transduction.
HSPCs were mobilized in mice by subcutaneous (SC) injections of human recombinant G-CSF (5 mg/d per mouse, 4 days), followed by an SC injection of AMD3100 (5 mg/kg) on day 5. In addition, animals received dexamethasone (10 mg/kg) intraperitoneally (IP) 16 hours and 2 hours before virus injection. Forty minutes after AMD3100, animals were IV injected with Ad vectors through the retro-orbital plexus with a total dose of 4 × 10¹⁰ viral particles (vp). In double injection settings, animals received up to 4 × 10¹⁰ vp twice at 30 minutes and 60 minutes after AMD3100 injection.
Secondary BM transplantation.
Recipients were female C57BL/6 mice, 6 to 8 weeks old. On the day of transplantation, recipient mice were irradiated with 1000 Rad. BM cells from in vivo transduced hCD46tg mice were isolated aseptically and GFP+ cells were isolated using fluorescence-activated cell sorting. Four hours after irradiation, GFP+ cells were IV injected through the tail vein at 1 × 10⁶ cells per mouse.
Generation of humanized non-obese diabetic/severe combined immunodeficiency/interleukin (IL)-2Rγnull (NOG) mice.
The immunodeficient NOG mice were obtained from The Jackson Laboratory (Bar Harbor, ME). NOG recipient mice received 300 Rad whole body irradiation; 2.5 × 10⁵ whole BM cells of non-irradiated NOG mice were mixed with 3 × 10⁵ human CD34+ cells and IV injected into recipient mice at 4 hours post-irradiation.
Results
Transient in vivo transduction of mobilized BM cells with a first-generation Ad5/35++ vector
Although CD46 is expressed on all nucleated cells in humans, the corresponding mouse ortholog is only expressed in the testes. For in vivo HSPC transduction studies, a transgenic mouse model (hCD46tg) expressing hCD46 in a pattern and at a level similar to humans was used.15 In hCD46tg mice, hCD46 is expressed at high levels in BM HSPCs (Figure 1A). This fraction is depleted for blood lineage cells (Lin−) and positive for c-Kit and Sca-1 (so called Lin−Sca1+Kit+ [LSK] cells).16 hCD46 expression was higher on LSK than on more differentiated Lin− and total mononuclear cells (MNCs). We employed G-CSF/AMD3100 to mobilize HSPCs from the BM of hCD46tg mice. Mobilization resulted in a ∼100-fold increase of LSK cells in peripheral blood at 40 minutes after AMD3100 injection as shown by flow cytometry (Figure 1B) and CFU progenitor assays (Figure 1C).

In vivo transduction of mobilized HSPCs with a first-generation Ad5/35++ vector after mobilization. (A) hCD46 expression on BM total MNCs, lineage-depleted BM cells (Lin−), and LSK cells from hCD46tg mice. Representative hCD46 flow cytometry analysis with MNC (solid black) and LSK cells (dashed black) (left). The gray curve represents MNCs stained with an isotype-matched control. hCD46 MFI on MNCs, Lin−, and LSK cells (right). N = 3. *P < .05, after one-way analysis of variance (ANOVA) with Tukey’s multiple comparison test. (B) Mobilization of LSK cells in hCD46tg mice by SC G-CSF injection for 4 days, followed by a single SC injection of AMD3100 on day 5. Forty minutes after the AMD3100 injection, PBMCs were harvested and analyzed by flow cytometry for LSK cells. Representative plots of nonmobilized and mobilized mice are shown. (C) Analysis of HSPC mobilization based on CFU formation. PBMCs were collected before onset of mobilization treatment, before injection of AMD3100, 40 minutes and 3 hours after the AMD3100 injection, as well as on days 3, 7, and 14 after mobilization. The collected cells were subjected to CFU assays and colonies were enumerated 12 days after plating. Shown are mean ± standard deviation (SD), colonies normalized to a blood volume of 100 μL. N = 3. (D) A total of 4 × 10¹⁰ vp of the first-generation Ad5/35++-GFP vector was IV injected 40 minutes after AMD3100. To alleviate release of pro-inflammatory cytokines associated with IV Ad vector injection, animals received dexamethasone (10 mg/kg) IP 16 hours and 2 hours before virus injection. Early transduction was analyzed by harvesting PBMCs, BM, and spleen cells at 2 hours after virus injection, and culturing them for 48 hours to allow for GFP expression. Shown is the percentage of GFP+ cells in the LSK cell fractions (analyzed by flow cytometry). N = 3. (E) Animals were mobilized and injected with Ad5/35++-GFP as before. Animals were euthanized and PBMCs collected at 2 hours and 6 hours after transduction. The cells were cultured for 48 hours to allow for GFP expression. Shown is the percentage of GFP+ LSK cells. In addition, GFP expression in peripheral blood LSK cells was analyzed at 3 days after transduction, without culturing of the cells. Unmobilized, untransduced animals were used as controls (mock). N = 3. (F) Animals were mobilized and injected with Ad5/35++-GFP as before. Transduction was analyzed by harvesting BM and splenic cells at day 3, 7, and 14 after Ad5/35++-GFP injection. Nonmobilized control animals were euthanized 2 days after infection. Shown is the percentage of GFP+ cells within total MNCs, and LSK cells in the BM and spleen. N = 3. Values represent means ± SD. *P < .05; **P < .01; ***P < .001; ****P < .0001, after unpaired Student t test comparing nonmobilized controls with animals euthanized 3 days after transduction. dpi, days postinfusion; Iso, isolated; MFI, mean fluorescence intensity; Mobil, mobilized; n.s., not significant.
In vivo transduction of mobilized HSPCs with a first-generation Ad5/35++ vector after mobilization. (A) hCD46 expression on BM total MNCs, lineage-depleted BM cells (Lin−), and LSK cells from hCD46tg mice. Representative hCD46 flow cytometry analysis with MNC (solid black) and LSK cells (dashed black) (left). The gray curve represents MNCs stained with an isotype-matched control. hCD46 MFI on MNCs, Lin−, and LSK cells (right). N = 3. *P < .05, after one-way analysis of variance (ANOVA) with Tukey’s multiple comparison test. (B) Mobilization of LSK cells in hCD46tg mice by SC G-CSF injection for 4 days, followed by a single SC injection of AMD3100 on day 5. Forty minutes after the AMD3100 injection, PBMCs were harvested and analyzed by flow cytometry for LSK cells. Representative plots of nonmobilized and mobilized mice are shown. (C) Analysis of HSPC mobilization based on CFU formation. PBMCs were collected before onset of mobilization treatment, before injection of AMD3100, 40 minutes and 3 hours after the AMD3100 injection, as well as on days 3, 7, and 14 after mobilization. The collected cells were subjected to CFU assays and colonies were enumerated 12 days after plating. Shown are mean ± standard deviation (SD), colonies normalized to a blood volume of 100 μL. N = 3. (D) A total of 4 × 10¹⁰ vp of the first-generation Ad5/35++-GFP vector was IV injected 40 minutes after AMD3100. To alleviate release of pro-inflammatory cytokines associated with IV Ad vector injection, animals received dexamethasone (10 mg/kg) IP 16 hours and 2 hours before virus injection. Early transduction was analyzed by harvesting PBMCs, BM, and spleen cells at 2 hours after virus injection, and culturing them for 48 hours to allow for GFP expression. Shown is the percentage of GFP+ cells in the LSK cell fractions (analyzed by flow cytometry). N = 3. (E) Animals were mobilized and injected with Ad5/35++-GFP as before. Animals were euthanized and PBMCs collected at 2 hours and 6 hours after transduction. The cells were cultured for 48 hours to allow for GFP expression. Shown is the percentage of GFP+ LSK cells. In addition, GFP expression in peripheral blood LSK cells was analyzed at 3 days after transduction, without culturing of the cells. Unmobilized, untransduced animals were used as controls (mock). N = 3. (F) Animals were mobilized and injected with Ad5/35++-GFP as before. Transduction was analyzed by harvesting BM and splenic cells at day 3, 7, and 14 after Ad5/35++-GFP injection. Nonmobilized control animals were euthanized 2 days after infection. Shown is the percentage of GFP+ cells within total MNCs, and LSK cells in the BM and spleen. N = 3. Values represent means ± SD. *P < .05; **P < .01; ***P < .001; ****P < .0001, after unpaired Student t test comparing nonmobilized controls with animals euthanized 3 days after transduction. dpi, days postinfusion; Iso, isolated; MFI, mean fluorescence intensity; Mobil, mobilized; n.s., not significant.
Initial transduction studies employed an affinity-enhanced first-generation Ad5/35 vector expressing GFP and carrying a modified Ad35 fiber knob with a 25-fold increased affinity to hCD46 (Ad5/35++-GFP).11 hCD46-tg mice were mobilized with G-CSF and AMD3100, and 40 minutes after AMD3100, Ad5/35++-GFP was IV injected. At 2 hours after transduction, 24% of peripheral blood LSK cells were GFP+, indicating efficient transduction of circulating mobilized HSPCs (Figure 1D). Direct transduction of BM and splenic LSK cells was inefficient with 0.7% and 2.7% GFP+ cells, respectively. Mobilized, transduced LSK cells left the periphery by day 3 after transduction (Figure 1E). At the same time, GFP+ LSK cells could be detected in the BM and spleen (Figure 1F). In the BM, 7.6% of LSK cells had been transduced, whereas only 0.3% of total MNCs were GFP+, showing preferential transduction of HSPCs. In the spleen, 13% of LSK cells and 1.2% of total MNCs expressed GFP, respectively. Without mobilization, 0.3% and 3.5% of LSK cells in the BM and spleen, respectively, were GFP+ at day 3. The percentage of GFP+ LSK cells in the BM decreased over time with 3.4% and 2.1% positive cells at days 7 and 14, respectively. A faster decline was observed in transduced splenic LSK cells. The loss of GFP+ cells over time could be due to: (1) differentiation of LSK cells; (2) vector cytotoxicity associated with leaky expression of viral genes from the first-generation Ad5/35++-GFP genomes17 ; (3) loss of episomal, non-integrated Ad vector genomes during cell division; and/or (4) competition by nontransduced HSPCs.
Stable in vivo transduction of HSPCs with integrating HD-Ad5/35++ vectors
To address the problem of first-generation vector-related cytotoxicity and to allow for chromosomal integration of the transgene, we used a hyperactive SB transposase (SB100×) system in the context of HD-Ad5/35++ vectors that lack all viral genes. The system consists of 2 vectors (Figure 2A). The transposon vector HD-Ad–GFP contains a GFP gene under the control of the EF1α promoter, a promoter that is active in HSPCs. The transgene cassette is flanked by inverted repeats, which are recognized by SB100× and frt sites for circularization of the transgene cassette through Flpe recombinase. The second vector, HD-Ad–SB, supplies Flpe and SB100× in trans to mediate integration of the GFP cassette into a thymine-adenine dinucleotide of the genomic DNA.18 Both vectors contain the affinity-enhanced Ad35++ fiber knob. In vitro studies with hCD46tg Lin− cells (supplemental Figure 1) and MO7e cells, a model cell line for human HSPCs (supplemental Figure 2), demonstrated efficient transgene integration through the SB100× vector system.

Stable in vivo HSPC transduction with integrating HD-Ad5/35++ vectors. (A) Vector genome structure. The transposon vector (HD-Ad–GFP (left) carries an Ef1α-driven GFP expression cassette that is flanked by inverted transposon repeats and frt sites. The second vector (HD-Ad–SB) (right) provides both Flpe recombinase and SB100× transposase in trans. Both are HD vectors containing the affinity-enhanced Ad35++ fiber knob. (B) Experimental design of the study demonstrating in vivo HSPC transduction with HD-Ad vectors. hCD46tg mice were mobilized and IV injected with HD-Ad–GFP (2 injections, each 2 × 10¹⁰ vp) or a 1:1 mixture of HD-Ad–GFP plus HD-Ad–SB (2 injections, each 4 × 10¹⁰ vp). Groups of mice were euthanized at 3 days, 4, 8, 12, and 20 weeks after injection, and BM cells, splenocytes, and PBMCs were harvested. GFP expression in total MNCs (for BM, spleen, and PBMC) and BM LSK cells was analyzed by flow cytometry. (C) Mobilized and nonmobilized hCD46tg animals were injected with HD-Ad–SB + HD-Ad–GFP. BM cells (left), splenocytes (middle), and PBMCs (right) were collected 3 days after transduction, and expression of GFP in different lineages as well as LSK cells and total MNCs were analyzed via flow cytometry. N = 5. *P < .05 after two-way ANOVA with Bonferroni posttesting.**P < .01; ***P < .001; ****P < .0001. (D) GFP expression in total BM (upper left), spleen (lower left), and peripheral blood MNCs (lower right), as well as BM LSK cells (upper right). Circles represent animals injected with HD-Ad–GFP only (N = 6). Squares represent animals injected with HD-Ad–GFP + HD-Ad–SB euthanized at 3 days (N = 5), 4 (N = 10), 8 (N = 10), 12 (N = 11), and 20 weeks (N = 5) after transduction. Each data point represents a single animal. **P < .01. (E) GFP marking in hematopoietic lineages of BM and spleen. Animals were euthanized 3 days as well as 8 and 20 weeks after transduction, and GFP expression in different lineages was analyzed via flow cytometry. Shown is the mean ± SD percentage of GFP+ cells in the indicated lineages. ****P < .0001. Some of the data, eg, the decrease in GFP+/CD19+ cells and the increase in GFP+/Gr-1+ cells in the BM between weeks 8 and 20 cannot be readily explained. ITR, inverted terminal repeats; PGK, phosphoglycerate kinase.
Stable in vivo HSPC transduction with integrating HD-Ad5/35++ vectors. (A) Vector genome structure. The transposon vector (HD-Ad–GFP (left) carries an Ef1α-driven GFP expression cassette that is flanked by inverted transposon repeats and frt sites. The second vector (HD-Ad–SB) (right) provides both Flpe recombinase and SB100× transposase in trans. Both are HD vectors containing the affinity-enhanced Ad35++ fiber knob. (B) Experimental design of the study demonstrating in vivo HSPC transduction with HD-Ad vectors. hCD46tg mice were mobilized and IV injected with HD-Ad–GFP (2 injections, each 2 × 10¹⁰ vp) or a 1:1 mixture of HD-Ad–GFP plus HD-Ad–SB (2 injections, each 4 × 10¹⁰ vp). Groups of mice were euthanized at 3 days, 4, 8, 12, and 20 weeks after injection, and BM cells, splenocytes, and PBMCs were harvested. GFP expression in total MNCs (for BM, spleen, and PBMC) and BM LSK cells was analyzed by flow cytometry. (C) Mobilized and nonmobilized hCD46tg animals were injected with HD-Ad–SB + HD-Ad–GFP. BM cells (left), splenocytes (middle), and PBMCs (right) were collected 3 days after transduction, and expression of GFP in different lineages as well as LSK cells and total MNCs were analyzed via flow cytometry. N = 5. *P < .05 after two-way ANOVA with Bonferroni posttesting.**P < .01; ***P < .001; ****P < .0001. (D) GFP expression in total BM (upper left), spleen (lower left), and peripheral blood MNCs (lower right), as well as BM LSK cells (upper right). Circles represent animals injected with HD-Ad–GFP only (N = 6). Squares represent animals injected with HD-Ad–GFP + HD-Ad–SB euthanized at 3 days (N = 5), 4 (N = 10), 8 (N = 10), 12 (N = 11), and 20 weeks (N = 5) after transduction. Each data point represents a single animal. **P < .01. (E) GFP marking in hematopoietic lineages of BM and spleen. Animals were euthanized 3 days as well as 8 and 20 weeks after transduction, and GFP expression in different lineages was analyzed via flow cytometry. Shown is the mean ± SD percentage of GFP+ cells in the indicated lineages. ****P < .0001. Some of the data, eg, the decrease in GFP+/CD19+ cells and the increase in GFP+/Gr-1+ cells in the BM between weeks 8 and 20 cannot be readily explained. ITR, inverted terminal repeats; PGK, phosphoglycerate kinase.
The two-vector system was then used for in vivo HSPC transduction in hCD46tg mice. First, we determined that doubling the vector dose (2 injections of each 4 × 10¹⁰ vp given 30 and 60 minutes after AMD3100) significantly increased the percentage of transduced LSK cells in peripheral blood (P < .05; supplemental Figure 3). This treatment regimen was used for all subsequent studies. For in vivo studies, mobilized animals received a combination of HD-Ad–SB and HD-Ad–GFP (Figure 2B). At 3 days after in vivo transduction, GFP expression in CD3+, CD19+, and Gr-1+ hematopoietic lineages and HSPCs was analyzed in the BM, spleen, and peripheral blood mononuclear cells (PBMCs) (Figure 2C). This analysis showed that: (1) our vectors not only transduce mobilized LSK cells but also differentiated cells; (2) mobilization significantly increased GFP marking of LSK cells in the BM and spleen; and (3) not only transduced mobilized LSK cells but also CD19+ cells appeared to return back to the BM after transduction in the periphery.
To evaluate stable long-term transgene expression after HSPC transduction, groups of mice were injected with both vectors, or HD-Ad–GFP alone and euthanized 4, 8, 12, and 20 weeks after transduction (Figure 2D). Total BM MNCs of animals injected with both vectors showed GFP in 2.5%, 1.1%, 0.4%, and 0.9% of cells at 4, 8, 12, and 20 weeks after transduction. The loss of transduced cells over time was most likely due to exit or turnover of short-term reconstituting HSPCs and differentiated cells.19 Animals that received HD-Ad–GFP alone showed a significantly lower transduction with 0.4% at 4 weeks after transduction (P < .001) and transduction levels remained low at later time points. Overall, higher transduction rates were observed for BM LSK cells, again suggesting preferential transduction of more primitive cells. Up to 7.7% (average = 2.45%) of all BM cells were GFP+ at week 4 after injection. The percentage of GFP+ cells declined over time during week 8 and 12, and increased again at week 20 to 5% to 10% of GFP+ LSK cells in most animals.
In the spleen of animals injected with both vectors, GFP was expressed in 11.8%, 17.6%, 5.7%, and 16.1% of cells at 4, 8, 12, and 20 weeks posttransduction, suggesting transient expansion of transduced cells or influx of modified, BM-derived cells.
In the blood, rapid loss of transgene expression could be observed in most animals, most likely due to anti-GFP immune responses, eliminating GFP-marked PBMCs, as supported by the occurrence of high serum titers of anti-GFP Abs and GFP-specific CD8 T cells in the spleen of mice that were euthanized at week 20 after in vivo transduction (supplemental Figure 4). Notably, stable transduction of splenocytes with the HD-Ad–GFP vector alone was also observed in some animals. Although this observation is consistent with a low frequency of integration of HD-Ad vectors through their inverted terminal repeats reported earlier,20 it requires further investigation.
Differentiation of transduced HSPCs into lineage-positive cells is supported by the analysis of GFP expression in CD3, CD19, and Gr-1+ cells present in the BM and spleen at day 3, week 8, and week 20 after transduction (Figure 2E). GFP marking of CD3 and CD19 cells in the BM was higher at week 8 than at day 3. In the spleen, increases in GFP marking over time were seen for CD19+ and Gr-1+ cells, suggesting an influx of modified cells derived from HSPCs in the BM, rather than initial transduction or expansion of the cells in the spleen. The fact that the CD19+ cells turnover is less than 4 weeks21,22 and that modified cells are detected at much later time points, support this hypothesis. Notably, changes in the levels of BM CD19+ and Gr-1+ cells were observed after in vivo transduction, independent of animals’ mobilization status. In the spleen and blood however, a clear influence of the mobilization on the lineage composition was observed (supplemental Figure 5).
To support these flow cytometric analyses, a functional HSPC assay were performed. First, the ability of GFP+ lineage-depleted BM cells harvested at week 4, 8, 12, and 20 after HD-Ad injection to form multilineage progenitor colonies (or CFUs) was analyzed (Figure 3A). The percentage of GFP+ CFUs increased during the first 12 weeks in treated animals, suggesting enrichment of transduced colony-forming cells and the loss of transduced less primitive cells (Figure 3B). At 12 weeks after transduction, 16.5% of colony-forming cells were stably modified. At week 20, markedly fewer colonies were formed with lower rates of gene modification, most likely due to the animals’ old age (∼8 months), which is associated with HSPC deterioration.23 Of 80 GFP-positive colonies screened, 30.9% were granulocyte, erythrocyte, monocyte, megakaryocyte CFU, 29.4% were granulocyte/macrophage progenitors CFU, 14.7% were granulocyte CFU, 13.2% were erythroid burst-forming unit, and 11.7% were erythroid CFU, suggesting that multipotent progenitors were efficiently transduced (Figure 3C and data not shown).

In vivo transduction of HSPCs with CFU potential. hCD46tg animals were mobilized and in vivo transduced with HD-Ad–GFP (n = 6 for 4 and 8 weeks, and n = 5 for 12 weeks after transduction) alone or with a combination of HD-Ad–GFP and HD-Ad–SB (n = 5 for 3 days, n = 10 for 4 weeks, n = 12 for 8 and 12 weeks, and n = 5 for 20 weeks post-transduction). Animals were euthanized 3 days, 4, 8, 12, or 20 weeks after transduction, BM cells were isolated, lineage depleted via MACS, and followed by the collection of GFP+ cells via fluorescence-activated cell sorting. Cells were then plated in CFU assays and colonies were scored 12 days after plating. (A) Experimental design. (B) Total colonies formed per 1000 plated Lin− cells (left) and percentage of GFP+ colonies among total CFUs (right). Shown are single animals as well as group means. (Open circles, HD-Ad-GFP; filled squares, HD-Ad-SB + HD-Ad-GFP.) Two-way ANOVA with Bonferroni posttesting for multiple comparisons = n.s. ***P < .001. (C) GFP expression in progenitor colonies. Examples for GFP+ erythroid burst-forming units, CFUs of erythroid progenitors (erythroid CFU), granulocyte progenitors, granulocyte/macrophage progenitors, and multipotential progenitor cells (granulocyte, erythrocyte, monocyte, and megakaryocyte CFUs) are shown. The scale bar is 500 μm. No specific feature within images shown in panel C was enhanced, obscured, moved, removed, or introduced. BFU-E, erythroid burst-forming unit; CFU-E, erythroid CFU; CFU-G, granulocyte CFU; CFU-GEMM, granulocyte, erythrocyte, monocyte, and megakaryocyte CFU; CFU-GM, granulocyte/macrophage CFU; MACS, magnetic-activated cell sorting; n.s., not significant.
In vivo transduction of HSPCs with CFU potential. hCD46tg animals were mobilized and in vivo transduced with HD-Ad–GFP (n = 6 for 4 and 8 weeks, and n = 5 for 12 weeks after transduction) alone or with a combination of HD-Ad–GFP and HD-Ad–SB (n = 5 for 3 days, n = 10 for 4 weeks, n = 12 for 8 and 12 weeks, and n = 5 for 20 weeks post-transduction). Animals were euthanized 3 days, 4, 8, 12, or 20 weeks after transduction, BM cells were isolated, lineage depleted via MACS, and followed by the collection of GFP+ cells via fluorescence-activated cell sorting. Cells were then plated in CFU assays and colonies were scored 12 days after plating. (A) Experimental design. (B) Total colonies formed per 1000 plated Lin− cells (left) and percentage of GFP+ colonies among total CFUs (right). Shown are single animals as well as group means. (Open circles, HD-Ad-GFP; filled squares, HD-Ad-SB + HD-Ad-GFP.) Two-way ANOVA with Bonferroni posttesting for multiple comparisons = n.s. ***P < .001. (C) GFP expression in progenitor colonies. Examples for GFP+ erythroid burst-forming units, CFUs of erythroid progenitors (erythroid CFU), granulocyte progenitors, granulocyte/macrophage progenitors, and multipotential progenitor cells (granulocyte, erythrocyte, monocyte, and megakaryocyte CFUs) are shown. The scale bar is 500 μm. No specific feature within images shown in panel C was enhanced, obscured, moved, removed, or introduced. BFU-E, erythroid burst-forming unit; CFU-E, erythroid CFU; CFU-G, granulocyte CFU; CFU-GEMM, granulocyte, erythrocyte, monocyte, and megakaryocyte CFU; CFU-GM, granulocyte/macrophage CFU; MACS, magnetic-activated cell sorting; n.s., not significant.
Additionally, BM of in vivo transduced hCD46tg animals was used to rescue lethally irradiated C57BL/6 recipients to assess the multilineage, long-term reconstitution potential of gene-modified HSPCs (Figure 4A). Successful engraftment, based on hCD46 expression in PBMCs, was achieved in 6 out of 7 animals (Figure 4B). GFP marking rates in PBMCs were on average 9% and remained stable (Figure 4C). At week 16, animals were euthanized and GFP marking was assessed in cells of the BM, spleen, lungs, and thymus, as well as in PBMCs. Analysis of BM showed GFP+ HSPCs (Lin−, LSK, and LSK SLAM) (Figure 4D). In the BM, GFP marking was seen in 5.9% of Lin− cells, in 8.6% of LSK cells, and in 4.6% of primitive LSK SLAM (LSK, CD150+, CD48−) cells. GFP marking was also detected in CD3, CD19, CD11b, and Gr-1+ cells of the BM, spleen, and blood (Figure 4E), as well as in leukocytes in the lung and thymus (Figure 4F). Furthermore, GFP marking was detected in microglia in the brain as well as in leukocytes found in the lumen of intestinal villi of the small intestine, both most likely derived from transduced HSPCs (supplemental Figure 6). We cannot explain why after transplantation of GFP-positive HSPCs, engraftment rates were over 90%, but GFP-positive cells were only about 9%. We hypothesize that this is due to either the presence of GFP+ cells without stable vector integration in the transplant or the development of anti-GFP immune responses in transplant recipients, leading to the killing of GFP-expressing PBMCs.
![Figure 4. Gene-modified HSPCs are capable of long-term, multilineage reconstitution of lethally irradiated recipients. (A) Experimental design. BM harvested from hCD46tg mice 8 weeks after in vivo transduction with HD-Ad–GFP and HD-Ad–SB was sorted for GFP+ cells. A total of 1 × 10⁶ GFP+ cells per recipient (pooled from different mice) were transplanted into lethally irradiated C57BL/6 mice. PBMCs were collected 4, 6, 8, 10, 12, and 14 weeks after transplantation, and analyzed for hCD46 and GFP expression by flow cytometry. N = 7. (B) Engraftment rate of transplanted cells based on hCD46 flow cytometry of PBMCs. Shown are single animals (filled squares) and the mean. (C) Percentage of GFP+ PBMCs analyzed at the indicated time points. (D) Week 16 GFP marking in BM lineage-depleted cells and cell fractions enriched for HSPCs (LSK, SLAM [LSK/CD150+/CD48−]). (E) Week 16 GFP marking in BM, PBMCs, and spleen lineage-committed cells (CD3, CD19, CD11b, and Gr-1). Shown are mean ± SD. One-way ANOVA with Bonferroni posttesting. (F) GFP expression in CD45+ cells of the lung and thymus. Shown are mean ± SD. n.s., not significant; SLAM, signaling lymphocyte activation molecules.](https://ash.silverchair-cdn.com/ash/content_public/journal/blood/128/18/10.1182_blood-2016-04-711580/6/m_2206f4.png?Expires=1767740811&Signature=4O1pDJhOBU~wglSiCa-wHtnsetFeaavxkKHNj8gi4~2WINGW6SVRTkSIbzVZIGEtVWq2uHoQwkm3~uAwYr9XJMB16cQc8qZ6I42pYSau4jjhw1XaIsFV~OKFoYF7M3sBoUaAmoqPvH-EBkoVSYIbl0N0UxJ6~E3bTlC09eocbYFcPMyVXd5mRtaQ5vQvr8NDkNVHLw4Vh4vo-Mxe6-3tIioh~loKzOQoU4Jhikg18AJ6NWTnTOkChkn5PCwqbBZoo7Zyak~zovCFGvvOlA0lKUROHwblN~hCkQiHKsNWcKxDIw4aoKNUnFvyGOnxwxT2HvxcEBsWqKiBsaOfHeE6yA__&Key-Pair-Id=APKAIE5G5CRDK6RD3PGA)
Gene-modified HSPCs are capable of long-term, multilineage reconstitution of lethally irradiated recipients. (A) Experimental design. BM harvested from hCD46tg mice 8 weeks after in vivo transduction with HD-Ad–GFP and HD-Ad–SB was sorted for GFP+ cells. A total of 1 × 10⁶ GFP+ cells per recipient (pooled from different mice) were transplanted into lethally irradiated C57BL/6 mice. PBMCs were collected 4, 6, 8, 10, 12, and 14 weeks after transplantation, and analyzed for hCD46 and GFP expression by flow cytometry. N = 7. (B) Engraftment rate of transplanted cells based on hCD46 flow cytometry of PBMCs. Shown are single animals (filled squares) and the mean. (C) Percentage of GFP+ PBMCs analyzed at the indicated time points. (D) Week 16 GFP marking in BM lineage-depleted cells and cell fractions enriched for HSPCs (LSK, SLAM [LSK/CD150+/CD48−]). (E) Week 16 GFP marking in BM, PBMCs, and spleen lineage-committed cells (CD3, CD19, CD11b, and Gr-1). Shown are mean ± SD. One-way ANOVA with Bonferroni posttesting. (F) GFP expression in CD45+ cells of the lung and thymus. Shown are mean ± SD. n.s., not significant; SLAM, signaling lymphocyte activation molecules.
Gene-modified HSPCs are capable of long-term, multilineage reconstitution of lethally irradiated recipients. (A) Experimental design. BM harvested from hCD46tg mice 8 weeks after in vivo transduction with HD-Ad–GFP and HD-Ad–SB was sorted for GFP+ cells. A total of 1 × 10⁶ GFP+ cells per recipient (pooled from different mice) were transplanted into lethally irradiated C57BL/6 mice. PBMCs were collected 4, 6, 8, 10, 12, and 14 weeks after transplantation, and analyzed for hCD46 and GFP expression by flow cytometry. N = 7. (B) Engraftment rate of transplanted cells based on hCD46 flow cytometry of PBMCs. Shown are single animals (filled squares) and the mean. (C) Percentage of GFP+ PBMCs analyzed at the indicated time points. (D) Week 16 GFP marking in BM lineage-depleted cells and cell fractions enriched for HSPCs (LSK, SLAM [LSK/CD150+/CD48−]). (E) Week 16 GFP marking in BM, PBMCs, and spleen lineage-committed cells (CD3, CD19, CD11b, and Gr-1). Shown are mean ± SD. One-way ANOVA with Bonferroni posttesting. (F) GFP expression in CD45+ cells of the lung and thymus. Shown are mean ± SD. n.s., not significant; SLAM, signaling lymphocyte activation molecules.
Taken together, the CFU and in vivo repopulation data suggest that our HD-Ad–SB + HD-Ad–GFP vector system can transduce and stably modify long-term reconstituting hematopoietic stem cells (HSCs), which then give rise to transgene-expressing progeny. Moreover, no abnormalities in blood cell counts/blood chemistry and tissue histology were found in transplant recipients, suggesting the absence of oncogenic or inflammatory events (supplemental Figure 7).
Safety of IV HD-Ad5/35++ vector injection
Although the IV injection of first-generation Ad5/35 vectors was shown to be safe in hCD46tg mice24 and baboons,25 the safety of IV injections of HD-Ad5/35++ vectors into mobilized animals had to be shown. The bio-distribution of HD-Ad–GFP was assessed by quantitative PCR and on tissue sections at 3 days after injection into mobilized animals. Vector genomes were detected in the lung, liver, heart, kidney, and spleen at levels between 5 and 20 genome copies per cell (Figure 5A).26-28 Vector DNA levels in the gastrointestinal tract and ovaries were 2 orders of magnitude lower. We speculate that the vector PCR signals in the lung, liver, kidney, and spleen reflect transduced leukocytes either as part of residual blood or as tissue infiltrates. This is supported by immunofluorescence studies on liver sections showing GFP expression in CD45+ leukocytes (Figure 5B, middle panel). To illustrate the absence of hepatocyte transduction by HD-Ad–GFP, we injected mobilized mice with a GFP-expressing Ad serotype 5 (Ad5-GFP). Three days later, the Ad5-GFP injection yielded ∼50% of GFP+ hepatocytes (Figure 5B, lower panel), whereas no hepatocyte transduction was observed with HD-Ad–GFP. In line with this, HD-Ad–GFP caused no liver toxicity (as reflected in alanine aminotransferase and aspartate aminotransferase levels) in contrast to the Ad5 vector (Figure 5C). Serum levels of cytokines IL-6, IL-10, tumor necrosis factor-α, IL-12p70, and interferon-γ were below the detection limit of the cytometric bead array used for detection (Figure 5D). Levels of the pro-inflammatory chemokine membrane cofactor protein-1 were elevated compared with untreated animals but still markedly lower than in other studies with Ad vectors,29 most likely due to dexamethasone administration before virus injection.30

HD-Ad5/35 vector genome distribution and inflammatory reaction in hCD46tg mice. (A) HD-Ad–GFP (4 × 10¹⁰ vp) was IV injected into mobilized hCD46tg mice. Animals received dexamethasone (10 mg/kg) IP 16 hours and 2 hours before virus injection. Three days later, genomic DNA from tissue samples was analyzed for HD-Ad vector genomes using quantitative PCR with GFP-specific primers. Shown are vector copies per cell. N = 3. (B) Immunofluorescence analysis of liver sections at day 3 after vector injection into mobilized mice. Mice received either HD-Ad–GFP or first-generation Ad5-GFP at a dose of 4 × 10¹⁰ vp per animal. GFP appears in green, murine CD45 in red, and DAPI-stained nuclei in blue. The arrows in the middle panel indicate transduced blood cells present in a liver blood vessel. The scale bar is 50 μm. No specific feature within images shown in panel B was enhanced, obscured, moved, removed, or introduced. Previously, we and others have shown that Ad5 entry into hepatocytes is mediated by Ad5 hexon protein interaction with coagulation FX26,27 and that this pathway is inefficient if Ad5 vectors contain the short Ad35 fibers (such as in the Ad5/35++ vectors used here), most likely due to a steric block of the FX-interacting domains within the Ad5 hexon.28 (C) Levels of serum alanine transaminase and aspartate transaminase at day 3 after Ad injection. N = 3. *P < .05, ****P < .0001 after one-way ANOVA with Bonferroni posttesting. (D) Serum levels of different cytokines, 6 hours after vector injection in mobilized animals. Animals had been mobilized as before and a total of 8 × 10¹⁰ vp HD-Ad–GFP was IV injected. Shown are mean ± SD. Dotted lines represent the detection limits of the different cytokines. Serum of unmobilized, uninjected animals was used as a control (untreated). N = 5. CTRL, control; FX, factor X; IFN, interferon; MCP, membrane cofactor protein; TNF, tumor necrosis factor.
HD-Ad5/35 vector genome distribution and inflammatory reaction in hCD46tg mice. (A) HD-Ad–GFP (4 × 10¹⁰ vp) was IV injected into mobilized hCD46tg mice. Animals received dexamethasone (10 mg/kg) IP 16 hours and 2 hours before virus injection. Three days later, genomic DNA from tissue samples was analyzed for HD-Ad vector genomes using quantitative PCR with GFP-specific primers. Shown are vector copies per cell. N = 3. (B) Immunofluorescence analysis of liver sections at day 3 after vector injection into mobilized mice. Mice received either HD-Ad–GFP or first-generation Ad5-GFP at a dose of 4 × 10¹⁰ vp per animal. GFP appears in green, murine CD45 in red, and DAPI-stained nuclei in blue. The arrows in the middle panel indicate transduced blood cells present in a liver blood vessel. The scale bar is 50 μm. No specific feature within images shown in panel B was enhanced, obscured, moved, removed, or introduced. Previously, we and others have shown that Ad5 entry into hepatocytes is mediated by Ad5 hexon protein interaction with coagulation FX26,27 and that this pathway is inefficient if Ad5 vectors contain the short Ad35 fibers (such as in the Ad5/35++ vectors used here), most likely due to a steric block of the FX-interacting domains within the Ad5 hexon.28 (C) Levels of serum alanine transaminase and aspartate transaminase at day 3 after Ad injection. N = 3. *P < .05, ****P < .0001 after one-way ANOVA with Bonferroni posttesting. (D) Serum levels of different cytokines, 6 hours after vector injection in mobilized animals. Animals had been mobilized as before and a total of 8 × 10¹⁰ vp HD-Ad–GFP was IV injected. Shown are mean ± SD. Dotted lines represent the detection limits of the different cytokines. Serum of unmobilized, uninjected animals was used as a control (untreated). N = 5. CTRL, control; FX, factor X; IFN, interferon; MCP, membrane cofactor protein; TNF, tumor necrosis factor.
The genotoxic potential of SB100×-mediated transgene integration after in vivo transduction was assessed in genomic DNA isolated from GFP+ progenitor colonies through genome-wide integration analysis using linear amplification method-PCR and next-generation sequencing. A total of 155 distinct SB100×-mediated integration sites were identified (Figures 6A-B). Integration into intergenic and intronic regions had occurred in 64% and 34% of events, respectively, whereas 1.3% of integrations were in exons (Figure 6C). No integration within or near a proto-oncogene was found (supplemental Figure 8A). The average distance to the closest cancer-related gene was 1689 kb. The level of randomness of integration was 72% without preferential integration in any given window of the whole mouse genome (supplemental Figure 8B). We have analyzed in more detail the potential integration “hotspot” on chromosome 13. None of the integrations in this region occurred within genes and near genes associated with cancer development.

Analysis of vector integration sites in HSPCs. Genomic DNA isolated from 20 pooled GFP+ progenitor colonies from BM cells of female hCD46tg animals, harvested 8 weeks after HD-Ad–GFP + HD-Ad–SB in vivo transduction and SB-mediated transgene integration sites were recovered. (A) Chromosomal distribution of integration sites in GFP+ CFU colonies. (B) Percentage of total integration events per chromosome. (C) Integration sites were mapped to the mouse genome, and their location with respect to genes was analyzed. Shown is the percentage of integration events that occurred outside of genes, within intronic regions, and within exons, respectively.
Analysis of vector integration sites in HSPCs. Genomic DNA isolated from 20 pooled GFP+ progenitor colonies from BM cells of female hCD46tg animals, harvested 8 weeks after HD-Ad–GFP + HD-Ad–SB in vivo transduction and SB-mediated transgene integration sites were recovered. (A) Chromosomal distribution of integration sites in GFP+ CFU colonies. (B) Percentage of total integration events per chromosome. (C) Integration sites were mapped to the mouse genome, and their location with respect to genes was analyzed. Shown is the percentage of integration events that occurred outside of genes, within intronic regions, and within exons, respectively.
In vivo HSPC transduction in humanized mice
The hCD46 levels in human CD34+ cells were slightly increased in the more primitive CD34+/CD38− subfraction (Figure 7A), However, in human PBMCs spiked with CD34+ cells, no differences in CD46 levels between CD34+ and CD34− cells were found (supplemental Figure 9). We first demonstrated, in vitro, in progenitor colony assays that the co-infection of human CD34+ cells with HD-Ad–SB and HD-Ad–GFP resulted in stable transduction, indicating that our vector system is functional in human HSPCs (supplemental Figure 10).
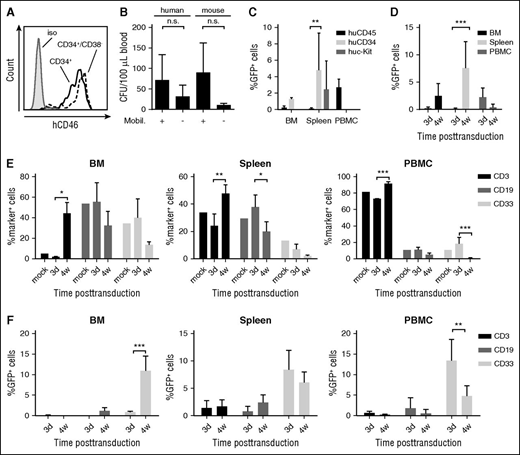
HSPC in vivo transduction in a humanized mouse model. (A) CD46 MFI on human CD34+ and CD34+/CD38− cells derived from umbilical cord blood MNCs. (B-D) In vivo studies in humanized mice. NOG mice received whole body irradiation and were transplanted with human CD34+ cells. Six weeks after transplantation, successful engraftment was confirmed by huCD45 flow cytometry of PBMCs. Animals were then mobilized and injected with HD-Ad–SB + HD-Ad–GFP. (B) Mobilization of human HSPCs. PBMCs were collected 90 minutes after AMD3100. PBMCs were plated in CFU assays in the presence of human or murine cytokines. Total CFU were enumerated 12 days after plating. N = 2. Differences between mobilized and nonmobilized animals were not statistically significant after unpaired Student t tests. (C) GFP expression in total human CD45+ cells and in HSPCs (CD34+ or c-Kit+ cells) in the BM, spleen, and PBMCs 3 days after HD-Ad–SB + HD-Ad–GFP injection into mobilized mice. N = 2. **P < .01 after one-way ANOVA with Bonferroni posttesting. (D) GFP expression in human (hCD45+) cells in the BM and spleen at day 3 (N = 4) and week 4 (N = 7) after in vivo transduction with HD-Ad–SB + HD-Ad–GFP. Values represent mean ± SD. ***P < .001 after one-way ANOVA with Bonferroni posttesting. (E-F) Lineage composition of hematopoietic tissues and transgene expression in hematopoietic lineages following HSPC in vivo transduction. Humanized NOG mice were mobilized and injected with HD-Ad–SB + HD-Ad–GFP as before. Animals were euthanized at 3 days (n = 2) or 4 weeks (n = 3) after transduction, and expression of GFP and lineage surface markers was assessed via flow cytometry. (E) Expression of hematopoietic lineage surface markers after HSPC in vivo transduction in the BM, spleen, and peripheral blood. An unmobilized, untreated, humanized NOG animal was used as control (mock). Shown are mean ± SD. (F) GFP expression in hematopoietic lineages at 3 days and 4 weeks after HSPC in vivo transduction. Shown are mean ± SD. *P < .05 following two-way ANOVA with Bonferroni posttesting. **P < .01; ***P < .001. iso, isolated; n.s., not significant; mobil, mobilized.
HSPC in vivo transduction in a humanized mouse model. (A) CD46 MFI on human CD34+ and CD34+/CD38− cells derived from umbilical cord blood MNCs. (B-D) In vivo studies in humanized mice. NOG mice received whole body irradiation and were transplanted with human CD34+ cells. Six weeks after transplantation, successful engraftment was confirmed by huCD45 flow cytometry of PBMCs. Animals were then mobilized and injected with HD-Ad–SB + HD-Ad–GFP. (B) Mobilization of human HSPCs. PBMCs were collected 90 minutes after AMD3100. PBMCs were plated in CFU assays in the presence of human or murine cytokines. Total CFU were enumerated 12 days after plating. N = 2. Differences between mobilized and nonmobilized animals were not statistically significant after unpaired Student t tests. (C) GFP expression in total human CD45+ cells and in HSPCs (CD34+ or c-Kit+ cells) in the BM, spleen, and PBMCs 3 days after HD-Ad–SB + HD-Ad–GFP injection into mobilized mice. N = 2. **P < .01 after one-way ANOVA with Bonferroni posttesting. (D) GFP expression in human (hCD45+) cells in the BM and spleen at day 3 (N = 4) and week 4 (N = 7) after in vivo transduction with HD-Ad–SB + HD-Ad–GFP. Values represent mean ± SD. ***P < .001 after one-way ANOVA with Bonferroni posttesting. (E-F) Lineage composition of hematopoietic tissues and transgene expression in hematopoietic lineages following HSPC in vivo transduction. Humanized NOG mice were mobilized and injected with HD-Ad–SB + HD-Ad–GFP as before. Animals were euthanized at 3 days (n = 2) or 4 weeks (n = 3) after transduction, and expression of GFP and lineage surface markers was assessed via flow cytometry. (E) Expression of hematopoietic lineage surface markers after HSPC in vivo transduction in the BM, spleen, and peripheral blood. An unmobilized, untreated, humanized NOG animal was used as control (mock). Shown are mean ± SD. (F) GFP expression in hematopoietic lineages at 3 days and 4 weeks after HSPC in vivo transduction. Shown are mean ± SD. *P < .05 following two-way ANOVA with Bonferroni posttesting. **P < .01; ***P < .001. iso, isolated; n.s., not significant; mobil, mobilized.
To establish humanized mice, we transplanted human CD34+ cells into sublethally irradiated, immunodeficient NOG mice. Average engraftment rates at 6 weeks after transplantation were 25% based on huCD45+ cells in the blood. Of note, all human cells express the HD-Ad5/35++ receptor hCD46. G-CSF/AMD3100 mobilization led a 2.3- and 8.2-fold increase in circulating human and murine CFU, respectively, showing inferior mobilization performance compared with our hCD46tg mouse model (Figure 7B). This is most likely due to abnormal BM structure and hematopoiesis observed in NOG mice.31 Three days after mobilization and HD-Ad–GFP + HD-Ad–SB injection, GFP expression was analyzed in the BM, spleen, and PBMCs in huCD45+ cells and in more primitive subfractions (CD34+ and c-Kit+) (Figure 7C). In the BM, ∼0.5% of huCD45+ cells were GFP+, whereas the GFP marking rate in the CD34+ cell fraction was approximately twofold higher. This was even more pronounced in the spleen, where 43.6- and 22.3-fold more GFP+/CD34+ and GFP+/c-Kit+ cells than GFP+/CD45+ cells were found, respectively. To assess stable transduction and expansion of transduced cells, GFP expression in huCD45+ cells was compared at day 3 and week 4 after in vivo transduction (Figure 7D). In the BM, 0.2% and 2.5% of huCD45+ cells were GFP+, 3 days and 4 weeks after transduction, whereas in the spleen GFP marking was 0.1% and 7.6%, respectively, showing expansion of transduced human HSPCs.
Mobilization resulted in a drastic increase in CD3+ cells particularly in the BM, and to a lesser degree in the spleen and blood (Figure 7E). This can in part be explained by the fact that the lymphoid compartment in NOG mice is mostly depleted, which provides space for expansion of existing lymphoid cells. Notably, GFP marking in CD3+ cells was very low (0.075%) at 3 days after transduction and decreased further by 4 weeks after transduction, possibly due to the strong expansion of CD3+ cells (Figure 7F). Importantly, GFP marking in myeloid CD33+ cells in the BM greatly increased (13-fold) between day 3 and week 4. Although at 3 days after transduction no GFP+/CD19+ cells were detected, 1.2% of CD19+ cells were GFP+ 4 weeks after transduction, strongly suggesting that HSPCs as well as myeloid and lymphoid progenitors had been transduced and differentiated, and expanded over time. Further studies over a longer time period are required to support this conclusion.
Discussion
Here, we demonstrate that we can stably genetically modify rare, primitive, long-term reconstituting HSPCs, a prerequisite for a long-term/life-long genetic cure of inherited and acquired diseases.4 At week 20, we detected GFP marking in 6.4% of BM LSK cells (Figure 2D), which corresponds to ∼0.05% of all total mononuclear BM cells. We did not find published data on lentivirus vector-mediated, long-term gene marking in BM HSCs in mice. In non-human primate and human studies with ex vivo lentivirus vector-transduced HSCs, it was estimated that one in 1 million transplanted HSCs were capable of long-term repopulation.32,33 In the human trials, this would correspond to 200 to 300 gene-corrected, long-term engrafting cells per 1.5 × 10¹² total MNCs in the human BM.4 The fact that our approach allows for the transduction of primitive HSPCs and that the percentage of these cells increases over time (Figure 3B), suggests that transduced HSPCs self-renew and give rise to GFP+ progeny cells that slowly overtake the BM.
Our new technology for in vivo HSPC transduction is based on a number of novel features, as shown in the sections to follow.
Mobilized HSPCs can be transduced with HD-Ad5/35++ vectors in the periphery, and home back to the BM and spleen
HSPCs in the BM cannot be efficiently transduced by IV injected gene transfer vectors, even if they express the targeted receptor. Limited accessibility of HSPCs and/or hCD46 due to BM stroma and inefficient virus extravasation from blood vessels could account for this. The rigidness of BM stroma and limited space in the BM also makes direct intra-osseous injection of gene transfer vectors or cells inefficient and difficult to control.34,35 Here, we show that G-SCF/AMD3100 mobilization can circumvent these problems and allow for the transduction of mobilized HSPCs (Figures 1F and 2C). Within 2 hours after IV vector injection, ∼25% of mobilized LSK cells were transduced. By day 3 after injection, no GFP+ LSK cells remained in the peripheral blood; concurrently GFP-expressing LSK cells appeared in the BM and spleen.
HD-Ad5/35++ vectors efficiently transduce primitive HSPCs
In the BM of both the hCD46tg and NOG/hCD34+ mice, transduction levels at day 3 were higher in HSPCs compared with total MNCs (Figures 1F, 2C, and 7C). In hCD46tg mice, this can be attributed to higher hCD46 levels on HSPCs (Figure 1A). Targeting of long-term surviving, multipotent HSPCs by HD-Ad5/35++ vectors is supported by CFU and in vivo repopulation assays (Figures 3C and 4). Compared with lentivirus and recombinant adeno-associated virus vectors, additional advantages of HD-Ad5/35++ vectors in HSPC gene therapy include: (1) the large transgene insert capacity (30 kb); (2) no requirement for cell cycling7 ; and (3) the relatively low manufacturing costs.
HD-Ad5/35++ vectors encoding SB transposase allow for transgene integration in HSPCs
A major advantage of the SB100× integration system is its independence of the cellular DNA repair and recombination machinery, the low activity of which in HSPCs (which are, per se, quiescent), limits other integration strategies involving nonhomologous end joining or homologous recombination.36 In contrast to lentiviral37 or adeno-associated virus vectors,38 SB100×-mediated integration is not biased toward insertion into or near genes,12 leading to a lower risk of genotoxic events. GFP marking rates with the HD-Ad5/35++-based SB100× system varied between individual animals. We excluded that these differences were due to inefficient HSPC mobilization in a subset of mice. The numbers of CFU in the blood 2 hours after AMD3100 were comparable between individual mice (data not shown). Furthermore, GFP marking analyzed at day 3 did not show dramatic differences between animals. A potential explanation for the variations in GFP marking in individual animals at week 8 and 20 could be related to the fact that true HSPCs are rare, and might not have been transduced in all animals. Also, the impact of anti-GFP immune responses on GFP marking in the BM could be considered.
IV injection of HD-Ad5/35++ vectors into mobilized hCD46tg mice was safe
Our studies in mobilized hCD46tg mice demonstrate that IV injection of HD-Ad5/35++ vectors was well tolerated. Ongoing studies in non-human primates corroborate this conclusion.
Innate acute toxicity is a major problem of systemic administration of Ad5-based vectors in animals and humans.39-41 Previous studies showed that release and expression of pro-inflammatory cytokines associated with vector uptake by the reticulo-endothelial system of the liver and spleen were markedly lower after IV injection of Ad5/35 vectors than after Ad5 vectors.24,25,42-44 Furthermore, in contrast to Ad5 vectors, our HD-Ad5/35++ vectors do not transduce hepatocytes after IV injection (Figure 5B), which is in agreement with previous Ad5/35 vector studies in hCD46tg mice and non-human primates.24,25,45,46 HD-Ad5/35++ vectors not only transduced mobilized HSPCs but also other differentiated peripheral blood and mobilized cells after IV injection (Figure 2C). However, because of the limited lifespan of differentiated blood cells, their genetic modification will not critically affect the safety of our approach. At day 3 after injection, vector genomes detected in tissues were mostly associated with transduced blood cells. Importantly, no GFP+ cells were found in germ line tissues, suggesting that low hCD46 levels and/or lack of accessibility of hCD46 to IV injected virus vector on nonhematopoietic tissues prevented their efficient transduction. A problem we encountered in our study was the development of anti-GFP immune responses that most likely resulted in the elimination of GFP-expressing PBMCs. Earlier studies involving the transplantation of retrovirus-transduced HSPCs also associated the loss of GFP marking in the periphery with anti-GFP T-cell responses.47-50 This problem can be addressed by immuno-modulation51 or -suppression47 approaches.
Our data provide a basis for future studies in animal disease models, aimed at assessing the therapeutic potential of our approach. The simplicity and cost-effectiveness of the technology is relevant for gene therapy of inherited or infectious diseases, and cancer.52,53
The online version of this article contains a data supplement.
The publication costs of this article were defrayed in part by page charge payment. Therefore, and solely to indicate this fact, this article is hereby marked “advertisement” in accordance with 18 USC section 1734.
Acknowledgments
The authors thank Pavel Sova for help with the integration site analysis; and Stanley Riddell and Ashwini Balakrishnan (Fred Hutchinson Cancer Research Center) for support in the T-cell assays.
The study was supported by grants from the National Institutes of Health, National Cancer Institute (R21 CA193077) and the National Heart, Lung, and Blood Institute (R01HL128288), a grant from the “Wings of Karen” Foundation, and a grant from the University of Washington CoMotion Innovation Fund (A.L.). M.R. was supported through a scholarship from the German Academic Exchange Service. J.L. was supported through a scholarship of the Chinese Scholarship Council. Z.I. was funded by European Research Council grant 2011-ADG-TRANSPOSOstress-294742. No specific feature within images shown in Figures 3C and 5B, and supplemental Figures 2C and 4 were enhanced, obscured, moved, removed, or introduced.
Authorship
Contribution: A.L. provided the conceptual framework for the study; M.R., T.P., Z.I., A.E., and P.N. designed the experiments; M.R., K.S., R.Y., R.K., J.L., E.-E.N., M.S., D.P., P.N., and K.G.H. performed the experiments; R.C. provided critical material; Z.I., W.U., P.N., A.E., T.P., and H.-P.K. provided comments; and M.R. and A.L. wrote the manuscript.
Conflict-of-interest disclosure: The authors declare no competing financial interests.
Correspondence: André Lieber, Department of Medicine, Division of Medical Genetics, University of Washington, Seattle, WA 98195; e-mail: lieber00@uw.edu.

This feature is available to Subscribers Only
Sign In or Create an Account Close Modal