

Key Points
Venetoclax demonstrates potent in vitro and in vivo single-agent activity in MLL-rearranged ALL xenografts.
Clinically efficacious BH3-mimetic therapy for other high-risk ALL subtypes is likely to require concurrent BCL-2 and BCL-XL inhibition.
Abstract
The clinical success of the BCL-2-selective BH3-mimetic venetoclax in patients with poor prognosis chronic lymphocytic leukemia (CLL) highlights the potential of targeting the BCL-2-regulated apoptotic pathway in previously untreatable lymphoid malignancies. By selectively inhibiting BCL-2, venetoclax circumvents the dose-limiting, BCL-XL-mediated thrombocytopenia of its less selective predecessor navitoclax, while enhancing efficacy in CLL. We have previously reported the potent sensitivity of many high-risk childhood acute lymphoblastic leukemia (ALL) xenografts to navitoclax. Given the superior tolerability of venetoclax, here we have investigated its efficacy in childhood ALL. We demonstrate that in contrast to the clear dependence of CLL on BCL-2 alone, effective antileukemic activity in the majority of ALL xenografts requires concurrent inhibition of both BCL-2 and BCL-XL. We identify BCL-XL expression as a key predictor of poor response to venetoclax and demonstrate that concurrent inhibition of both BCL-2 and BCL-XL results in synergistic killing in the majority of ALL xenografts. A notable exception is mixed lineage leukemia–rearranged infant ALL, where venetoclax largely recapitulates the activity of navitoclax, identifying this subgroup of patients as potential candidates for clinical trials of venetoclax in childhood ALL. Conversely, our findings provide a clear basis for progressing navitoclax into trials ahead of venetoclax in other subgroups.
Introduction
Acute lymphoblastic leukemia (ALL) is the most common childhood malignancy. Contemporary chemotherapeutic regimens confer an overall probability of cure approaching 90%.1 However, ALL has long been recognized to be biologically heterogeneous, with significant differences in treatment outcome between discrete patient subgroups, distinguishable through the integration of clinical (age, presenting white cell count, central nervous system involvement), leukemia-associated (genetic aberrations), and therapy-related (posttreatment minimal residual disease) parameters.2
The paradigm of risk-adapted therapy in childhood ALL is premised on the availability of effective curative treatment approaches for each patient subgroup. Although this approach has successfully ameliorated the prognostic impact of some previously adverse disease features such as t(1;19),3 other patient groups continue to have a markedly inferior outcome even with the most intensive current therapy, including hematopoietic stem cell transplantation. These include patients with low hypodiploid,4 Philadelphia-like (Ph-like),5 or infant mixed lineage leukemia-rearranged ALL (MLLr-ALL).6 Similarly, effective treatment options are lacking for many patients with relapsed childhood ALL, particularly early relapses with marrow involvement.7
BCL-2 family proteins regulate the intrinsic apoptotic pathway by integrating diverse prosurvival or proapoptotic intracellular signals.8 In healthy cells, proapoptotic BAX and BAK are kept in check by their prosurvival relatives (BCL-2, BCL-X, BCL-W, MCL-1, A1). Cellular stress signals, such as DNA damage–induced TP53 activation, trigger proapoptotic BH3-only proteins (such as BIM, PUMA)9 to neutralize the prosurvival BCL-2 proteins or directly activate BAX or BAK, thus initiating apoptosis.
The intrinsic apoptotic pathway mediates the cytotoxic activity of most chemotherapeutic agents. Mutations that compromise the integrity of this pathway, or upstream stress signaling (in particular, the dysregulation of TP53), have been recognized as major contributors to chemoresistance and treatment failure.10,11 In ALL, BCL-2 upregulation is associated with slow early response to therapy,12 although BCL-2 levels do not predict overall outcome.13,14 Clinical resistance to corticosteroids, an independent predictor of adverse outcome in ALL and feature of poor prognosis ALL subtypes including infant MLLr-ALL,15 is associated with reduced proapoptotic BIM induction and high MCL-1 expression.15-17 Conversely, a rapid early response is associated with upregulation of BIM.12 Notably, the cooccurrence of single-nucleotide polymorphisms resulting in BIM inactivation and increased prosurvival MCL-1 also predicts markedly inferior outcomes following contemporary ALL treatment.18
BH3-mimetics are novel therapeutic agents designed to circumvent the apoptotic dysregulation that confers resistance to standard chemotherapy, by directly targeting prosurvival BCL-2 proteins. Navitoclax (ABT-263), which binds BCL-2, BCL-XL, and BCL-W with nanomolar affinity,19 has potent activity in chronic lymphocytic leukemia (CLL), and in phase 1 trials induced objective responses in 30% of heavily pretreated patients.20 Dose escalation was curtailed by on-target thrombocytopenia due to BCL-XL inhibition.20,21 The discovery that BCL-2 inhibition accounts for the cytotoxic activity of navitoclax in CLL spawned development of the BCL-2-selective BH3-mimetic venetoclax (ABT-199).22 Without the thrombocytopenia that limited navitoclax dosing, substantially higher venetoclax exposures have been achievable, resulting in objective response rates of ∼80% in phase 1/2 CLL trials.23,24
Preclinical studies in childhood ALL xenografts with navitoclax, and its preclinical predecessor ABT-737 (which has identical BH3-mimetic properties),25 have demonstrated potent single-agent activity as well as synergistic cytotoxicity in combination with standard chemotherapy.26-28 Although ALL blasts generally express significantly higher levels of BCL-2 compared with normal lymphoid precursors,29,30 they also express significant levels of BCL-XL, in contrast to CLL, where BCL-XL is dominated by BCL-2.31 We have undertaken detailed studies exploiting a BH3-mimetic toolkit, to determine whether selective inhibition of BCL-2 is potentially an effective strategy for treating childhood ALL, given the superior tolerability of venetoclax compared with navitoclax, or conversely, if inhibition of BCL-XL contributes significantly to the observed efficacy of navitoclax in high-risk childhood ALL xenografts.
Materials and methods
Xenografts and in vivo drug treatments
All experimental studies were conducted with approval from the Animal Care and Ethics Committee of the UNSW (Sydney, Australia). Procedures for establishing continuous xenografts from childhood ALL biopsies in immune-deficient NOD/SCID (NOD.CB17-Prkdcscid/SzJ) or NOD/SCID, IL-2 receptor γ−negative (NOD.Cg-Prkdcscid Il2rgtm1Wjl/SzJ, NSG) mice are described elsewhere.32 All xenografts used in this study have been previously described and were used at between the third and fifth passage.27,33 Their clinical features are summarized in supplemental Table 1, available on the Blood Web site. Venetoclax (obtained from AbbVie) was administered orally at a dose of 100 mg/kg/d for 21 days.
Leukemia engraftment and progression were assessed in groups of 6-10 female mice, each weighing 20 to 25 g, by weekly enumeration of the human CD45+ cells in proportion to peripheral blood (%huCD45+).32 Individual mouse event-free survival (EFS) was calculated as number of days from treatment initiation until %huCD45+ reached 25%, computed by interpolating between bleeds directly preceding and following events, assuming log-linear growth. Efficacy of drug treatment was evaluated by leukemia growth delay (calculated as T − C, the difference between median EFS of vehicle control [C] and drug-treated [T] cohorts), and an objective response measure (ORM), as described previously (detailed description in supplemental Methods and supplemental Table 2).34
Immunoblotting, RNA extraction, and gene expression analysis
Preparation of xenograft lysates, protein analysis by immunoblotting, and RNA extraction, purification, and gene expression analysis have been previously described elsewhere27,31,35,36 Gene expression datasets can be accessed at www.ncbi.nlm.nih.gov/geo (accession number GSE52991). Benjamini and Hochberg’s false discovery rate37 measurement and Smyth’s unadjusted P value38 were used for evaluation of differential gene expressions. Gene expression heatmaps were generated using GenePattern.
In vitro cytotoxicity assays (AlamarBlue)
Xenografts were thawed and resuspended in Quality Biological Serum Free-60 (Quality Biological) supplemented with Flt3-ligand (20 ng/mL), penicillin (100 U/mL), streptomycin (100 µg/mL), and l-glutamine (2 mmol/L), and equilibrated overnight at 37°C, 5% CO2 before addition of various concentrations of venetoclax (range 10 µM to 1 pM), or vehicle control. AlamarBlue (Thermo Fisher Scientific) was added 48 hours after drug addition, and fluorescence was measured (560-nm excitation and 590-nm emission wavelengths) on a Victor X3 Multilabel Plate Reader (PerkinElmer, Waltham, MA) 6 hours thereafter. All readings were calculated with 0-hour background subtraction and normalized as a percentage of control wells.
Coculture in vitro cytotoxicity assays
Xenograft cells were cocultured with human telomerase reverse transcriptase (hTERT)-immortalized human mesenchymal stromal cells (hTERT-MSC; kindly provided by Dario Campana) as described previously.27 Briefly, 50 000 hTERT-MSCs per well were seeded in RPMI 1640 + fetal calf serum 10% in 96-well plates and left overnight to form adherent monolayers. Media were then changed to QBSF-60 (+ penicillin, streptomycin, glutamine, and Flt3-ligand 20 ng/mL). Cryopreserved xenograft cells were thawed, resuspended in this media, and added to hTERT-MSC–lined wells. After 4 hours, navitoclax, venetoclax, A-1113567,39 or A-115546340 alone or in selected combinations were added to triplicate wells to achieve final concentration ranges as per the figure legends. Following 24-hour drug exposure at 37°C in 5% CO2, viability was determined by propidium iodide exclusion using a FACSCalibur flow cytometer, and lethal concentrations, 50% (LC50s) were calculated by nonlinear regression analysis using Graphpad Prism.
Evaluation of drug synergy
Xenograft cells were treated in triplicate with serial 4-fold dilutions (range 0.25 nM to 1 μM) of venetoclax and A-1155463 alone and in a combination matrix that paired every concentration of each drug with the full range of concentrations of the second drug. The predicted additive effect of combined BH3-mimetics was calculated using the Bliss model of fractional independence41 and subtracted from the actual measured combinatorial effect to generate Bliss scores for each combination of drug concentrations. Bliss scores across each combination concentration matrix were summed for quantitative comparison across samples as previously described.40
Statistical analysis
EFS curves were compared using both log-rank and Gehan-Wilcoxon tests. The latter gives more weight to early events. Pearson’s correlation test was used for all datasets with normal distribution; otherwise Spearman’s correlation test was used. Significance was inferred from tests with P values <.05, except where α was corrected for multiple comparisons (threshold for significance: α/number of comparisons = 0.05/n).
Results
Venetoclax exhibits in vivo efficacy in only a minority of pediatric ALL xenografts
We have previously reported that navitoclax (100 mg/kg/d for 21 continuous days) exhibits broad in vivo efficacy in pediatric ALL, inducing leukemia progression delay >10 days in 27 (87%), and objective responses in 19 (61%) of 31 xenografts representing a range of high-risk ALL subtypes.26,27 To determine if this efficacy could be recapitulated by selectively targeting BCL-2, we initiated similar studies with venetoclax (100 mg/kg/d for 21 continuous days) against a panel of 19 pediatric ALL xenografts, including a representative subset of 16 from the above panel, of which 9 (56%) had achieved objective responses (3 partial responses [PRs], 4 complete responses [CRs], 2 maintained complete responses[ MCRs]) following navitoclax therapy. Overall, the venetoclax panel comprised 4 MLLr-ALL, 5 B-cell precursor (BCP-ALL), 4 BCP-ALL with known Janus kinase (JAK) mutations (JAK-mutated ALL), 4 T-cell (T-ALL), and 2 early T-cell precursor (ETP)-ALL xenografts.
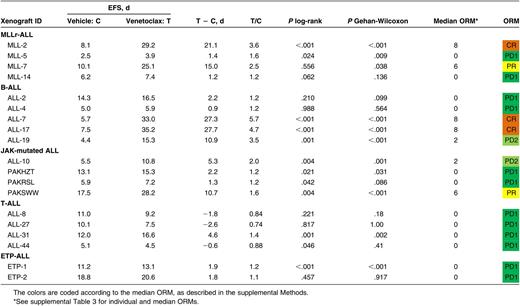
Venetoclax significantly delayed the progression of 11/19 (58%) xenografts tested (Table 1; Figure 1A-E; supplemental Figure 1), but only in 6/19 (32%) was leukemia progression delay >10 days (range −2.6 [ALL-27; P = 1.0] to 27.7 [ALL-17; P < .001]). When stratified by ALL subtype, median leukemia growth delay T − C calculations were 8.2 days for MLLr-ALL (range 1.2–21.0), 10.9 days for BCP-ALL (range 0.9–27.7), 3.8 days for JAK-mutated ALL (range 1.3–10.7), −1.2 days for T-ALL (range −2.6–4.6), and 1.9 days for ETP-ALL (range 1.8–1.9) (Figure 1F; Table 1). Notably, leukemia progression delay associated with venetoclax treatment appeared comparable to previously reported results with navitoclax27 for subgroups such as MLLr-ALL and BCP-ALL (Figure 1F). In contrast, there is a trend suggestive of superior progression delay in the navitoclax-treated T-ALL group, although this difference was not statistically significant (P = .017; corrected for multiple comparisons, α = 0.05, n = 5).

In vivo single-agent venetoclax responses of pediatric ALL xenografts. Responses of representative xenografts from the (A) MLLr-ALL, (B) BCP-ALL, (C) JAK-mutated ALL, (D) T-ALL, and (E) ETP-ALL subpanels treated with venetoclax (100 mg/kg for 21 days, dotted lines) or vehicle control (solid lines); results from individual mice are represented by gray lines, whereas the black lines summarize the outcome for each cohort. In each case, the left panels represent the %huCD45+ of individual mice over time, whereas the right panels show the proportion of mice remaining event free. (F) Leukemia growth delay (T − C) of ALL xenograft subtypes following treatment with navitoclax or venetoclax. Each data point represents the median cohort leukemia growth delay for each xenograft; the horizontal bar represents the median for each ALL subtype. Data from the navitoclax cohort have been published previously27 and are included here for comparison. Statistical comparison between cohorts treated with navitoclax vs venetoclax was by unpaired Student t tests corrected for multiple comparisons using the Bonferroni method. (G) “COMPARE-like” plot of the difference between the median ORM of xenografts shown in Table 1 and the midpoint response (which corresponds to a score of 5). Bars to the right or left of the midpoint represent objective responses or nonobjective responses, respectively. Xenografts achieving a PR (median ORM 6), CR (median ORM 8), or MCR (median ORM 10) classify as responders, whereas those with progressive disease (PD1, median ORM 0; or PD2, median ORM 2) classify as nonresponders.
In vivo single-agent venetoclax responses of pediatric ALL xenografts. Responses of representative xenografts from the (A) MLLr-ALL, (B) BCP-ALL, (C) JAK-mutated ALL, (D) T-ALL, and (E) ETP-ALL subpanels treated with venetoclax (100 mg/kg for 21 days, dotted lines) or vehicle control (solid lines); results from individual mice are represented by gray lines, whereas the black lines summarize the outcome for each cohort. In each case, the left panels represent the %huCD45+ of individual mice over time, whereas the right panels show the proportion of mice remaining event free. (F) Leukemia growth delay (T − C) of ALL xenograft subtypes following treatment with navitoclax or venetoclax. Each data point represents the median cohort leukemia growth delay for each xenograft; the horizontal bar represents the median for each ALL subtype. Data from the navitoclax cohort have been published previously27 and are included here for comparison. Statistical comparison between cohorts treated with navitoclax vs venetoclax was by unpaired Student t tests corrected for multiple comparisons using the Bonferroni method. (G) “COMPARE-like” plot of the difference between the median ORM of xenografts shown in Table 1 and the midpoint response (which corresponds to a score of 5). Bars to the right or left of the midpoint represent objective responses or nonobjective responses, respectively. Xenografts achieving a PR (median ORM 6), CR (median ORM 8), or MCR (median ORM 10) classify as responders, whereas those with progressive disease (PD1, median ORM 0; or PD2, median ORM 2) classify as nonresponders.
When responses were evaluated using clinically based criteria as previously described,34 objective responses were observed in 5/19 (26%) xenografts, with 3 CRs and 2 PRs (Table 1). Figure 1G represents the venetoclax responses of each xenograft in a “COMPARE-like” format.34 In agreement with the observed delays in leukemia progression, no significant differences were observed between ALL subtypes (Kruskal-Wallis, P = .24). A complete summary of results is provided in supplemental Figure 1 and supplemental Table 3. Of note, only 1/177 (0.56%) mice experienced toxicity-related morbidity following venetoclax treatment.
Overall, in vivo responses to venetoclax in a comparable test panel appeared less pronounced, were mostly less sustained, and were observed in a markedly smaller subset of ALL xenografts, compared with our previously published experience with navitoclax.27
High BCL-2 and low BCL-XL is associated with in vivo venetoclax response
We next sought to better understand the determinants of venetoclax response, to identify potential clinical biomarkers that identify candidates for venetoclax therapy, or conversely, patients who might respond better to navitoclax. Therefore, we compared BCL-2 family mRNA and protein expression in xenografts classified as responders (n = 5) vs nonresponders (n = 14).
Of 18 genes evaluated by microarray analysis, only BCL2L1 (encoding for BCL-XL/XS) approached significance in being upregulated in nonresponders vs responders (Figure 2A; P < .01), although the difference was not significant when corrected for multiple comparisons. There was correspondingly higher differential BCL-XL protein expression (Figure 2B-C; P = .014) in nonresponders, which again was not significant when corrected for multiple comparisons. Conversely, response to venetoclax was positively and significantly associated with higher BCL-2 protein expression (Figure 2B-C; P = .0072), although there was clear overlap in expression levels between groups. There was no significant difference in BAK, BAD, BIM, or MCL-1 mRNA, or protein expression between the 2 groups (Figure 2A-C).

Evaluation of BCL-XL and BCL-2 as potential determinants of in vivo venetoclax responses. Xenografts were stratified into venetoclax in vivo responders and nonresponders. (A) Microarray analysis of the BCL2 family of genes with each row representing a gene. Prosurvival genes are listed at the top (in red labels), with BCL2L1 (which encodes BCL-XL) highlighted with an arrow. There are 3 groups of proapoptotic genes, encoding BCL-2 family proteins bearing all 4 BCL-2 Homology (BH) domains (BAX/BAK-like in blue labels), the BH3 domain only (purple labels), or BH3 and BH2 domains (green labels). The colors in the heatmaps represent the relative expression per gene across all samples. Red indicates relative high expression, and blue indicates relative low expression. (B) Immunoblot analysis of BCL-2 family protein expression in all 19 xenografts. (C) Protein expression of BCL-2 family members in 19 xenografts was quantified using Versadoc and calculated relative to the expression of actin within each sample and normalized to HL-60. Each dot represents an average of 3 biological replicates of each xenograft. Groups were compared using Mann-Whitney tests. With Bonferroni correction for multiple comparisons (n = 6), P < .0083 for statistical significance.
Evaluation of BCL-XL and BCL-2 as potential determinants of in vivo venetoclax responses. Xenografts were stratified into venetoclax in vivo responders and nonresponders. (A) Microarray analysis of the BCL2 family of genes with each row representing a gene. Prosurvival genes are listed at the top (in red labels), with BCL2L1 (which encodes BCL-XL) highlighted with an arrow. There are 3 groups of proapoptotic genes, encoding BCL-2 family proteins bearing all 4 BCL-2 Homology (BH) domains (BAX/BAK-like in blue labels), the BH3 domain only (purple labels), or BH3 and BH2 domains (green labels). The colors in the heatmaps represent the relative expression per gene across all samples. Red indicates relative high expression, and blue indicates relative low expression. (B) Immunoblot analysis of BCL-2 family protein expression in all 19 xenografts. (C) Protein expression of BCL-2 family members in 19 xenografts was quantified using Versadoc and calculated relative to the expression of actin within each sample and normalized to HL-60. Each dot represents an average of 3 biological replicates of each xenograft. Groups were compared using Mann-Whitney tests. With Bonferroni correction for multiple comparisons (n = 6), P < .0083 for statistical significance.
When analyzed against leukemia T − C values and corrected for multiple comparisons, there were positive correlations only with the ratios of BCL-2/BCL-XL protein (Figure 3C; R2 = 0.47; P = .001) and mRNA (Figure 3F; R2 = 0.39; P = .004) expression, and BCL-2 protein levels (Figure 3B; R2 = 0.47; P = .0013). The correlations between leukemia growth delay and BCL-XL mRNA expression (Figure 3D; R2 = 0.34; P = .008) and BCL-2:MCL-1 protein ratios (supplemental Figure 2; R2 = 0.35; P = .008) only approached significance when corrected for multiple comparisons. Almost identical correlations were obtained using T/C, rather than T − C, values of in vivo venetoclax efficacy (supplemental Figure 3).

Correlations between in vivo venetoclax sensitivity and basal BCL-2/BCL-XL expression or in vitro venetoclax responses. (A-F) Basal protein or mRNA expression of BCL-XL, BCL-2, or the ratio of BCL-2:BCL-XL is plotted against leukemia growth delay (T − C). With Bonferroni correction for multiple comparisons (n = 8), P < .00625 for statistical significance. Each data point represents 1 xenograft. (G-H) In vitro LC50 values by AlamarBlue or coculture assays are plotted against leukemia growth delay (T − C). With Bonferroni correction for multiple comparisons (n = 2), P < .025 for statistical significance.
Correlations between in vivo venetoclax sensitivity and basal BCL-2/BCL-XL expression or in vitro venetoclax responses. (A-F) Basal protein or mRNA expression of BCL-XL, BCL-2, or the ratio of BCL-2:BCL-XL is plotted against leukemia growth delay (T − C). With Bonferroni correction for multiple comparisons (n = 8), P < .00625 for statistical significance. Each data point represents 1 xenograft. (G-H) In vitro LC50 values by AlamarBlue or coculture assays are plotted against leukemia growth delay (T − C). With Bonferroni correction for multiple comparisons (n = 2), P < .025 for statistical significance.
Taken together, these results indicate that higher levels of prosurvival proteins such as BCL-XL and MCL-1 that are not directly targeted by venetoclax undermine its antileukemic efficacy, whereas high BCL-2 expression may identify ALL patients more likely to benefit from venetoclax therapy. However, it is also evident, given the large overlap between groups in their expression of individual BCL-2 family proteins or ratios of selected proteins, that their quantification is insufficiently reliable as clinical biomarkers.
In vitro single-agent venetoclax sensitivity predicts in vivo venetoclax responses in pediatric ALL xenografts
We next investigated the relationship between in vitro venetoclax sensitivity and in vivo responsiveness in the panel of ALL xenografts. All 19 xenografts were treated with venetoclax (concentration range 1 pM to 10 μM) in vitro for 48 hours, and viability was assessed using the AlamarBlue mitochondrial activity assay. When corrected for multiple comparisons, there was a significant inverse correlation between in vitro venetoclax LC50 and leukemia growth delay (Figure 3G; R2 = 0.53; P = .0004). Median venetoclax LC50 was also significantly lower (P = .0007) in responder xenografts (median LC50 1.8 nM; range 0.3-6.8 nM), compared with nonresponders (median IC50 0.75 μM; range 5.0 nM to 4.5 μM) (Figure 4A; supplemental Figure 4). However, again some overlap was observed between the groups.

In vitro response to BH3-mimetics in pediatric ALL xenografts. (A) Summary of the mean venetoclax LC50 at 48 hours of each xenograft determined by AlamarBlue assay. Data are segregated by venetoclax in vivo response. Bar represents the median LC50 of each cohort. Groups compared by Mann-Whitney test. (B) ALL xenografts cocultured with hTERT-MSCs were treated (concentration range 1 nM-4 μM) with navitoclax (n = 24), venetoclax (n = 24), A-1113567 (n = 23), or A-1155463 (n = 24) alone, or an equimolar 50:50 mixture of venetoclax and A-1155463 (n = 24). Viability was evaluated using propidium iodide exclusion by flow cytometry, and LC50s calculated by nonlinear regression in Graphpad Prism are summarized here. A range rather than scale is depicted for LC50 > 10 μM, as these correspond to extrapolated rather than measured values. Wilcoxon matched-pairs signed rank test was used for statistical comparison between groups. P values are represented as follows: *P ≤ .05; **P ≤ .01; ***P ≤ .001; ****P ≤ .0001. (C) Sensitivity to navitoclax correlates significantly with sensitivity to venetoclax alone or a 50:50 mixture of venetoclax and A-1155463, but not A-1155463 alone. A-1155463 LC50 could not be calculated for the 2 samples with the highest navitoclax LC50. Pearson correlation coefficients are listed. (D) Sensitivity to navitoclax, venetoclax, A-1113567, or A-1155463 alone, or the venetoclax and A-1155463 50:50 mixture, by ALL subtype. (E) In MLLr-ALL, sensitivity to navitoclax correlates strongly with venetoclax sensitivity.
In vitro response to BH3-mimetics in pediatric ALL xenografts. (A) Summary of the mean venetoclax LC50 at 48 hours of each xenograft determined by AlamarBlue assay. Data are segregated by venetoclax in vivo response. Bar represents the median LC50 of each cohort. Groups compared by Mann-Whitney test. (B) ALL xenografts cocultured with hTERT-MSCs were treated (concentration range 1 nM-4 μM) with navitoclax (n = 24), venetoclax (n = 24), A-1113567 (n = 23), or A-1155463 (n = 24) alone, or an equimolar 50:50 mixture of venetoclax and A-1155463 (n = 24). Viability was evaluated using propidium iodide exclusion by flow cytometry, and LC50s calculated by nonlinear regression in Graphpad Prism are summarized here. A range rather than scale is depicted for LC50 > 10 μM, as these correspond to extrapolated rather than measured values. Wilcoxon matched-pairs signed rank test was used for statistical comparison between groups. P values are represented as follows: *P ≤ .05; **P ≤ .01; ***P ≤ .001; ****P ≤ .0001. (C) Sensitivity to navitoclax correlates significantly with sensitivity to venetoclax alone or a 50:50 mixture of venetoclax and A-1155463, but not A-1155463 alone. A-1155463 LC50 could not be calculated for the 2 samples with the highest navitoclax LC50. Pearson correlation coefficients are listed. (D) Sensitivity to navitoclax, venetoclax, A-1113567, or A-1155463 alone, or the venetoclax and A-1155463 50:50 mixture, by ALL subtype. (E) In MLLr-ALL, sensitivity to navitoclax correlates strongly with venetoclax sensitivity.
ALL blasts survive only briefly in vitro, implicating a significant role for the microenvironment in sustaining their survival. Notably, such factors may impact sensitivity to BH3-mimetics.42 We have previously demonstrated that navitoclax sensitivity of pediatric ALL xenografts in an in vitro coculture assay predicts in vivo responses.27 We thus evaluated the venetoclax sensitivity of our xenograft panel cultured on a hTERT-MSC feeder layer. As the high background metabolic activity of hTERT-MSCs precludes the Alamar Blue assay, viability of cocultured xenograft cells was assessed by flow cytometry. Notably, there was good correlation between in vitro sensitivity determined by each method (supplemental Figure 5) and LC50 derived from the coculture assay also correlated with leukemia growth delay (Figure 3H).
ALL xenografts demonstrate heterogeneous patterns of BCL2 family protein dependence
The variable in vivo and in vitro BH3-mimetic responses demonstrated above suggest heterogeneous patterns of prosurvival BCL-2 family protein dependence across the panel of ALL xenografts. To more precisely dissect relative dependence on BCL-2 and/or BCL-XL, and determine whether these patterns segregate by ALL subtype, we compared the differential in vitro sensitivity of individual xenografts to navitoclax, venetoclax, or BCL-XL inhibitors (A-1113567 or A-1155463, which have comparable potency; supplemental Figure 6) in an expanded panel of 24 ALL xenografts.
Navitoclax demonstrated broad activity across all xenografts, with a median LC50 of 3.57 nM (range 0.70 nM to 82 nM) (Figure 4B). Consistent with our in vivo findings, venetoclax was significantly less active (median LC50 94.2 nM) overall across the panel of xenografts compared with navitoclax (Figure 4B; P < .0001), with a wide, bimodal range of sensitivities (0.28 nM to 2.92 μM). Notably, this was also true of both selective BCL-XL inhibitors, which demonstrated significantly less potent killing compared with both navitoclax and venetoclax (Figure 4B). Despite the lower efficacy of BCL-2 inhibition, however, there was a significant correlation between the paired responses of individual xenografts to navitoclax and venetoclax (R2 = 0.53, P < .0001) overall, but not A-1155463 (R2 = 0.08, P = .19), suggesting that inhibition of BCL-2, but not BCL-XL, consistently contributes to the activity of navitoclax in ALL (Figure 4C).
To ascertain whether concurrent inhibition of both BCL-2 and BCL-XL (and not BCL-W) is sufficient to account for the superior activity associated with navitoclax compared with the selective inhibitors, xenografts were also treated with a 50:50 mixture of venetoclax and the BCL-XL inhibitor A-1155463 in vitro. On an equimolar basis, this combination killed ALL xenografts with comparable efficiency to navitoclax (Figure 4B). Moreover, there was a strong correlation between LC50s of navitoclax and the venetoclax:A-1155463 mixture (Figure 4C; R2 = 0.84, P < .0001), indicating that BCL-2 and BCL-XL are the primary targets that underpin navitoclax activity in ALL.
We next examined BH3-mimetic sensitivity by ALL subtype. The overall trends observed across the xenograft panel were generally recapitulated within each group, with a trend to superior navitoclax activity when compared against the selective inhibitors of either BCL-2 or BCL-XL (Figure 4D). There was, however, a striking exception in the notable sensitivity of MLLr-ALL xenografts to venetoclax, with LC50 < 5 nM in 5 of 8 xenografts. Interestingly, there was also a strong correlation between navitoclax and venetoclax LC50 (R2 = 0.78, P = .004), but not with A-1155463 (R2 = 0.03, P = .69) in MLLr-ALL xenografts (Figure 4E). A correlation between navitoclax and venetoclax LC50 was not observed in any other subgroup.
Concurrent inhibition of BCL-2 and BCL-XL results in synergistic killing of most ALL xenografts
To formally evaluate the combinatorial efficacy of concurrent BCL-2 and BCL-XL inhibition, we next performed in vitro assays combining venetoclax and A-1155463 and determined if killing was synergistic using the Bliss fractional independence model. Cumulative Bliss scores for each sample were calculated, with Bliss sums >300 considered indicative of synergy in our studies, as previously described.40
Marked synergy was observed in samples across all groups, with Bliss sums >300 in 17/24 (71%) xenografts (Figure 5). Mean Bliss sum across groups was 458, with no significant difference in mean Bliss sum between groups. Interestingly, despite the potent activity of venetoclax as a single agent in MLLr-ALL, additional efficacy was achieved even in this group by targeting BCL-XL concurrently, at least at low concentrations of venetoclax <62.5 nM. Notably, potent in vitro synergy was also observed in xenografts, which had demonstrated objective responses to navitoclax but not venetoclax in vivo (Figure 5A), such as ALL-19, ETP-1, ETP-2, ALL-10, and ALL-3127 (which in fact had the highest observed Bliss sum), supporting the notion that these xenografts are substantially dependent on both BCL-2 and BCL-XL for survival.

Concurrent BCL-2 and BCL-XL inhibition induces synergistic killing in most ALL xenografts. (A) The predicted additive effect of combined BH3-mimetics was calculated using the Bliss model of fractional independence and subtracted from the actual measured combinatorial effect to generate Bliss scores for each combination of drug concentrations. The sum of Bliss scores across the combination concentration matrix for each xenograft was calculated and summarized by ALL subtype. Red symbols represent the Bliss sum for xenografts, which demonstrated objective in vivo responses to navitoclax, but not venetoclax therapy. Bliss sums >300 were considered to indicate substantial synergy in our studies (where 7 × 7 concentration matrices were used; this is consistent with the threshold used in other studies, where, for example, a threshold of >150 was used for 9 × 3 or 5 × 5 matrices, corresponding to a similar average difference between observed and predicted killing per combination of drug concentrations).40 (B) Bliss scores across the combination concentration matrix for each xenograft are presented as a heatmap, with red squares representing drug synergy where there was observed absolute difference in killing of at least 20% in excess of that predicted by the Bliss model of fractional independence.
Concurrent BCL-2 and BCL-XL inhibition induces synergistic killing in most ALL xenografts. (A) The predicted additive effect of combined BH3-mimetics was calculated using the Bliss model of fractional independence and subtracted from the actual measured combinatorial effect to generate Bliss scores for each combination of drug concentrations. The sum of Bliss scores across the combination concentration matrix for each xenograft was calculated and summarized by ALL subtype. Red symbols represent the Bliss sum for xenografts, which demonstrated objective in vivo responses to navitoclax, but not venetoclax therapy. Bliss sums >300 were considered to indicate substantial synergy in our studies (where 7 × 7 concentration matrices were used; this is consistent with the threshold used in other studies, where, for example, a threshold of >150 was used for 9 × 3 or 5 × 5 matrices, corresponding to a similar average difference between observed and predicted killing per combination of drug concentrations).40 (B) Bliss scores across the combination concentration matrix for each xenograft are presented as a heatmap, with red squares representing drug synergy where there was observed absolute difference in killing of at least 20% in excess of that predicted by the Bliss model of fractional independence.
Venetoclax induced objective responses in 3 of 6 MLLr-ALL xenografts
Given the promising in vitro sensitivity profile of MLLr-ALL xenografts in our in vitro panel and the strong correlation between navitoclax and venetoclax activity in this group, we performed in vivo studies with venetoclax in an additional 2 MLLr-ALL xenografts, which have previously demonstrated objective responses to navitoclax.27 MLL-3 and ALL-3 demonstrated significant leukemia growth delays of 13.3 days (P < .001) and 59.4 days (P = .001), respectively (Figure 6), with ALL-3 achieving MCR. MLL-3 achieved a median objective response of progressive disease 2 (PD2) despite 3/7 mice being scored as PRs. Collectively, overall objective responses were achieved in 3 of 6 (50%) MLLr-ALL xenografts with venetoclax, compared with 6 of 21 (29%) of the overall cohort, or 3 of 15 (20%) non-MLLr-ALL xenografts. A waterfall plot also exemplified the in vivo venetoclax sensitivity of MLLr-ALL xenografts; 4 of 8 xenografts that achieved a negative change from baseline %huCD45+ cells were MLLr-ALL (Figure 7).

In vivo single-agent venetoclax responses in 2 additional MLLr-ALL xenografts. (A-B) Xenografts were treated with venetoclax (100 mg/kg for 21 days, dotted line) or vehicle control (solid lines). Gray lines represent results from individual mice, whereas the black lines represent the median outcome for each cohort. Left panels represent the %huCD45+ of individual mice over time, whereas the right panels show the proportion of mice remaining event free. (C) Summary of xenograft responses to venetoclax.
In vivo single-agent venetoclax responses in 2 additional MLLr-ALL xenografts. (A-B) Xenografts were treated with venetoclax (100 mg/kg for 21 days, dotted line) or vehicle control (solid lines). Gray lines represent results from individual mice, whereas the black lines represent the median outcome for each cohort. Left panels represent the %huCD45+ of individual mice over time, whereas the right panels show the proportion of mice remaining event free. (C) Summary of xenograft responses to venetoclax.

Waterfall plot depicting best response to venetoclax across all 21 xenografts tested. This panel includes the original 19 xenografts tested, as well as the additional 2 MLLr-ALL xenografts. The data depict the change in huCD45+ from baseline to minimum huCD45+ posttreatment initiation, expressed as a percentage of baseline. Dots are individual mice, and the bars are the medians shown in the column “∆CD45/Baseline” from supplemental Table 3 expressed as % change. A value of –100% indicates undetectable huCD45+ in the mouse peripheral blood. The values are capped at +100%, but the ordering of xenografts is based on the uncapped median. That is, the xenografts at the far left had the most rapidly growing tumors. Only treated mice are included in the waterfall plot.
Waterfall plot depicting best response to venetoclax across all 21 xenografts tested. This panel includes the original 19 xenografts tested, as well as the additional 2 MLLr-ALL xenografts. The data depict the change in huCD45+ from baseline to minimum huCD45+ posttreatment initiation, expressed as a percentage of baseline. Dots are individual mice, and the bars are the medians shown in the column “∆CD45/Baseline” from supplemental Table 3 expressed as % change. A value of –100% indicates undetectable huCD45+ in the mouse peripheral blood. The values are capped at +100%, but the ordering of xenografts is based on the uncapped median. That is, the xenografts at the far left had the most rapidly growing tumors. Only treated mice are included in the waterfall plot.
There was no significant difference in BCL-2 family protein expression or in vitro venetoclax LC50 between MLLr-ALL responders and nonresponders (supplemental Figure 7).
Discussion
Improvements in the outcome of children with ALL over the last 3 decades have largely reflected gradual, incremental optimization of combination chemotherapy protocols employing a panel of antileukemic drugs that has remained essentially unchanged in that time. Although the majority of children with newly diagnosed ALL are cured, there are increasingly well-characterized patient subgroups that derive markedly inferior benefit from existing treatments, in whom more effective treatment will likely only be possible with the clinical translation of novel therapies.
There is currently great excitement at the emergence of immunologically based therapies. Monoclonal antibodies against B-cell antigens, including CD22 (inotuzumab ozogamicin, moxetumomab, epratuzumab) and CD19 (the bispecific T-cell–engaging blinatumomab), have demonstrated promising activity in clinical trials.43-47 Similarly, chimeric antigen receptor T cells targeting CD19 have shown substantial clinical efficacy in heavily pretreated patients with ALL or CLL.48,49 However, there has already been recognition of tumor escape by target antigen downregulation.50 Importantly, they cannot target leukemias lacking these antigens, including, for example, all T-ALL. There remains a need for additional therapies targeting essential intrinsic processes of ALL cells for patients with poor prognosis disease.
BH3-mimetics have a novel mechanism of action specifically designed to overcome apoptotic dysfunction that underpins chemoresistance in many cancers. The validity of this approach has been borne out in CLL, where navitoclax and now venetoclax have induced previously unachievable clinical responses in patients refractory to all standard chemotherapeutic agents.20,23 Notably, venetoclax responses in CLL have been demonstrated to be independent of the presence of TP53 mutations,23 which identify CLL patients with the worst outcome following standard chemoimmunotherapy.51 Interestingly, TP53 mutations are now recognized to be strongly associated with low hypodiploid ALL,52 a subgroup with very poor prognosis, and are an independent predictor of poor outcome in ALL.53 Although no hypodiploid or TP53 mutant ALL xenografts were included in our panel, it would be of considerable interest to characterize the prosurvival BCL-2 family protein dependencies of these ALL subgroups.
We have demonstrated in this study that inhibition of BCL-2 alone is unlikely to recapitulate in ALL the broad activity venetoclax has demonstrated in CLL. Compared with our results with navitoclax in a comparable xenograft panel,27 venetoclax demonstrated markedly inferior in vivo activity, inducing objective responses in only 29% of xenografts (compared with 61% with navitoclax). Moreover, responses observed following venetoclax were generally less pronounced and not sustained. As venetoclax and navitoclax have comparable potency against BCL-2,22 our data indicate that concurrent inhibition of BCL-2 and BCL-XL is likely necessary for efficacy in the majority of ALL, consistent with the critical role of BCL-XL in early lymphoid ontogeny,54,55 in contrast to the predominant role of BCL-2 in mature B cells,56,57 from which CLL is believed to originate. Indeed, we have identified BCL-XL expression, at both the protein and the mRNA level, as a predictor of poor venetoclax response in vivo, and proceeded to show through detailed in vitro studies that simultaneous targeting of BCL-2 and BCL-XL is more potent than selective targeting of either protein and induces synergistic killing across a wide range of ALL xenografts, including T-ALL and ETP-ALL, which have previously been identified as BCL-XL- or BCL-2-dependent, respectively.58,59 However, the limited efficacy of venetoclax in the majority of ALL xenografts does not preclude a broader potential role in ALL as a chemosensitizing agent, analogous to its emerging role in AML, where greater efficacy has been observed in combination with hypomethylating agents.60
We identified MLLr-ALL, a poor prognosis disease subgroup (5-year EFS 36%),61 as a notable exception where antagonism of BCL-2 alone proved efficacious in 50% of xenografts tested. This observation extends a recent published finding that MLL rearrangement directly induces BCL-2 expression in ALL cells by promoting H3K79 methylation at the BCL2 locus.62 In that study, single-agent efficacy was observed in 1 of 2 MLLr-ALL xenografts treated with venetoclax in vivo. Notably, even within the MLLr-ALL subgroup, we found that the addition of a BCL-XL inhibitor provided additional synergistic efficacy at submaximal exposures to venetoclax, and 1 of the 3 xenografts nonresponsive to venetoclax had previously demonstrated objective responses to navitoclax.
Our data also support recent findings highlighting the venetoclax sensitivity of ALL harboring the TCF3-HLF translocation.63 Our study included 1 such xenograft (ALL-7), which achieved a CR when exposed to venetoclax, progression delay of 27 days, and T/C value of 5.7. A similar response was previously observed when navitoclax was tested against ALL-7 in vivo.27
Our results contrast somewhat with previous studies identifying BCL-2 as the primary target accounting for navitoclax efficacy in the lymphoid compartment.64 Using highly selective BH3-mimetics, we have delineated the efficacy of inhibiting BCL-2 or BCL-XL alone or in combination and conclusively proven that both BCL-2 and BCL-XL are critically relevant targets of navitoclax in ALL, unlike CLL, where inhibition of BCL-2 only is sufficient.22 However, the strong correlation between navitoclax and venetoclax LC50, lack of correlation with A-1155463 LC50, and consistently inferior potency of selective BCL-XL inhibitors compared with either navitoclax or venetoclax across the xenograft panel indicate that inhibiting BCL-2 is of central importance to, although insufficient to fully account for, navitoclax activity in ALL.
Our study provides a framework for progressing BH3-mimetics into the clinic in ALL, indicating that BCL-2 family protein dependencies across different ALL subtypes are heterogeneous and providing the basis for selecting specific patient groups as candidates for navitoclax or venetoclax therapy in clinical trials. In MLLr-ALL and TCF3-HLF-positive ALL, venetoclax could be favored over navitoclax based on its single-agent activity, superior tolerability, and higher clinically achievable exposures, with these factors collectively outweighing the potential for synergistic efficacy from simultaneous BCL-2 and BCL-XL inhibition. In other forms of ALL, there is a clear basis for progressing navitoclax into trials ahead of venetoclax. In either case, consideration of using both drugs in combination with established drugs is highly recommended.
The data reported in this article have been deposited in the Gene Expression Omnibus database (accession number GSE52991).
The online version of this article contains a data supplement.
The publication costs of this article were defrayed in part by page charge payment. Therefore, and solely to indicate this fact, this article is hereby marked “advertisement” in accordance with 18 USC section 1734.
Acknowledgments
This research was funded by grants from the National Institutes of Health, National Cancer Institute (NOI-CM-42216 and NOI-CM-91001-03), the Leukemia and Lymphoma Society (SCOR 7417-07 and 7001-13), and the National Health and Medical Research Council (NHMRC) of Australia (1016647 and 1016701). S.S. was supported by Postdoctoral Fellowships from the Leukaemia Foundation of Australia and the Cure Cancer Australia Foundation, and an Early Career Fellowship from the Cancer Institute New South Wales. R.B.L., A.W.R., and D.C.S.H. are supported by Fellowships from the NHMRC (1059804, 1079560, 1043149). The authors thank AbbVie for providing navitoclax, venetoclax, A-1113567, and A-1155463. The Walter and Eliza Hall Institute of Medical Research is supported by an Independent Research Institutes Infrastructure Support Scheme grant 9000220 (NHMRC) and Victorian State Government Operational Infrastructure Support grant.
Children’s Cancer Institute Australia is affiliated with UNSW Australia and the Sydney Children’s Hospitals Network. The Royal Children’s Hospital, University of Melbourne, and the Walter and Eliza Hall Institute of Medical Research are members of the Victorian Comprehensive Cancer Centre.
Authorship
Contribution: S.S., S.L.K., P.J.H., M.A.S., H.C., A.W.R., D.C.S.H., and R.B.L. designed the study; H.C., K.E., J.R., and A.R. performed in vivo experiments; S.L.K. and S.S. performed in vitro drug sensitivity testing; S.S., S.L.K., R.T.K., C.A.B., S.W.E., and Y.G. analyzed the data; S.L.K., S.S., P.J.H., M.A.S., A.W.R., D.C.S.H., and R.B.L. interpreted the data and wrote the manuscript.
Conflict-of-interest disclosure: S.L.K., A.W.R., and D.C.S.H. are employees of the Walter and Eliza Hall Institute of Medical Research, which receives milestone payments for venetoclax. All other authors declare no competing financial interests.
Correspondence: Richard B. Lock, Children’s Cancer Institute, Lowy Cancer Research Centre, UNSW, PO Box 81, Randwick, NSW 2031, Australia; e-mail: rlock@ccia.unsw.edu.au.
