Key Points
The CEBPA locus harbors 14 enhancers of which distinct combinations are active in different CEBPA-expressing tissues.
A +42-kb enhancer is required for myeloid-lineage priming to drive adequate CEBPA expression levels necessary for neutrophilic maturation.
Abstract
Neutrophilic differentiation is dependent on CCAAT enhancer-binding protein α (C/EBPα), a transcription factor expressed in multiple organs including the bone marrow. Using functional genomic technologies in combination with clustered regularly-interspaced short palindromic repeat (CRISPR)/CRISPR-associated protein 9 genome editing and in vivo mouse modeling, we show that CEBPA is located in a 170-kb topological-associated domain that contains 14 potential enhancers. Of these, 1 enhancer located +42 kb from CEBPA is active and engages with the CEBPA promoter in myeloid cells only. Germ line deletion of the homologous enhancer in mice in vivo reduces Cebpa levels exclusively in hematopoietic stem cells (HSCs) and myeloid-primed progenitor cells leading to severe defects in the granulocytic lineage, without affecting any other Cebpa-expressing organ studied. The enhancer-deleted progenitor cells lose their myeloid transcription program and are blocked in differentiation. Deletion of the enhancer also causes loss of HSC maintenance. We conclude that a single +42-kb enhancer is essential for CEBPA expression in myeloid cells only.
Introduction
All cell types in the bone marrow are derived from a pool of hematopoietic stem and progenitor cells (HSPCs) that sustain blood cell development throughout the life of an organism. Prior to lineage commitment and differentiation, HSPCs undergo chromatin changes brought about by lineage-specific transcription factors (LTFs) to prime and activate lineage-specific gene expression programs.1 Priming of cell lineages involves the accessibility and activity of cell type-specific enhancers by LTFs to regulate the expression of genes responsible for any given cell lineage.2-4
Cell-lineage priming occurs during cell-fate decisions which are mainly dependent on the concentration or dosage of LTFs.5-7 For instance, lymphoid-primed progenitors have high concentrations of lymphoid-related LTFs such as IKAROS, E47, and EBF that bind and activate lymphoid-specific enhancers to induce lymphoid development.8 To skew differentiation toward myelopoiesis, these factors become negatively regulated upon increased dosage of the inhibitors of differentiation transcription factors (TFs), in order to favor increased PU.1 levels and promote myeloid commitment.9 The leucine zipper TF CCAAT enhancer-binding protein α (C/EBPα) instructs myeloid differentiation via the priming and activation of myeloid-associated genes in HSPCs10 and competes for genomic occupancy with other TFs, such as PU.1 and GATA2 in the myeloid-erythroid progenitor compartment, to favor neutrophilic differentiation over monocytic, erythroid, and megakaryocytic cell differentiation.11,12 The important role of C/EBPα in myelopoiesis is substantiated by the diverse oncogenic mechanisms that target C/EBPα levels and function in various subsets of acute myeloid leukemia (AML).13-18 Moreover, Cebpa knockout mouse models show severe myeloid defects in the bone marrow19 as well as in several other organs including the liver,20 lung,21 bone tissue22 as well as in epithelium of the gut,23 implying its broad role as a differentiation TF in several organs. The broad role of C/EBPα as a differentiation mediator in multiple tissues suggests that CEBPA is under the control of tissue-specific transcriptional regulatory mechanisms.24 Transcription regulation occurs in a hierarchical order of multistep processes that involve the structural organization of the genome to regulate gene expression programs via tissue-specific enhancers.25-27
In this study, we investigated how CEBPA transcription is regulated during myelopoiesis. We show that the CEBPA locus harbors, in total, 14 enhancers and we asked whether CEBPA contacts tissue-specific enhancers in different CEBPA-expressing cell types. Using a combination of functional genomics and clustered regularly-interspaced short palindromic repeat (CRISPR)/CRISPR-associated protein 9 (Cas9) genome editing in human cell lines and mouse models, we show that the +42-kb enhancer acts autonomously in myeloid-primed hematopoietic stem cells (HSCs) in the bone marrow to drive adequate CEBPA expression levels necessary for full neutrophilic maturation.
Materials and methods
Cell lines and cell culture
Cell lines were cultured as follows: U937, THP-1, Raji, Jurkat in 90% RPMI 1640 and 10% fetal calf serum (FCS); Hep3B, H292, and HepG2 80% RPMI 1640 and 20% FCS; HEK293T and HeLa in 90% Dulbecco modified Eagle medium and 10% FCS. All cell lines were supplemented with 50 U/mL penicillin and 50 μg/mL streptomycin.
High-resolution circularized chromatin conformation capture sequencing
High-resolution circularized chromatin conformation capture sequencing (4C-seq) was conducted as previously described.28 In brief, 10 × 106 cells were crosslinked with 2% formaldehyde for 10 minutes at room temperature. Glycine (0.125 M) was added to quench the crosslinking reaction and cells were centrifuged and suspended in lysis buffer to disrupt membranes and isolate chromatin. A primary 4-base cutter, either DPNII or NLAIII, was used for digestion, followed by diluted ligations. After precipitation, chromatin was further subjected to a second round of digestions with a different 4-base cutter (either Csp6I or BFAII) and ligated to small-circularized plasmids. Primers for the CEBPA viewpoint (forward, TACTGCTTCTTTACTGCGATC; reverse, CAAGCAGAAGACGGCATACGA) and for the 21-kb contact domain viewpoint (forward, GCCCAGGAGCCTGTGAGATC; reverse, ACTCTGAGTGCAGAGAGGAG) were designed as previously reported.28 Primers were designed for 4C-seq taking the viewpoints at the 5′ border of the 170-kb topological-associated domain (TAD) near CEBPG (forward, TTTTACAAGTCACAGGGATC; reverse, ACGTCCTCTGTATTGCCTAG) and the 3′ border of the TAD, near the promoter of SLC7A10 (forward, CCAGCACACACTGCAAGATC; reverse, GGAGGGAGTTCTGTGTGG). Inverse polymerase chain reaction (PCR) was carried out to amplify sample libraries that were pooled and spiked with 40% PhiX viral genome sequencing library to increase sample diversity. Multiplexed sequencing was performed on the HiSeq2500 platform. 4C-seq data analysis is explained in the supplemental Methods (available on the Blood Web site).
ChIP sequencing
Chromatin immunoprecipitation (ChIP) experiments were performed as previously described.29 Cells were crosslinked at room temperature for 10 minutes with 1% formaldehyde and sonicated to shear the chromatin. Immunoprecipitation of crosslinked chromatin was performed overnight at 4°C with antibodies directed against the histone mark H3K27ac, the coactivator p300, and TFs including RUNX1, LMO2, PU.1, ERG, TAL1, and SCL, or an equal amount of isotype immunoglobulin G (IgG) as background control (http://149.171.101.136/python/BloodChIP/search.html). Descriptions detailing the preparation of library preparation, genome alignment, and peak calling are included in the supplemental Methods.
Flow cytometry and sorting
Flow cytometry and sorting were carried out on the LSRII and the FACSAria IIIU (Becton Dickinson), respectively, using the following fluorescent antibodies: CD11B- allophycocyanin (APC)/GR1–fluorescein isothiocyanate/B220-phycoerythrin (PE)/CD45 peridinin chlorophyll CY5/LIN bio cocktail streptavidin–Pacific Orange/cKIT-APC/SCA1-PB/CD48–fluorescein isothiocyanate/CD150-PE-CY7/CD16-32APC-CY7/CD34-PE. All antibodies were purchased from BD Biosciences and Biologend. Sorted fractions were collected in 500 µL of phosphate-buffered saline with 5% FCS, spun down, and resuspended in 800 µL of TRIzol and used for RNA sequencing (RNA-seq).
RNA-seq
Total sample RNA was extracted using TRIzol with Genelute LPA (Sigma) as a carrier, and the SMARTer Ultra Low RNA kit for Illumina Sequencing (Clontech) was used for complementary DNA synthesis according to the manufacturer’s protocol. The complementary DNA was sheared with the Covaris device and further processed according to the TruSeq RNA Sample Preparation, v2 Guide (Illumina). The amplified sample libraries were subjected to paired-end sequencing (2 × 75 bp) and aligned against mm10 using TopHat, v2.30,31 Alignment and processing of RNA-seq data are documented in the supplemental Methods.
Luciferase reporter assays
The full canonical CEBPA promoter was PCR amplified from genomic DNA (gDNA) and cloned into the pGL4.11 (Luc2CP) (EcoRV/HindIII) (Promega) luciferase construct. The +9-kb or +42-kb enhancers were PCR amplified and cloned into pGL4.11 (luc2CP) (Sal1/BamH1) 3′ of the luciferase gene in the same construct where the full canonical CEBPA promoter was cloned (see supplemental Methods for primer sequences). HEK293T cells were transfected with Lipofectamine 2000 (Invitrogen), U937 electroporated with Lonza Kit (Kit-C), Jurkat, K562, THP-1, HepG2, and H292 cells with X-tremeGENE HP DNA Transfection Reagent (Roche). Cells were harvested after 48 hours, and luciferase activity was measured with the Dual-Luciferase Reporter Assay System (Promega) on a Victor X3 plate reader (Perkin Elmer). All assays were measured in duplicates and performed minimally 3 times.
CRISPR in human cell lines
CRISPR in human cell lines and in mouse fertilized eggs was carried out as explained in the supplemental Methods.
Results
CEBPA interacts with multiple intergenic regions, one of which is only prominent in CEBPA+ myeloid cells
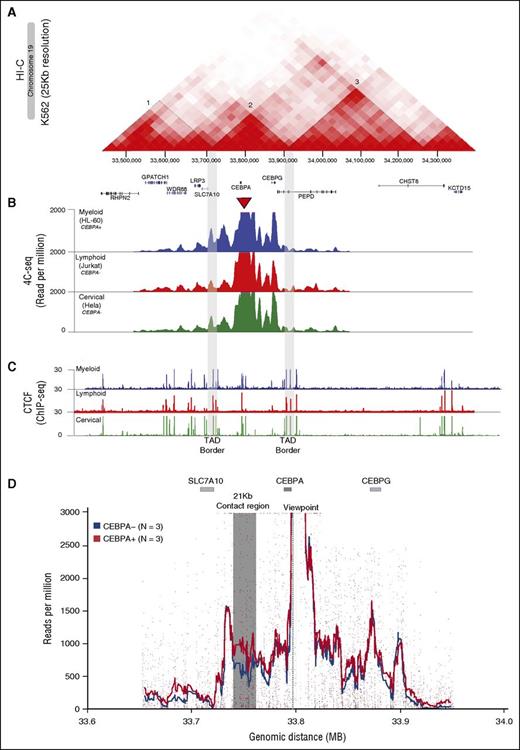
Promoter-enhancer interactions occur within TADs and gene promoters confined within such a domain might share the same set of enhancers for transcriptional regulation.32-35 HI-C sequencing data,36 a comprehensive technique to capture the conformation of genomes,32 shows that CEBPA is located in a 170-kb conserved TAD (labeled 2 in Figure 1A and supplemental Figure 1A) on chromosome 19. This TAD also contains CEBPG and the promoter of SLC7A10, located 5′ and 3′ of CEBPA, respectively (Figure 1A). To determine the interacting regions within the 170-kb TAD (CEBPA-TAD) we applied high-resolution 4C-seq28 taking the CEBPA promoter as a viewpoint (Figure 1B). Eight contact regions, located 5′ and 3′ of CEBPA, were found in all cell lines investigated,37 that is, in CEBPA-expressing (CEBPA+) myeloid cell lines HL-60, MOLM-1, U937, and THP-1, the lymphoid CEBPA− cell lines Jurkat and Raji, the lung CEBPA+ cell line H292, and the cervical CEBPA− cell line HeLa (Figure 1B; supplemental Figure 1B). These contact domains varied in size between 10 and 22 kb (median = 11.65 kb) (supplemental Figure 1D). Taking the borders of the CEBPA-TAD as viewpoints (supplemental Figure 1C), 4C-seq revealed that the interactions were confined to this TAD. No significant interactions with the adjacent TADs 1 and 3 were found, in line with the binding of the architectural protein CTCF36,38 to the borders of the CEBPA-TAD (labeled 1 and 3 in Figure 1A-C).
The CEBPA promoter contacts multiple intra-TAD genomic sites. Stronger interaction with a 21-kb genomic region in CEBPA-expressing myeloid cells. (A) HI-C heatmap matrix (25-kb resolution) in the K562 cell line on chromosome 19 reveals a 170-kb CEBPA TAD (2), which is flanked by TADs 1 and 3. The CEBPA TAD also contains CEBPG and part of SLC7A10. (B) Normalized 4C-seq profiles of myeloid CEBPA+ HL-60 (blue), lymphoid CEBPA− Jurkat (red) and cervical CEBPA− HeLa (green) cell lines. The viewpoint (red triangle) located at the CEBPA promoter shows multiple interacting sites confined to the CEBPA-TAD (borders marked in gray). (C) CTCF ChIP-seq (ENCODE) in the myeloid HL-60, lymphoid Jurkat, and cervical HeLa cell lines shows enrichment at the CEBPA TAD borders (gray) which overlap with the HI-C contact-matrix borders separating the CEBPA-containing TAD2 from TAD1 and TAD3. (D) Semiquantitative analysis of 4C-seq data to distinguish interacting regions occurring at higher contact frequencies in CEBPA+ myeloid cells (orange; n = 3) compared with CEBPA− cells (blue; n = 3). The CEBPA viewpoint is marked with a dotted line. A specific region indicated in gray of around 21 kb located 3′ of CEBPA and with >250 reads per million shows a statistically significant higher contact frequency (FDR < 0.05) in CEBPA+ as compared with CEBPA− cell lines.
The CEBPA promoter contacts multiple intra-TAD genomic sites. Stronger interaction with a 21-kb genomic region in CEBPA-expressing myeloid cells. (A) HI-C heatmap matrix (25-kb resolution) in the K562 cell line on chromosome 19 reveals a 170-kb CEBPA TAD (2), which is flanked by TADs 1 and 3. The CEBPA TAD also contains CEBPG and part of SLC7A10. (B) Normalized 4C-seq profiles of myeloid CEBPA+ HL-60 (blue), lymphoid CEBPA− Jurkat (red) and cervical CEBPA− HeLa (green) cell lines. The viewpoint (red triangle) located at the CEBPA promoter shows multiple interacting sites confined to the CEBPA-TAD (borders marked in gray). (C) CTCF ChIP-seq (ENCODE) in the myeloid HL-60, lymphoid Jurkat, and cervical HeLa cell lines shows enrichment at the CEBPA TAD borders (gray) which overlap with the HI-C contact-matrix borders separating the CEBPA-containing TAD2 from TAD1 and TAD3. (D) Semiquantitative analysis of 4C-seq data to distinguish interacting regions occurring at higher contact frequencies in CEBPA+ myeloid cells (orange; n = 3) compared with CEBPA− cells (blue; n = 3). The CEBPA viewpoint is marked with a dotted line. A specific region indicated in gray of around 21 kb located 3′ of CEBPA and with >250 reads per million shows a statistically significant higher contact frequency (FDR < 0.05) in CEBPA+ as compared with CEBPA− cell lines.
A region of 21-kb prominently contacts the CEBPA promoter
We next investigated whether any of the 8 contact regions identified by 4C-seq showed differential promoter interactions in CEBPA+ myeloid cell lines compared with CEBPA− cells. A semiquantitative analysis of 4C-seq data was conducted by comparing 3 myeloid CEBPA+ (MOLM-1, U937, and HL-60) with 3 nonmyeloid CEBPA− (Jurkat, Raji and HeLa) cell lines. The contact region of ∼21 kb in size located 3′ of CEBPA (supplemental Figure 1D) showed a more significant interaction (false discovery rate [FDR] < 0.05) in the CEBPA+ cell lines compared with CEBPA− cells (Figure 1D). In contrast, no major interaction differences were observed for the other CEBPA promoter-interacting regions. A reciprocal 4C-seq experiment using the 21-kb contact region as a viewpoint confirmed that the interaction with the CEBPA gene occurred at a higher frequency in CEBPA+ myeloid cell lines (FDR < 0.05) (supplemental Figure 1E). These findings show that a distant region of 21 kb interacts with CEBPA prominently in CEBPA+ myeloid cells, suggesting a myeloid-specific chromatin conformation at this region.
Two potential enhancers with myeloid preference located within the 21-kb contact region
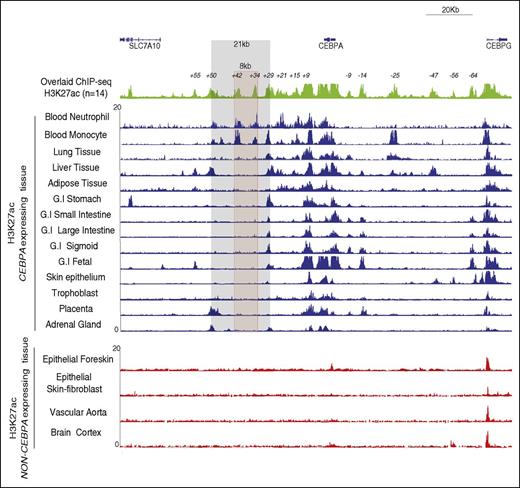
To identify regions of active chromatin in peripheral blood neutrophils and monocytes, we conducted H3K27ac ChIP-seq and compared the determined H3K27ac profiles to those obtained from public available data derived from other human primary CEBPA+ (n = 12) and CEBPA− (n = 4) tissues (http://www.roadmapepigenomics.org/). The H3K27ac ChIP-seq profiles revealed 14 potential enhancers within the CEBPA-TAD, located upstream and downstream of CEBPA (Figure 2 green profile). Each tissue investigated harbored a distinct combination of H3K27ac marked regions, suggesting tissue specificity and differential regulation of CEBPA expression (Figure 2 blue profiles). Tissues which do not express CEBPA were all devoid of H3K27ac marked sites within the CEBPA-TAD (Figure 2 red profiles), except for the CEBPG promoter.39,40 Of these 14 potential enhancers, 10 located 5′ (−9 kb, −4 kb, −25 kb, −47 kb, and −64kb) and 3′ (+9 kb, +29 kb, +34 kb, +42 kb, +50 kb) of CEBPA are found within the 8 contact regions identified by 4C-seq (supplemental Figure 2). The +34-kb and the +42-kb regions were exclusively H3K27ac marked in neutrophils and monocytes. These 2 regions are located within the 21-kb large contact region that showed increased interaction in myeloid cells (Figure 1D). The +9-kb region is H3K27ac marked in all the CEBPA-expressing tissues investigated, suggesting a tissue-broad role in CEBPA regulation (Figure 2). These findings show that from a total of 14 potential enhancers located within the CEBPA-TAD, the +34-kb and +42-kb regions appear to be myeloid specific, suggesting the presence of an enhancer-rich chromatin site important for CEBPA transcriptional regulation.
The CEBPA TAD exhibits a diverse combination of active enhancers in different CEBPA+ tissues. ChIP-seq for H3K27ac conducted in terminally differentiated neutrophils and monocytes (in-house) was compared with publicly available ChIP-seq H3K27ac (www.roadmapepigenomics.org/). Superimposed H3K27ac (top; green) ChIP-seq profiles from 14 different CEBPA+ tissue types shows 14 potential enhancers situated within the CEBPA TAD at 5′ (−9, −14, −25, −47, −56, −64 kb) and at 3′ (+9, +15, +21, +29, +34, +42, +50, +55 kb). Each individual CEBPA+ tissue type (middle; blue) shows a different combinatorial set of active enhancers. CEBPA− tissue types (bottom; red) do not exhibit H3K27ac at the locus, except at CEBPG. An intergenic 8-kb hotspot (red) located within the 21-kb contact domain (gray), contains 2 potential enhancers (+34 kb and +42 kb) that are H3K27ac enriched in neutrophils and monocytes only. G.I, gastrointestinal.
The CEBPA TAD exhibits a diverse combination of active enhancers in different CEBPA+ tissues. ChIP-seq for H3K27ac conducted in terminally differentiated neutrophils and monocytes (in-house) was compared with publicly available ChIP-seq H3K27ac (www.roadmapepigenomics.org/). Superimposed H3K27ac (top; green) ChIP-seq profiles from 14 different CEBPA+ tissue types shows 14 potential enhancers situated within the CEBPA TAD at 5′ (−9, −14, −25, −47, −56, −64 kb) and at 3′ (+9, +15, +21, +29, +34, +42, +50, +55 kb). Each individual CEBPA+ tissue type (middle; blue) shows a different combinatorial set of active enhancers. CEBPA− tissue types (bottom; red) do not exhibit H3K27ac at the locus, except at CEBPG. An intergenic 8-kb hotspot (red) located within the 21-kb contact domain (gray), contains 2 potential enhancers (+34 kb and +42 kb) that are H3K27ac enriched in neutrophils and monocytes only. G.I, gastrointestinal.
The +42-kb enhancer is occupied by hematopoietic-specific transcription factors in HSPCs
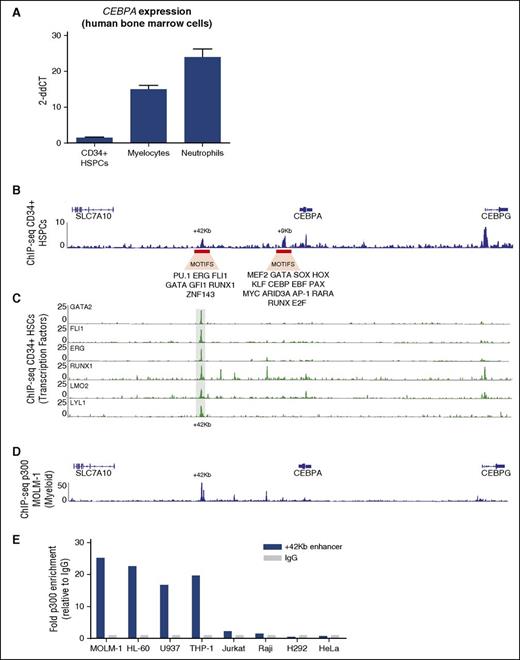
CEBPA is expressed at low levels in CD34+ progenitor cells and increases upon neutrophilic maturation (Figure 3A). The low CEBPA expression levels in CD34+ progenitor cells (Figure 3A) correlate with the number of potential enhancers found by H3K27ac ChIP-seq (ENCODE),41 that is, only the +42-kb and the +9-kb potential enhancers are active at this stage of hematopoiesis (Figure 3B). Motif analysis revealed that the +42-kb enhancer contains DNA-binding motifs (a CTCF-interacting zinc finger transcription factor42 ) and multiple HSPC-related (TFs) (supplemental Figure 3A). In contrast, the +9-kb enhancer contains DNA-binding motifs corresponding to a universal set of TFs (supplemental Figure 3A). Furthermore, the HSPC-related LTFs and other TFs including LYL11, RUNX1, GATA2, FLI1, ERG, and LMO26,43 bind the +42-kb region in CD34+ cells (Figure 3C). Recruitment of p300 to enhancers is highly suggestive of enhancer activity.44 ChIP-seq in the CEBPA+ MOLM-1 cell line demonstrated strong binding of the histone acetyltransferase p300 to the +42-kb enhancer (Figure 3D). This binding was also demonstrated by ChIP–quantitative PCR (qPCR) in the CEBPA+ myeloid cells HL-60, U937, and THP-1 (Figure 3E). No binding was found in the lymphoid cell lines Jurkat and Raji or the CEBPA+ nonhematopoietic cell lines H292 (lung) and HeLa (cervical). Together, our data show that the +42-kb enhancer is a critical region highly occupied by a HSPC-related TF complex that potentially initiates CEBPA expression in CD34+ progenitor cells.
The +42-kb region is specifically H3K27ac marked in CD34+ HSCs. (A) CEBPA mRNA expression determined by qPCR in FACS-sorted populations of normal CD34+ bone marrow cells, metamyelocytes, and neutrophils (n = 3). (B) H3K27ac ChIP-seq in CD34+ cells, obtained from GCSF-mobilized peripheral blood cells, reveals enrichment at the +9-kb and +42-kb enhancers. Motifs that correspond to specific TF-binding sites are depicted underneath each enhancer (for details, see supplemental Figure 3A). (C) ChIP-seq for the indicated transcription factors carried out in CD34+ cells shows specific binding at the +42-kb enhancer. (D) ChIP-seq for p300 in MOLM-1 CEBPA+ cell line MOLM-1 reveals the strongest interaction at +42 kb. (E) ChIP-qPCR shows p300 enrichment within the +42-kb region in the CEBPA-expressing cell lines MOLM-1, U937, HL-60, THP-1, but not in the CEBPA− hematopoietic cell lines Jurkat and Raji, CEBPA+ lung cell line H292, and CEBPA− cervical cell line HeLa. Enrichment was calculated as fold change relative to IgG control.
The +42-kb region is specifically H3K27ac marked in CD34+ HSCs. (A) CEBPA mRNA expression determined by qPCR in FACS-sorted populations of normal CD34+ bone marrow cells, metamyelocytes, and neutrophils (n = 3). (B) H3K27ac ChIP-seq in CD34+ cells, obtained from GCSF-mobilized peripheral blood cells, reveals enrichment at the +9-kb and +42-kb enhancers. Motifs that correspond to specific TF-binding sites are depicted underneath each enhancer (for details, see supplemental Figure 3A). (C) ChIP-seq for the indicated transcription factors carried out in CD34+ cells shows specific binding at the +42-kb enhancer. (D) ChIP-seq for p300 in MOLM-1 CEBPA+ cell line MOLM-1 reveals the strongest interaction at +42 kb. (E) ChIP-qPCR shows p300 enrichment within the +42-kb region in the CEBPA-expressing cell lines MOLM-1, U937, HL-60, THP-1, but not in the CEBPA− hematopoietic cell lines Jurkat and Raji, CEBPA+ lung cell line H292, and CEBPA− cervical cell line HeLa. Enrichment was calculated as fold change relative to IgG control.
The +42-kb enhancer regulates CEBPA in myeloid cells
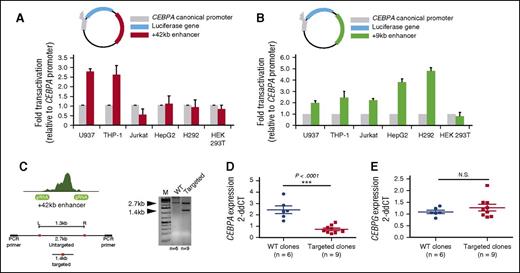
We next determined the activity of the +42-kb enhancer using luciferase reporter assays. The +42-kb enhancer was cloned into a luciferase reporter construct driven by the CEBPA promoter and its activity was investigated in different cell lines (Figure 4A). A 2.5-fold increase of luciferase activity was observed in the myeloid cell lines U937 and THP-1, compared with the luciferase-reporter driven by the CEBPA promoter only. The +42-kb enhancer was not active in nonmyeloid cell lines Jurkat, HepG2, H292, or HEK293T (Figure 4A). In contrast, the activity of the +9-kb enhancer was more general across different cell types (Figure 4B). Using CRISPR/Cas9 genome-editing technology, we next generated guide RNAs (gRNAs) flanking the TF and the p300-binding region of the +42-kb enhancer (∼800 bp) and coelectroporated them with Cas9 into the myeloid cell line THP-1. Targeted THP-1 cells generated heterozygous clones (Figure 4B), which were further tested for CEBPA expression by qPCR. Deletion of the +42-kb enhancer resulted in twofold to fourfold reduced CEBPA transcript levels as compared with wild-type (WT) controls (Figure 4C). No changes in CEBPG messenger RNA (mRNA) expression levels were observed (Figure 4D). SLC7A10, located 5′ of the 170-kb CEBPA TAD, is not expressed in THP-1 cells (data not shown). In contrast to the effects observed in THP-1 cells, deletion of the +42-kb enhancer in the Hep3B hepatocyte cell line revealed no changes in CEBPA or CEBPG expression compared with WT clones (supplemental Figure 4). These results suggest a tissue-specific role of the +42-kb enhancer in the regulation of CEBPA levels in myeloid cells.
The +42-kb enhancer is a myeloid-specific CEBPA transcriptional activator. (A-B) The +42-kb and +9-kb enhancer were cloned 3′ of a luciferase reporter gene under the control of the full canonical CEBPA promoter. Results are presented as fold change of the +42-kb enhancer in combination with the CEBPA promoter (blue = myeloid; red = lymphoid; green = CEBPA+ nonhematopoietic; orange = CEBPA− nonhematopoietic cell lines) relative to CEBPA promoter alone (gray). (C) gRNA for the CRISPR/Cas9 system were designed to flank the p300 and TF-binding sites within the +42-kb enhancer. Single-cell clones were generated and genotyped using a PCR strategy. (D-E) WT clones (n = 6) and homozygous clones (n = 9) were selected and qPCR for CEBPA mRNA expression and for CEBPG was conducted. Statistical significance to compare mRNA expression levels between WT and homozygous clones for both genes under investigation, was carried out using the 2-tailed Student’s t test. ***P < .0001; N.S., not significant.
The +42-kb enhancer is a myeloid-specific CEBPA transcriptional activator. (A-B) The +42-kb and +9-kb enhancer were cloned 3′ of a luciferase reporter gene under the control of the full canonical CEBPA promoter. Results are presented as fold change of the +42-kb enhancer in combination with the CEBPA promoter (blue = myeloid; red = lymphoid; green = CEBPA+ nonhematopoietic; orange = CEBPA− nonhematopoietic cell lines) relative to CEBPA promoter alone (gray). (C) gRNA for the CRISPR/Cas9 system were designed to flank the p300 and TF-binding sites within the +42-kb enhancer. Single-cell clones were generated and genotyped using a PCR strategy. (D-E) WT clones (n = 6) and homozygous clones (n = 9) were selected and qPCR for CEBPA mRNA expression and for CEBPG was conducted. Statistical significance to compare mRNA expression levels between WT and homozygous clones for both genes under investigation, was carried out using the 2-tailed Student’s t test. ***P < .0001; N.S., not significant.
In vivo deletion of the murine +42-kb homologous enhancer causes neutropenia
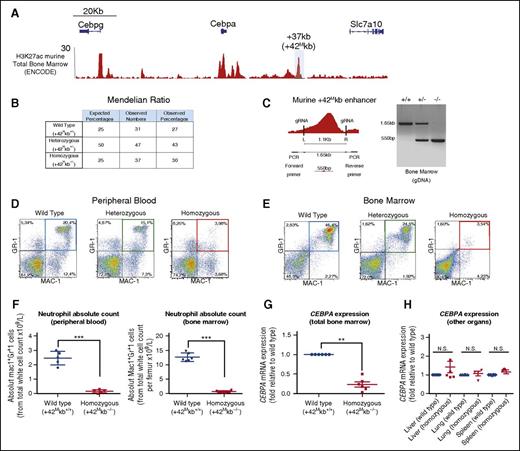
We hypothesized that deletion of the +42-kb enhancer in vivo would cause neutropenia due to a selective decrease of Cebpa levels in myeloid progenitors, leaving other Cebpa expressing organs unaffected. A region located +37 kb from the mouse Cebpa transcriptional start site shows ∼90% homology with the human +42-kb region and is H3K27ac enriched in mouse bone marrow (Figure 5A; supplemental Figure 5A; ENCODE).41 Applying CRISPR/Cas9 nickase technology, we generated 3 +37 kb (here designated +42Mkb) knockout mouse lines (supplemental Figure 5B). Genotyping confirmed germ line deletion of the enhancer in the 3 lines and revealed Mendelian distributions of WT (+42Mkb+/+), heterozygous-deleted (+42Mkb+/−), and homozygous-deleted (+42Mkb−/−) mice (Figure 5B-C). In contrast to full Cebpa knockout mice,19 homozygous +42Mkb−/− mice were viable after birth and histopathological analysis of 4- to 5-week-old mice did not reveal any major defects in lung, liver, or spleen tissue (data not shown). Flow cytometric analysis of blood and bone marrow showed a strong reduction of Mac1+Gr1+ mature neutrophils in +42Mkb−/− mice compared with age-matched +42Mkb+/− and +42Mkb+/+ control animals (Figure 5D-F). May-Grünwald staining of bone marrow cells showed the reduction of neutrophils in +42Mkb−/− mice compared with control mice (supplemental Figure 5D). It is important to note that, in line with the fact that the neutrophil count was severely reduced, ∼30% of the +42Mkb−/− mice died of bacterial infections 3 to 4 weeks after birth, as illustrated by the presence of bacteria in blood vessels of multiple tissues by histopathological analysis (supplemental Figure 5F). Other blood indices, including total white blood cell count and hemoglobin concentration revealed no differences between WT and mutant mice (supplemental Figure 5C-D). A slight increase in lymphocyte and monocyte counts was noticed, probably due to reduced space that is normally occupied by neutrophils in the bone marrow (data not shown). Cebpa transcript levels were 60% to 80% reduced in total bone marrow of +42Mkb−/− mice compared with WT control mice (Figure 5F), but no changes in expression were observed in Cebpg expression levels, although Cebpa knockout shows increase in Cebpg levels.45 No decrease of Cebpa transcript levels was observed in lung, liver, and spleen of +42Mkb−/− mice (Figure 5G).
+37-kb deleted mice (+42Mkb) show low Cebpa levels and develop neutropenia. (A) ChIP-seq H3K27ac in murine total bone marrow (ENCODE) shows multiple regions of open chromatin. A region located at +37 kb in mice is highly homologous (supplemental Figure 5A) to the human +42-kb enhancer and is H3K27ac marked. (B) Table showing Mendelian ratios. (C) PCR genotyping using primers flanking the gRNAs generate an amplicon of 1.65 kb on the intact/WT allele and an amplicon of 550 bp on the deleted/rearranged allele. (D-E) Flow cytometric analysis to distinguish neutrophils in peripheral blood or bone marrow of WT (blue), heterozygous (green), and homozygous (red) mice using the myeloid differentiation markers Mac1 and GR1. (F) Neutrophil absolute counts in peripheral blood and bone marrows of WT and homozygous mice. (G) Cebpa mRNA expression from total bone marrow obtained from WT (n = 6) or homozygous +42Mkb knockout mice (n = 6) is presented as fold change. (H) Cebpa mRNA expression from liver, lung, and spleen does not show significant changes. ***P < .0001; **P < .001; N.S., not significant.
+37-kb deleted mice (+42Mkb) show low Cebpa levels and develop neutropenia. (A) ChIP-seq H3K27ac in murine total bone marrow (ENCODE) shows multiple regions of open chromatin. A region located at +37 kb in mice is highly homologous (supplemental Figure 5A) to the human +42-kb enhancer and is H3K27ac marked. (B) Table showing Mendelian ratios. (C) PCR genotyping using primers flanking the gRNAs generate an amplicon of 1.65 kb on the intact/WT allele and an amplicon of 550 bp on the deleted/rearranged allele. (D-E) Flow cytometric analysis to distinguish neutrophils in peripheral blood or bone marrow of WT (blue), heterozygous (green), and homozygous (red) mice using the myeloid differentiation markers Mac1 and GR1. (F) Neutrophil absolute counts in peripheral blood and bone marrows of WT and homozygous mice. (G) Cebpa mRNA expression from total bone marrow obtained from WT (n = 6) or homozygous +42Mkb knockout mice (n = 6) is presented as fold change. (H) Cebpa mRNA expression from liver, lung, and spleen does not show significant changes. ***P < .0001; **P < .001; N.S., not significant.
The +42Mkb enhancer controls Cebpa expression in GMPs and CMPs
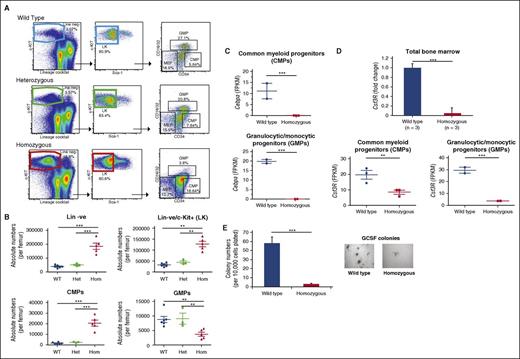
We investigated whether the reduced neutrophil numbers are preceded by a decrease in Cebpa levels in bone marrow progenitor cells. Flow cytometric analysis showed a significant reduction in absolute numbers of granulocytic/monocytic progenitors (GMPs) and a significant increase in common myeloid progenitor (CMP) numbers in the bone marrow of +42Mkb−/− mice compared with +42Mkb+/+ controls (Figure 6A-B). We performed RNA-seq on sorted progenitor fractions and observed that Cebpa levels were reduced >100-fold in CMPs and GMPs in +42Mkb−/− (n = 3) compared with +42Mkb+/+ (n = 3) mice (Figure 6C). Cebpa levels were low to absent in megakaryocytic/erythroid progenitor–sorted populations from +42Mkb+/+ and +42Mkb−/− mice (data not shown). CMPs and GMPs derived from +42Mkb+/+ and +42Mkb−/− mice also showed major differences in expression levels of myeloid-associated genes (Figure 6C; supplemental Figure 6A-B). One of these target genes is Csf3r, encoding the colony-stimulating factor receptor Csf3r, required for GMP survival and neutrophilic differentiation. Csf3r transcript levels were decreased 20-fold in total marrow, as well as in CMP and GMP fluorescence-activated cell sorter (FACS)-sorted fractions from +42Mkb−/− mice (Figure 6D). Consequently, bone marrow cells from +42Mkb−/− mice failed to form colonies in response to granulocyte colony-stimulating factor (GCSF) (Figure 6E). These data show that the enhancer is required at early stages of myeloid development and acts as a main activator of the CSF3-driven myeloid differentiation program.
Reduction in GMPs, increase in CMPs, and loss of GCSF response in +42Mkb enhancer deleted bone marrow. (A) Lineage-negative cKIT+Sca-1− (LK) cells were derived from gated c-KIT+ cells. The myeloid progenitor cell population including CMP, GMP, and MEP was characterized using CD34 and CD16/32 markers gated from LK cells. (B) Absolute numbers for lineage-negative cells, LK, CMP, and GMP cell populations were calculated from bone marrow white cell count per femur. (C) Cebpa expression measured by RNA-seq expressed as FPKM values derived for WT and homozygous mice in CMP (2wt vs 3hom) and GMP (2wt vs 2hom) sorted fractions. (D) Csf3r expression in total bone marrow by qPCRs, presented as fold change between WT (n = 3) and homozygous (n = 3) mice. RNA-seq analysis of Csf3r in FACS-sorted CMP and GMP cell populations with values expressed as FPKM. (E) Numbers of CSF3-stimulated colonies per 10 000 cells plated obtained from WT bone marrow or from +42Mkb homozygous deleted mice. Colony numbers represent the average of 3 independent experiments. Representative microphotographs of colonies show differences in sizes and numbers between WT and homozygous mice. FPKM, fragments per kilobase of transcript per million mapped reads.
Reduction in GMPs, increase in CMPs, and loss of GCSF response in +42Mkb enhancer deleted bone marrow. (A) Lineage-negative cKIT+Sca-1− (LK) cells were derived from gated c-KIT+ cells. The myeloid progenitor cell population including CMP, GMP, and MEP was characterized using CD34 and CD16/32 markers gated from LK cells. (B) Absolute numbers for lineage-negative cells, LK, CMP, and GMP cell populations were calculated from bone marrow white cell count per femur. (C) Cebpa expression measured by RNA-seq expressed as FPKM values derived for WT and homozygous mice in CMP (2wt vs 3hom) and GMP (2wt vs 2hom) sorted fractions. (D) Csf3r expression in total bone marrow by qPCRs, presented as fold change between WT (n = 3) and homozygous (n = 3) mice. RNA-seq analysis of Csf3r in FACS-sorted CMP and GMP cell populations with values expressed as FPKM. (E) Numbers of CSF3-stimulated colonies per 10 000 cells plated obtained from WT bone marrow or from +42Mkb homozygous deleted mice. Colony numbers represent the average of 3 independent experiments. Representative microphotographs of colonies show differences in sizes and numbers between WT and homozygous mice. FPKM, fragments per kilobase of transcript per million mapped reads.
Loss of HSCs and expansion of multipotent progenitors in +42Mkb−/− mice
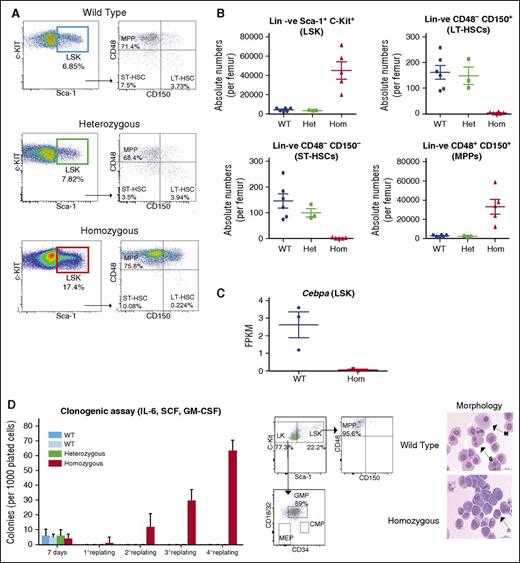
We next investigated the effects of +42Mkb enhancer deletion on the distribution of HSCs and multipotent progenitor cells (MPPs) (Figure 7B). Absolute numbers of the lin−Sca-1+c-KIT+ (LSK) cells were significantly higher in +42Mkb−/− mice than in control mice (Figure 7A-B). RNA-seq of the LSK fractions revealed that Cebpa levels were several folds lower in +42Mkb−/− (n = 3) than in +42Mkb+/+ LSK cells (n = 3) (Figure 7C). Within the LSK population, MPPs can be discriminated from short-term HSCs (ST-HSCs) and long-term HSCs (LT-HSCs) using signaling lymphocyte-activating molecule (SLAM) code CD48/CD150 markers. The lin−CD48−CD150+ LT-HSCs and lin−CD48−CD150− ST-HSCs were reduced by 10-fold to 20-fold in +42Mkb−/− mice (Figure 7A-B). These changes are in line with data from Porse and colleagues using the Mx-cre Cebpa conditional knockout model, indicating that decreased CEBP/α levels disturbs the integrity of the HSC pool.10 Conversely, a significant increase of the lin−CD48+CD150− and lin−CD48+CD150+ MPP population was observed in +42Mkb−/− mice. These data show that the enhancer activity at the HSPC stage is essential to maintain constant Cebpa levels in myeloid-primed progenitors during the course of myelopoiesis.
Loss of HSCs and expansion of multipotent progenitors in +42M kb−/− mice. (A) SLAM CD48+CD150+ markers were used to characterize cell distribution within the MPP, LT-HSC, and ST-HSC cell populations gated from lin−Sca-1+c-kit+ (LSK) cell populations. (B) Absolute cell numbers for LSK, MPP, LT-HSCs, and ST-HSCs were calculated from bone marrow white cell count per femur. (C) Cebpa expression by RNA-seq (FPKM values of WT vs homozygous mice). (D) Total bone marrow cells from WT, heterozygous, and homozygous mice were cultured in semisolid medium supplemented with IL-3, IL-6, SCF, and GM-CSF. Colonies were counted and replated every 7 days. FACS plots showing that the majority of cells grown under these conditions are mainly LK/GMP cells and, to a lesser extent, MPP/LSK cells. Morphological examination with May-Grünwald-Giemsa after 7 days distinguishes normal granulocytic and macrophage differentiation in WT cells as compared with homozygous cells that show blasts as the major cell population.
Loss of HSCs and expansion of multipotent progenitors in +42M kb−/− mice. (A) SLAM CD48+CD150+ markers were used to characterize cell distribution within the MPP, LT-HSC, and ST-HSC cell populations gated from lin−Sca-1+c-kit+ (LSK) cell populations. (B) Absolute cell numbers for LSK, MPP, LT-HSCs, and ST-HSCs were calculated from bone marrow white cell count per femur. (C) Cebpa expression by RNA-seq (FPKM values of WT vs homozygous mice). (D) Total bone marrow cells from WT, heterozygous, and homozygous mice were cultured in semisolid medium supplemented with IL-3, IL-6, SCF, and GM-CSF. Colonies were counted and replated every 7 days. FACS plots showing that the majority of cells grown under these conditions are mainly LK/GMP cells and, to a lesser extent, MPP/LSK cells. Morphological examination with May-Grünwald-Giemsa after 7 days distinguishes normal granulocytic and macrophage differentiation in WT cells as compared with homozygous cells that show blasts as the major cell population.
Sustained proliferation of +42Mkb−/− bone marrow progenitor cells
To investigate the effects of +42Mkb enhancer deletion on the proliferative behavior of bone marrow progenitors, colony cultures were carried out using a combination of interleukin-3 (IL-3), IL-6, stem cell factor (SCF), and granulocyte-macrophage colony-stimulating factor (GM-CSF). No differences in primary colony numbers were observed between +42Mkb−/−, +42Mkb+/−, or +42Mkb+/+ mice. +42Mkb−/− bone marrow cells could be serially replated, whereas +42Mkb+/− and +42MKb+/+ cells underwent exhaustion (Figure 7D). Flow cytometric analysis revealed that the majority of the replated cells from +42Mkb−/− mice expressed lin−CD48+CD150− MPP and lin−CD16/32+CD34+ GMP markers with minimal neutrophilic differentiation (Figure 7D).
Discussion
Applying functional genomics and genome editing in human hematopoietic cell lines, human bone marrow progenitors in vitro and mouse models in vivo, we show that a single, tissue-specific enhancer (1) is autonomously responsible for CEBPA expression in myeloid-primed HSCs, (2) initiates the myeloid gene expression program, and (3) is indispensable for neutrophil development.
Deletion of the +42Mkb enhancer in our model causes loss of Cebpa expression in the myeloid lineage and causes failure of the induction of complete neutrophilic differentiation. This suggests that the +42-kb enhancer initiates the myeloid program by acting as a highly occupied target region for HSC-related TFs (Figure 3) and thereby activates Cebpa.46 Upon myeloid commitment, the intergenic site between CEBPA and SLC7A10 contains multiple enhancers which become active during myeloid differentiation (Figure 2; supplemental Figure 5D), raising the question of whether these enhancers possess functional redundancy, thus, acting as shadow enhancers.47,48 We postulate that (1) the +42-kb enhancer works autonomously at the HSPC stage to induce necessary Cebpa levels, (2) followed by activation of the myeloid transcription program inducing myeloid commitment, (3) upon myeloid commitment the other enhancers become active in order to serve as a transcription activation platform49 and elevate Cebpa levels to a necessary level for terminal neutrophilic differentiation (supplemental Figure 8). We predict that upon deletion of the +42-kb enhancer the other enhancers within the locus will not become active (absence of H3K27ac) resulting in a block of differentiation.
The +42-kb enhancer deletion causes a complete lack of LT-HSCs and ST-HSCs. Therefore, the +42Mkb−/− mice behave like the previously reported Mx-Cre/Cebpa conditional knockout mice.50 In these mice, as well as in other studies,10,51 it has been demonstrated that Cebpa levels are critical to maintain HSC numbers and survival under a quiescent state. Given that only a small population of HSCs expresses Cebpa,52 it remains unclear what causes the severe loss of HSCs upon deletion of either Cebpa or the +42Mkb enhancer. The LSK fraction (including the MPPs, LT-HSCs, and ST-HSCs) shows significant reduction of Cebpa levels in the +42Mkb−/− mice, suggesting a critical role for the enhancer in Cebpa regulation in LSKs. However, given that the MPP fraction (CD48+CD150−) constitutes the majority of the LSK population, Cebpa downregulation in the LSK fraction (Figure 7B) mainly reflects Cebpa level changes in the MPP population. Given that C/EBPα negatively regulates cell cycle genes to keep a constant balance of proliferation and differentiation,53 it is possible that the block in differentiation leads to a constant demand for progenitor production, causing HSC exhaustion. Expression levels in LT-HSCs and ST-HSCs of Cebpa in the +42Mkb−/− mice are suggestive to confirm this hypothesis. In our model, the expansion of the progenitor population argues in favor of an increased progenitor state as a negative feedback mechanism to compensate for the differentiation block.
CEBPA is located in an enhancer-rich TAD and its promoter contacts 8 intergenic sites. One question to be addressed is which potential architectural proteins or protein complexes are involved in the +42-kb enhancer (or any of the other interacting enhancers) to CEBPA promoter interaction. The TAD is confined to a genomic region of 170 kb with borders demarcated by CTCF (Figure 1C), an architectural protein involved in looping interactions within and across TADs.38,54,55 CTCF also binds to the promoter of CEBPA, possibly, by forming multiple extrusions of the 5′ and 3′ interacting intergenic sites of CEBPA.56 The intergenic sites contacting CEBPA are highly enriched for H3K27ac thereby marking potential enhancers, but they lack CTCF or cohesion binding. From our motif analysis data (supplemental Figure 3), we found that the +42-kb enhancer harbors a ZNF143 DNA-binding motif (CAGCCTTCATGCATTG). ZNF143 is a zinc finger TF that associates with CTCF to allocate enhancers close to promoters and facilitate transcription regulation.42 It is therefore possible that ZNF143 has implications in initiating this interaction by binding the +42-kb enhancer to associate with CTCF on the CEBPA promoter, thus causing the +42-kb enhancer-CEBPA promoter interaction (supplemental Figure 7). To test this hypothesis, functional experiments including genome editing of the ZNF143 binding site followed by 4C-seq are required to reveal the association between ZNF143 binding and CEBPA regulation in terms of a ZNF143-dependent CEBPA promoter to enhancer interaction.
Diverse oncogenic mechanisms that affect C/EBPα expression or function were reported in various subsets of AML.13-18 Consequently, it is possible that mutations in the +42-kb enhancer could be related to transforming events. Therefore, a mutational screen of the regulatory elements of CEBPA is justified. The expansion of the MPP population in the enhancer-deleted mice suggests a preleukemic potential, which can only be confirmed by conducting serial transplantation experiments. The sustained replating of the +42Mkb MPPs (Figure 7D) are in concordance with such a preleukemic state of the cells. It is also possible that the enhancer is involved in epigenetic deregulation of the CEBPA gene in certain AMLs. Patients with a chromosomal translocation t(8;21) present with low CEBPA expression levels.14 The t(8;21) generates the AML1-ETO (ie, the RUNX1-RUNX1T1 fusion transcript) fusion protein that binds to sites that are usually bound by RUNX1. The +42-kb enhancer carries multiple RUNX1-binding sites and ChIP-seq experiments in CD34+ cells revealed that RUNX1 binds to the enhancer (Figure 3). Knockdown of RUNX1-RUNX1T1 in the Kasumi-1 cell line demonstrated a significant upregulation of CEBPA mRNA and protein levels57 but the mechanism by which this happens has not been resolved. Our data suggest that the +42-kb enhancer is a major interaction site for AML1-ETO, which may deregulate CEBPA expression. Interestingly, the transforming EVI1 protein (M.H., E.B., R.D., unpublished observation, October 2014) binds the +42-kb enhancer as well, emphasizing that further evaluation of the enhancer contribution to the pathogenesis of leukemia is warranted.
The online version of this article contains a data supplement.
The publication costs of this article were defrayed in part by page charge payment. Therefore, and solely to indicate this fact, this article is hereby marked “advertisement” in accordance with 18 USC section 1734.
Acknowledgments
The authors thank Erik Kreiter for critically reading the manuscript.
This work was supported by the Dutch Cancer Foundation (KWF) (grant no. EMCR 2013-5829), Worldwide Cancer Research (grant no. 12-1309), and the Tata Memorial Trust Foundation. H.J.G.v.d.W. was supported by a Zenith grant (93511036) from the Netherlands Genomics Initiative.
Authorship
Contribution: R.A., E.B., and R.D. conceived of and designed the study; M.R., C.G., J.P., D.B., and R.D. provided study materials or patient samples; R.A., M.H., C.E., M.A.S., R.H., H.J.G.v.d.W., E.R., K.v.L., C.G., M.R., J.P., D.B., S.E., I.T., S.G., T.K., E.B., and R.D. provided data analysis and interpretation; R.A., M.H., C.E., P.M.H.v.S., C.G., D.B., T.K., H.d.L., and E.B. carried out experiments; and R.A., E.B., I.T., and R.D. wrote the manuscript.
Conflict-of-interest disclosure: The authors declare no competing financial interests.
Correspondence: Ruud Delwel, Department of Hematology, Erasmus University Medical Center, Dr Molewaterplein 50, 3015 GE Rotterdam, The Netherlands; e-mail: h.delwel@erasmusmc.nl.

This feature is available to Subscribers Only
Sign In or Create an Account Close Modal