Key Points
T cells activated during GVHD increase their dependence upon fatty acid oxidation.
This dependence is not observed following acute activation or during normal immune reconstitution, suggesting novel therapeutic targets.
Abstract
Activated T cells require increased energy to proliferate and mediate effector functions, but the metabolic changes that occur in T cells following stimulation in vivo are poorly understood, particularly in the context of inflammation. We have previously shown that T cells activated during graft-versus-host disease (GVHD) primarily rely on oxidative phosphorylation to synthesize adenosine 5′-triphosphate. Here, we demonstrate that alloreactive effector T cells (Teff) use fatty acids (FAs) as a fuel source to support their in vivo activation. Alloreactive T cells increased FA transport, elevated levels of FA oxidation enzymes, up-regulated transcriptional coactivators to drive oxidative metabolism, and increased their rates of FA oxidation. Importantly, increases in FA transport and up-regulation of FA oxidation machinery occurred specifically in T cells during GVHD and were not seen in Teff following acute activation. Pharmacological blockade of FA oxidation decreased the survival of alloreactive T cells but did not influence the survival of T cells during normal immune reconstitution. These studies suggest that pathways controlling FA metabolism might serve as therapeutic targets to treat GVHD and other T-cell–mediated immune diseases.
Introduction
T cells undergo dramatic metabolic changes as they transform from quiescent lymphocytes to activated effector cells. They proliferate rapidly (once every 4-6 hours1,2 ), increase in size, remodel their DNA, up-regulate transcription factors and effector molecules, and increase expression of multiple cell surface proteins.3,4 These changes are driven by integrated signaling through the T-cell receptor, co-stimulatory molecules, and cytokine receptors.5
This transformation process creates intense metabolic demands, and a T cell must match the requirements of differentiation and expansion to the available nutrients. T cells activated in vitro up-regulate nutrient receptors,6,7 increase flux through energy pathways not routinely used by quiescent cells,8,9 and modify their metabolism based upon the availability of local resources.10 However, only a handful of studies have investigated metabolic changes in activated T cells in vivo,7,11-14 and even fewer studies have analyzed in vivo metabolism in the same starting population of T cells responding in different environments.
Graft-versus-host disease (GVHD) provides a well-characterized model of T-cell activation and effector function in vivo.15 T cells are first activated by antigen-presenting cells, then adopt a pathogenic effector phenotype, and finally migrate to specific target organs (skin, liver, intestine), where they damage host tissues. The presence of an identifiable effector population, in combination with ubiquitous antigen and the systemic inflammation caused by total body irradiation and/or chemotherapy, provides an ideal model to study the metabolic demands of T cells activated in vivo. Here, we first investigated metabolic changes in T cells proliferating after allogeneic bone marrow transplantation (BMT) and found an increased dependence on fatty acid (FA) oxidation. We then compared this dependence in alloreactive T cells with the metabolism in T cells activated under less inflammatory conditions or with the dependence on FA metabolism in mature T cells reconstituting the immune system in the absence of GVHD.
Methods
Mice
Female C57Bl/6 (B6), B6-Ly5.2 (CD45.1+), and C57Bl/6 × DBA2 F1 (B6D2F1) mice were purchased from Charles River Laboratories and C3H.SW, OT-I, OT-II, and CAG.OVA mice from Jackson Laboratories. Donor and recipient mice were 8 to 16 weeks of age at the time of transplantation. Animals were cared for according to protocols approved by the Guidelines for Laboratory Animal Medicine at the University of Michigan.
BMT/cellular immunization
B6D2F1 mice were conditioned with 1250 cGy total body irradiation in a split dose (137Cs source) followed by intravenous infusion of 5 × 10⁶ B6 BM cells plus 3 × 10⁶ T cells from B6-Ly-5.2 (CD45.1+) mice. T cells were enriched using positive selection with CD90.2 microbeads per the manufacturer’s instructions (Miltenyi). CAG.OVA mice were conditioned with 1000 cGy (single dose) and received 3 × 10⁶ negatively selected OT-I T cells, 2 × 10⁶ OT-II T cells, and 5 × 10⁶ T-cell depleted B6 BM cells. For GVHD against minor histocompatibility antigens, 2 models were employed. B6 mice were conditioned with 1100 cGy and received 5 × 10⁶ BM cells plus 0.5 × 10⁶ negatively selected C3H.SW CD8+ T cells. Alternatively, C3H.SW mice were conditioned with 1000 cGy and received 5 × 10⁶ B6 BM cells plus 2 × 10⁶ positively selected B6-Ly5.2 T cells. In syngeneic BMT, B6 mice received 1000 cGy, 5 × 10⁶ BM cells, and 3 × 10⁶ CD90+ B6-Ly5.2 T cells. Nonirradiated transplants were carried out as previously described.16 To track division status, donor T cells were labeled with CellTrace Violet (Invitrogen) per the manufacturer’s instructions. CellTrace labeling alone did not change baseline levels of BoDipyC1-C12 transport. Transplanted mice were housed in sterile microisolator cages and given autoclaved hyperchlorinated (pH 3.0) drinking water for 3 weeks after BMT. For cellular immunization, B6-Ly5.2 mice received 2 × 10⁶ OT-I T cells, 2 × 10⁶ OT-II T cells, and 1 day later received 1 × 10⁶ positively selected CD11c+ cells from CAG.OVA animals. Etomoxir (Sigma-Aldrich) was reconstituted in sterile phosphate-buffered saline (PBS) (5 mg/mL) and given via intraperitoneal injection either as a single dose (75 mg/kg on day +7) or alternatively every other day for 2 weeks (37.5 mg/kg) beginning on day +5. To test the effects on non-T cells and systemic metabolism, etomoxir was given at 37.5 mg/kg on days 5, 7, 9, and 11 prior to analysis on day 12. In some experiments, mice were weighed up to twice weekly, with clinical assessment performed weekly as previously described.17
Flow cytometry
Splenocytes were pressed through a 70-μM strainer to generate a single cell suspension, preincubated with 1G12 antibody to block nonspecific Fc binding, and stained with directly conjugated antibodies for 15 minutes at 4°C, followed by 2 washes (antibodies listed in supplemental Table 2 on the Blood Web site). Unless stated otherwise, all staining was performed in PBS with 2% fetal bovine serum (FBS). Intracellular FoxP3 staining was performed according to instructions from the antibody manufacturer (eBioscience). Lymphocytes were recovered from the liver by perfusing the liver with PBS and processing organs to a single cell suspension through a 70-μM cell strainer. Cell suspensions were resuspended in 40% Percoll, layered over 70% Percoll, centrifuged at 650 × g for 20 minutes without braking, and lymphocytes were recovered from the gradient interface. To measure FA uptake, cells were stained for cell surface proteins, washed twice in PBS, and resuspended in 6 μM BoDipyC1-C12 (in PBS with 20 μM FA-free BSA) for 3 minutes. BoDipy uptake was quenched by adding 4× volume of ice-cold PBS with 2% FBS and 2 washes prior to analysis. In some experiments, BoDipy uptake was blocked by preincubation with 100-μM palmitic acid (Sigma-Aldrich) for 10 minutes at 37°C prior to BoDipy addition. Intracellular staining for carnitine palmitoyl-transferase 1 (CPT1a) was performed according to the manufacturer’s instructions (Abcam, clone 8F6AE9) with secondary detection using an anti-mouse IgG2b antibody. For CPT2 staining, cells were fixed with 1.6% paraformaldehyde, incubated in 80% methanol (4°C for 60 minutes), stained with anti-CPT2 antibody, washed twice, and then incubated with anti-mouse IgG1. Apoptosis was measured with AnnexinV-488 (Invitrogen) for 15 minutes at RT in 1× Annexin staining buffer (BD Biosciences). Interferon (IFN)-γ cytokine capture was performed on day 7 samples according to the manufacturer’s instructions (Miltenyi). For cell cycle analysis, cells were incubated with Vibrant Dye Ruby (Invitrogen) at 1:500 dilution after all other staining. Flow cytometry data were captured on a FACSCanto Analyzer (BD Biosciences) and analyzed using FlowJo version 7.6.1 (Tree Star).
Lymphocyte isolation/western blot
A total of 105 cells were flow-sorted directly into 10% trichloroacetic acid (TCA)18 after gating on TCR-β+, CD45.1+, Annexin− cells (for B6 into B6D2F1 transplants) or TCR-β+, CD45-1+, CD8+, Vα2+, Annexin− cells (for OT-I studies). All flow sorting experiments were performed on a FACsAria cytometer (BD Biosciences). TCA preparations were incubated on ice for a minimum of 15 minutes, then centrifuged at 16 200 × g for 10 minutes at 4°C. Precipitates were washed twice in acetone, dried, and pellets resuspended in solubilization buffer (9 M urea, 2% Triton X-100, 1% dithiothreitol). lithium dodecyl sulfate loading buffer (Invitrogen) was added and the solubilized protein heated to 70°C for 10 minutes. Samples were separated on Bis-Trispolyacrylamide gels (Invitrogen) and transferred to PVDF membranes (Millipore). Western blotting was performed according to the Cell Signaling Technologies protocol and blots were developed with the Super Signal West Femto chemiluminescence kit (Thermo Scientific). Blots were stripped with stripping buffer (1% sodium dodecyl sulfate, 25 mM glycine, pH 2) prior to reprobing. Antibodies used for western blots are listed in supplemental Table 3. Western blots were developed using HyBlot CL film (Denville Scientific), scanned in grayscale using a HP Scanjet G4010, and cropped in Adobe Photoshop CS3 to remove empty lanes. For quantitation, scanned images were resized to contain the bands of interest and the background intensity adjusted to zero. Images were then copied into ImageJ software (version 1.44o), inverted, and band intensity quantitated in an area encompassing the largest band, followed by quantitation of subsequent bands using the same 2-dimensional area.
RNA isolation and RT-PCR
A total of 106 cells from naïve donor animals or day 7 allogeneic recipients were purified via magnetic bead sorting (as above) and processed for total RNA using an RNeasy Mini kit (Qiagen) according to the manufacturer’s instructions. RNA was quantified on an Eppendorf Biophotometer, and equal amounts of RNA were reverse transcribed using the Superscript II First Strand kit (Invitrogen) following the manufacturer’s protocol. Reverse transcription-polymerase chain reaction (RT-PCR) was performed using 8 μL cDNA (diluted 1:5 in RNase/DNAse-free H2O) on an Eppendorf Mastercyler Realplex2 with the reaction conditions of 95°C for 2 minutes, then 40 cycles at 95°C for 30 seconds, 55°C for 30 seconds, and 72°C for 30 seconds. Primers for CPT1a and β2-microglobulin are listed in supplemental Table 4.
Ex vivo FA oxidation
A total of 106 T cells from recipient mice were positively selected with CD45.1-biotinylated antibodies, followed by anti-biotin microbeads (Miltenyi, purity >95%) and plated for 6 hours in low-glucose Dulbecco’s modified Eagle medium media (1000 mg/L glucose, Invitrogen) containing 10% FBS, 15 μCi 3H-palmitate (Perkin Elmer) ±100 μM etomoxir. 3H2O was quantitated by running supernatants through a Dowex200 anion exchange column (Evergreen Scientific, Los Angeles, CA), with β-oxidation calculated as the difference in cpm between duplicate samples with or without etomoxir.19 In some cases, cells were incubated on anti-CD3, anti-CD28 coated plates (both at 2.5 μg/mL) and supernatants processed the following day.
In vivo FA oxidation
Naïve donor and allogeneic recipient animals were administered 13C-palmitate by oral gavage (0.5 g/kg, Sigma-Aldrich) and 4 hours later T cells were enriched using Pan T cell isolation kit (Miltenyi), followed by donor (CD45.1+) T-cell isolation using anti-CD45.1 fluorescein isothiocyanate-conjugated antibody and anti-fluorescein isothiocyanate microbeads. Purified cells were pelleted by centrifugation and immediately frozen on dry ice. Extractions, gas chromatography, and mass spectroscopy were all performed as previously described.20,21 Enrichment in an individual isotopomer refers to the concentration of that species expressed as a molar fraction (eg, M1, M2, M3…), which represents the fraction of molecules that contain 1, 2, 3,…13C carbon substitutions (eg, M2 glutamate means glutamate substituted with 2 13C carbons). As shown in supplemental Figure 5, M2 glutamate generation (13C in the C4-C5 position) reflects catabolic oxidation of palmitate. In vivo oxidation data were prepared from 4 independent integration results with background subtraction of the natural-labeled 13C standard and its derivatizing agent.
Statistical analysis
Graphing and statistical analysis was performed using GraphPad Prism version 5.01 for Windows (San Diego, CA; www.graphpad.com). Unless noted elsewhere, bar graphs represent mean ± standard error of the mean. Unpaired two-tailed Student t test was used for statistical interpretation and P < .05 was considered statistically significant.
Results
FA transport increases in allogeneic T cells early after transplantation
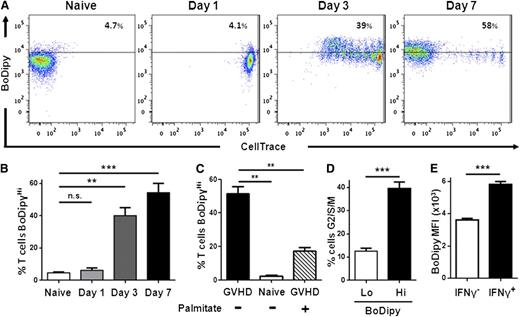
Activated T cells have the potential to oxidize a variety of different metabolic substrates, including glucose,6,10 glutamine,14,22 and FAs.7,11 We previously found that important intermediates in FA oxidation (acylcarnitines) increase in T cells during GVHD.16 To further explore the role of FA metabolism in donor T cells during GVHD, we evaluated donor cells 7 days after BMT by RT-PCR for the expression of 84 genes involved in FA metabolism.23 T cells purified from naïve donor animals (not primed or otherwise immunologically stimulated) served as a control. Throughout the study, donor animals will be referred to as “naïve,” and T cells from these animals will be referred to as “unmanipulated T cells.” Five transcripts were up-regulated >4-fold, with genes involved in the generation and transport of FAs (SLC27a2 and lipoprotein lipase) increasing the most dramatically (data not shown). To confirm increased FA transport in T cells during GVHD, we directly measured FA uptake using BoDipyC1-C12, a fluorescent FA analog. CellTrace staining alone did not change BoDipyC1-C12 uptake (supplemental Figure 1A) and FA transport did not increase before cells had divided (Figure 1A, day 1). BoDipyC1-C12 uptake increased at 4 cell divisions (day 3) and by day 7 >50% of proliferating donor T cells had increased BoDipyC1-C12 uptake, with increased uptake residing almost exclusively in the well-divided (CellTraceLo) fraction (Figure 1A-B; supplemental Figure 1B). Preincubating T cells with palmitate, an unlabeled FA, blocked BoDipy uptake, demonstrating the specificity of BoDipyC1-C12 uptake in measuring FA transport (Figure 1C). Many more BoDipyHi T cells were in the G2/S/M phase of the cell cycle than BoDipyLo T cells, demonstrating that FA transport preferentially occurred in actively proliferating cells (Figure 1D). FA transport also correlated with effector function as measured by IFN-γ secretion (Figure 1E), and increased BoDipyC1-C12 uptake in T cells recovered from the liver confirmed increased FA transport in T cells from GVHD target organs (supplemental Figure 2).
Allogeneic T cells increase FA transport during GVHD. (A) B6 Ly5.2 (CD45.1+) donor T cells were loaded with CellTrace violet and transferred to irradiated B6D2F1 mice as described in “Methods.” Cells were recovered 1, 3, or 7 days after transplantation, stained for CD45.1 and TCR-β, and assessed for BoDipyC1-C12 uptake. Unmanipulated donor cells (not labeled with CellTrace) from “naïve” mice served as controls. Plots are gated on CD45.1+, TCR-β+ cells. (B) The percentage of BoDipyHi donor T cells (n ≥ 3/group). (C) Cells were preincubated with or without palmitate followed by measurement of BoDipyC1-C12 uptake as described in “Methods.” (D) Cells were processed as in A, then stained with Vibrant Dye Ruby, and the percentage of cells in G2/S/M phase from either BoDipyLo (lower 2 quartiles) or BoDipyHi (upper quartile) populations (n = 6 mice/group) was measured. (E) Donor T cells 7 days after BMT were assessed for IFN-γ production, followed by BoDipyC1-C12 uptake. **P < .004, ***P < .0001; n.s., not significant.
Allogeneic T cells increase FA transport during GVHD. (A) B6 Ly5.2 (CD45.1+) donor T cells were loaded with CellTrace violet and transferred to irradiated B6D2F1 mice as described in “Methods.” Cells were recovered 1, 3, or 7 days after transplantation, stained for CD45.1 and TCR-β, and assessed for BoDipyC1-C12 uptake. Unmanipulated donor cells (not labeled with CellTrace) from “naïve” mice served as controls. Plots are gated on CD45.1+, TCR-β+ cells. (B) The percentage of BoDipyHi donor T cells (n ≥ 3/group). (C) Cells were preincubated with or without palmitate followed by measurement of BoDipyC1-C12 uptake as described in “Methods.” (D) Cells were processed as in A, then stained with Vibrant Dye Ruby, and the percentage of cells in G2/S/M phase from either BoDipyLo (lower 2 quartiles) or BoDipyHi (upper quartile) populations (n = 6 mice/group) was measured. (E) Donor T cells 7 days after BMT were assessed for IFN-γ production, followed by BoDipyC1-C12 uptake. **P < .004, ***P < .0001; n.s., not significant.
Allogeneic T cells increase rates of FA oxidation ex vivo and in vivo
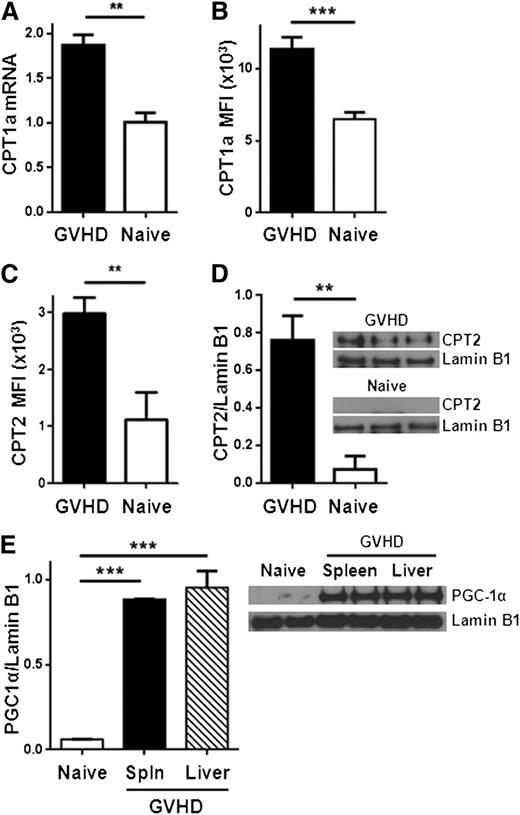
We next evaluated the potential for alloreactive T cells to oxidize FAs. Complete oxidation of FAs requires FA uptake into the cell, conversion to acylcarnitine moieties, transport of acylcarnitines into the mitochondria, decoupling of acylcarnitine back to acyl-coenzyme A (CoA) units, and entry of acyl-CoA into the 4-step β-oxidation cycle. The enzyme CPT1 is necessary to generate acylcarnitines for transport into the mitochondria, and CPT2 is required to decouple acylcarnitines back to acyl-CoA and allow carnitine to be recycled (supplemental Figure 3). Proliferating allogeneic T cells significantly up-regulated CPT1a as measured by RT-PCR and flow cytometry (Figure 2A-B). Levels of CPT2 increased similarly (Figure 2C-D; supplemental Figure 4). In addition, T cells increased protein levels of PGC-1α, a transcriptional co-activator necessary for optimal FA oxidation24-26 (Figure 2E).
Allogeneic T cells up-regulate CPT1a, CPT2, and PGC1-α during GVHD. (A) Donor T cells were flow-sorted from either naïve donor animals or allogeneic recipients 7 days after BMT (GVHD) and levels of CPT1a quantitated by RT-PCR. (B) Median fluorescence intensity (MFI) of CPT1a in T cells following intracellular staining as described in Methods. Data represent 4 to 6 mice/group. (C) Intracellular CPT2 was measured by flow cytometry (supplemental Figure 4) and the results quantitated (n = 4/group). (D) Donor T cells (CD45.1+, TCR-β+, Annexin−) were flow-sorted and cell lysates probed for CPT2 by western blot. Shown is 1 of 3 independent experiments. (E) T-cell lysates from spleen or liver were purified by flow-sorting and probed by western blot for levels of PGC1-α. Each lysate was pooled from ≥3 mice. **P < .006, ***P < .0001.
Allogeneic T cells up-regulate CPT1a, CPT2, and PGC1-α during GVHD. (A) Donor T cells were flow-sorted from either naïve donor animals or allogeneic recipients 7 days after BMT (GVHD) and levels of CPT1a quantitated by RT-PCR. (B) Median fluorescence intensity (MFI) of CPT1a in T cells following intracellular staining as described in Methods. Data represent 4 to 6 mice/group. (C) Intracellular CPT2 was measured by flow cytometry (supplemental Figure 4) and the results quantitated (n = 4/group). (D) Donor T cells (CD45.1+, TCR-β+, Annexin−) were flow-sorted and cell lysates probed for CPT2 by western blot. Shown is 1 of 3 independent experiments. (E) T-cell lysates from spleen or liver were purified by flow-sorting and probed by western blot for levels of PGC1-α. Each lysate was pooled from ≥3 mice. **P < .006, ***P < .0001.
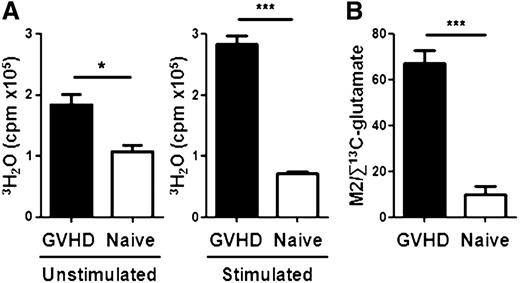
We next directly compared FA oxidation in unmanipulated donor T cells and allogeneic T cells 7 days after BMT by measuring in vitro oxidation of 3H-palmitate to 3H2O following a 6-hour incubation.19 T cells from allogeneic recipients oxidized nearly twice as much 3H-palmitate as T cells from naïve donors, and allogeneic T cells oxidized 5 times as much 3H-palmitate when stimulated overnight with plate-bound anti-CD3/CD28 antibodies (Figure 3A). We validated these results in vivo by administering 13C-palmitate and tracing metabolites containing 13C in purified donor T cells as detailed in Methods. The generation of M2-glutatmate (the glutamate isotopomer labeled in the 4,5-position with 13C) indicates increased oxidation of palmitate through the cataplerotic arm of the TCA cycle (supplemental Figure 5). Quantitation of TCA flux is therefore approximated by the ratio of M2 glutamate to glutamate labeled at any other position. Allogeneic T cells had 6-fold higher M2 glutamate ratios than unmanipulated donor T cells (Figure 3B) and converted more 13C-palmitate into the final end product, 13CO2 (supplemental Table 1). These data, together with ex vivo oxidation of 3H-palmitate by purified T cells, strongly suggest that allogeneic T cells up-regulate intrinsic lipid oxidation during GVHD.
Day 7 allogeneic T cells increase FA oxidation ex vivo and in vivo. (A) T cells were purified by magnetic separation from naïve donors or day 7 allogeneic recipients (GVHD), incubated with 3H-palmitate for 6 hours (unstimulated), and supernatants assayed for production of 3H2O as detailed in Methods. Analysis was performed in triplicate with pooled samples and represent >3 independent experiments. Stimulated samples were incubated with 3H-palmitate for 16 hours on anti-CD3, anti-CD28–coated plates. (B) Glutamate labeled in the 4,5 position with 13C (M2 glutamate) was compared with total 13C-labeled glutamate as described in Methods. *P = .02, ***P < .005.
Day 7 allogeneic T cells increase FA oxidation ex vivo and in vivo. (A) T cells were purified by magnetic separation from naïve donors or day 7 allogeneic recipients (GVHD), incubated with 3H-palmitate for 6 hours (unstimulated), and supernatants assayed for production of 3H2O as detailed in Methods. Analysis was performed in triplicate with pooled samples and represent >3 independent experiments. Stimulated samples were incubated with 3H-palmitate for 16 hours on anti-CD3, anti-CD28–coated plates. (B) Glutamate labeled in the 4,5 position with 13C (M2 glutamate) was compared with total 13C-labeled glutamate as described in Methods. *P = .02, ***P < .005.
Increased FA metabolism occurs in multiple GVHD models
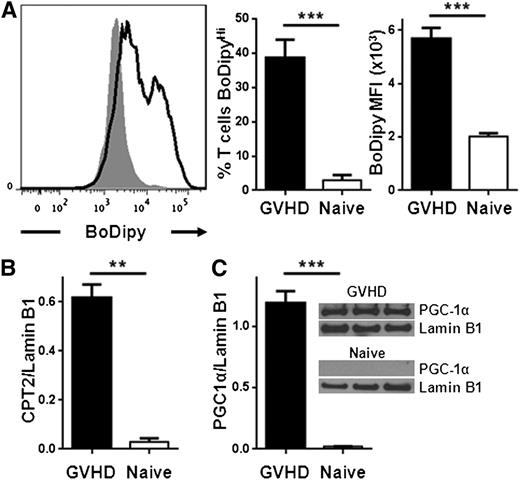
To determine if changes in FA metabolism depend on the degree of major histocompatibility complex (MHC) mismatch, we performed minor histocompatibility transplants by injecting B6 Ly5.2 T cells into irradiated C3H.SW mice as detailed in “Methods.” In this minor model, allogeneic T cells increased FA transport similarly to T cells from a major MHC-mismatched transplant (Figure 4A). Minor histocompatibility T cells also up-regulated levels of CPT2 and PGC1-α (Figure 4B-C). Thus, up-regulation of FA metabolism occurred in allogeneic T cells independent of the degree of MHC mismatch.
Allogeneic T cells from a minor histocompatibility model increase FA transport and up-regulate CPT2 and PGC1-α (A) 3 × 10⁶ B6 Ly5.2 (CD45.1+) T cells were transplanted into irradiated C3H.SW as detailed in “Methods.” BoDipyC1-C12 uptake was measured as in Figure 1, with allogeneic T cells shown in solid black line and naïve in shaded gray. The percentage of BoDipyHi cells and the MFI of BoDipy was further quantitated (n = 9 GVHD, n = 3 naïve) and represent 2 independent experiments. (B) 105 T cells from naïve donors or minor histocompatibility allogeneic recipients (GVHD) were purified by flow-sorting and cell lysates probed for CPT2 by western blotting as in Figure 2. (C) PGC-1α levels in naïve donor or day 7 allogeneic T cells. Lamin B1 served as a loading control. n = 3 mice per lane. **P < .004, ***P < .0005.
Allogeneic T cells from a minor histocompatibility model increase FA transport and up-regulate CPT2 and PGC1-α (A) 3 × 10⁶ B6 Ly5.2 (CD45.1+) T cells were transplanted into irradiated C3H.SW as detailed in “Methods.” BoDipyC1-C12 uptake was measured as in Figure 1, with allogeneic T cells shown in solid black line and naïve in shaded gray. The percentage of BoDipyHi cells and the MFI of BoDipy was further quantitated (n = 9 GVHD, n = 3 naïve) and represent 2 independent experiments. (B) 105 T cells from naïve donors or minor histocompatibility allogeneic recipients (GVHD) were purified by flow-sorting and cell lysates probed for CPT2 by western blotting as in Figure 2. (C) PGC-1α levels in naïve donor or day 7 allogeneic T cells. Lamin B1 served as a loading control. n = 3 mice per lane. **P < .004, ***P < .0005.
Increased FA uptake is specific to allogeneic T cells
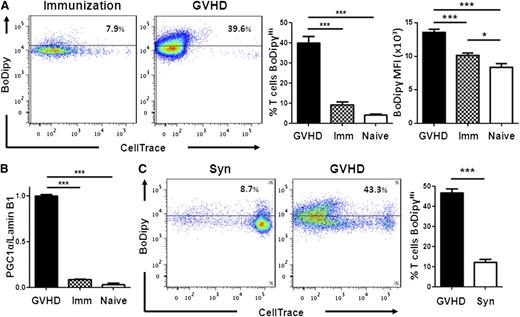
FA oxidation is necessary to develop memory CD8+ T cells11 and may play a role in generating regulatory T cells.7 The role of FA metabolism in effector T cells (Teff), however, is generally considered to be noncontributory.3,13,27 We hypothesized, based upon their increased acylcarnitine profile,16 that Teff during GVHD would be more reliant on FA oxidation than other Teff populations. We therefore compared FA metabolism in T cells activated under different conditions by transferring OT-I T cells specific for the SIINFEKL peptide of ovalbumin into naïve C57Bl/6 mice followed by immunization with CAG-OVA dendritic cells (to model acute activation) or into irradiated CAG-OVA mice expressing ovalbumin on all tissues (to model GVHD). OT-I cells proliferated well over 7 days in both environments, but only during GVHD did OT-I cells increase FA transport (Figure 5A) and selectively up-regulate PGC-1α (Figure 5B) and CPT2 (data not shown). To rule out irradiation alone as the cause of increased FA transport, we pursued a model of GVHD without irradiation (B6 Ly5.2 into B6D2F1 as detailed in “Methods”). Again, only donor T cells that had divided multiple times increased FA uptake (Figure 5C).
Teffincrease FA metabolism during GVHD but not following cellular immunization. (A) FA transport was measured in OT-I cells from naïve donors or in OT-I cells 7 days after either CAG.OVA dendritic cell immunization (Imm) or transplantation into irradiated CAG.OVA mice (GVHD), n = 4 mice/bar. (B) OT-I T cell lysates (following flow-sorting) were probed for PGC-1α levels by western blot as in Figure 2E. (C) B6 Ly5.2 (CD45.1+) splenocytes were labeled with CellTrace violet and transferred to nonirradiated B6D2F1 animals (GVHD) as described in “Methods.” On day 7, donor T cells were recovered and measured for BoDipyC1-C12 uptake. B6 Ly5.2 T cells transferred to nonirradiated C57Bl/6 animals served as controls (Syn). Bar graphs represent 4 to 5 mice/group. ***P < .007.
Teffincrease FA metabolism during GVHD but not following cellular immunization. (A) FA transport was measured in OT-I cells from naïve donors or in OT-I cells 7 days after either CAG.OVA dendritic cell immunization (Imm) or transplantation into irradiated CAG.OVA mice (GVHD), n = 4 mice/bar. (B) OT-I T cell lysates (following flow-sorting) were probed for PGC-1α levels by western blot as in Figure 2E. (C) B6 Ly5.2 (CD45.1+) splenocytes were labeled with CellTrace violet and transferred to nonirradiated B6D2F1 animals (GVHD) as described in “Methods.” On day 7, donor T cells were recovered and measured for BoDipyC1-C12 uptake. B6 Ly5.2 T cells transferred to nonirradiated C57Bl/6 animals served as controls (Syn). Bar graphs represent 4 to 5 mice/group. ***P < .007.
Inhibition of FA oxidation selectively targets well-divided, allogeneic T cells
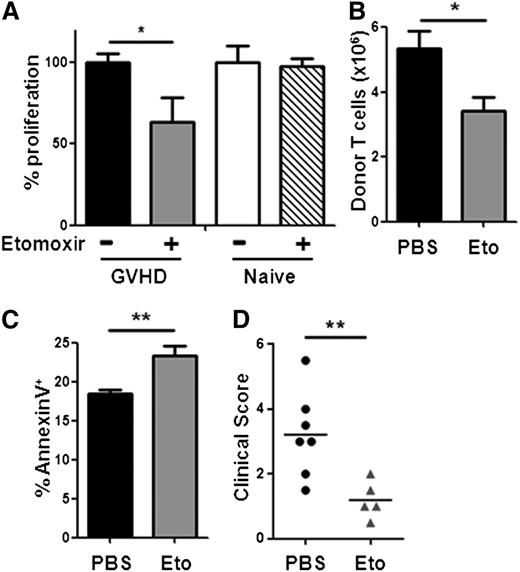
Increased FA oxidation in alloreactive T cells suggests a possible target for GVHD treatment. We tested the T-cell requirement for FA metabolism using etomoxir, a compound that blocks FA oxidation by irreversibly inhibiting CPT1.13,28 In a mixed leukocyte reaction (B6 responders and B6D2F1 stimulators), T cells from animals with GVHD proliferated significantly less in the presence of etomoxir. In contrast, T cells from naïve donors proliferated equally well regardless of etomoxir (Figure 6A). When administered in vivo, a single dose of etomoxir decreased total allogeneic T cell numbers by 40% and increased AnnexinV staining on remaining T cells (Figure 6B-C), suggesting apoptosis as the reason for the decreased cell numbers. Etomoxir treatment targeted both CD4+ and CD8+ T cells that had divided >6 times but did not affect minimally divided cells (supplemental Figure 6). Because etomoxir can function as an activator of peroxisome proliferator-activated receptor-α (PPARα), we quantitated levels of PPARα in donor T cells by western blot and observed decreased levels of PPARα in allogeneic T cells compared with unmanipulated controls (supplemental Figure 7). Two weeks of etomoxir treatment (days 5-19), during a clinically relevant minor histocompatibility model of GVHD (C3H.SW into C57Bl/6), reduced clinical scores starting on day 29 (Figure 6D). This reduction continued over the next 4 weeks (data not shown).
Blockade of FA oxidation preferentially targets well-divided, allogeneic T cells. (A) T cells were purified by magnetic separation and cultured ex vivo with B6D2F1 splenocytes with or without etomoxir as detailed in Methods. (B) Mice received a single dose of etomoxir on day 7 and total donor T-cell numbers were measured 16 hours later. (C) AnnexinV staining of donor T cells 16 hours after etomoxir treatment. (D) C57Bl/6 recipient mice were transplanted with BM and T cells from C3H.SW donor mice as detailed in “Methods.” Beginning on day +5, recipient mice received either PBS (black circles) or etomoxir (gray triangles) every other day for a total of 2 weeks. Clinical scores, as described previously,17 were measured on day 29, 10 days after the discontinuation of etomoxir. The mean clinical score is represented by a solid black line. *P = .02, **P < .01.
Blockade of FA oxidation preferentially targets well-divided, allogeneic T cells. (A) T cells were purified by magnetic separation and cultured ex vivo with B6D2F1 splenocytes with or without etomoxir as detailed in Methods. (B) Mice received a single dose of etomoxir on day 7 and total donor T-cell numbers were measured 16 hours later. (C) AnnexinV staining of donor T cells 16 hours after etomoxir treatment. (D) C57Bl/6 recipient mice were transplanted with BM and T cells from C3H.SW donor mice as detailed in “Methods.” Beginning on day +5, recipient mice received either PBS (black circles) or etomoxir (gray triangles) every other day for a total of 2 weeks. Clinical scores, as described previously,17 were measured on day 29, 10 days after the discontinuation of etomoxir. The mean clinical score is represented by a solid black line. *P = .02, **P < .01.
Given its potential clinical benefit, we further evaluated the effects of etomoxir on non-T–cell populations. Etomoxir did not decrease levels of CD80, CD86, or class II on dendritic cells (supplemental Figure 8) or change the number of regulatory T cells (supplemental Figure 9). Furthermore, etomoxir treatment did not alter systemic metabolism as assessed by serum levels of the liver enzyme aspartate aminotransferase, the liver enzyme alanine aminotransferase, or the serum levels of free FAs, total cholesterol, high-density lipoprotein, or triglycerides (supplemental Figure 10).
Mature T cells undergoing immune reconstitution do not require FA oxidation
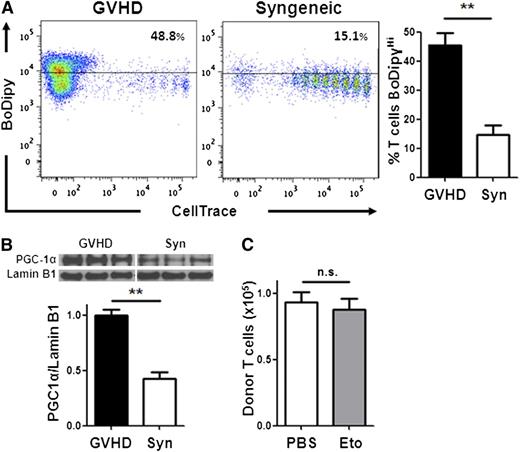
A major disadvantage of current immunosuppressive therapies is the unintended impairment of physiologic immune responses and impediment of immune reconstitution. To address the role of FA metabolism in mature T cells during immunologic reconstitution, we evaluated T-cell metabolism following syngeneic BMT, where no GVHD was present. Mature donor T cells, undergoing homeostatic proliferation, showed significantly less FA transport (Figure 7A) and up-regulated less PGC-1 protein (Figure 7B) than allogeneic T cells. In addition, etomoxir did not impair mature T-cell immune reconstitution following syngeneic BMT (Figure 7C), consistent with a decreased reliance on FA metabolism in these cells. In sum, our data show that T cells activated during GVHD selectively increased FA transport, up-regulated FA oxidation enzymes, and elevated rates of FA oxidation, whereas T cells activated by cellular immunization did not. In addition, inhibition of FA oxidation eliminated T cells proliferating robustly to alloantigen but spared mature T cells undergoing homeostatic immune reconstitution.
Homeostatic T-cell proliferation does not require FA metabolism. (A) BoDipy uptake was measured in B6 Ly5.2 donor T cells from either allogeneic (GVHD) or syngeneic (Syn) recipients as in Figure 1A. n = 3 mice/group and represent 3 independent experiments. Plots are gated on CD45.1+, TCR-β+ cells. (B) Donor T cells from allogeneic (GVHD) or syngeneic recipients were purified by flow-sorting 7 days after BMT and cell lysates probed via western blotting for PGC-1α as in Figure 2. (C) Syngeneic recipients were given a single intraperitoneal dose of PBS (white) or etomoxir (gray) 7 days post-BMT and the number of donor T cells measured 16 hours later (compare with Figure 6B). n = 8 mice/group, 1 of 2 independent experiments shown. **P < .005, n.s., not significant.
Homeostatic T-cell proliferation does not require FA metabolism. (A) BoDipy uptake was measured in B6 Ly5.2 donor T cells from either allogeneic (GVHD) or syngeneic (Syn) recipients as in Figure 1A. n = 3 mice/group and represent 3 independent experiments. Plots are gated on CD45.1+, TCR-β+ cells. (B) Donor T cells from allogeneic (GVHD) or syngeneic recipients were purified by flow-sorting 7 days after BMT and cell lysates probed via western blotting for PGC-1α as in Figure 2. (C) Syngeneic recipients were given a single intraperitoneal dose of PBS (white) or etomoxir (gray) 7 days post-BMT and the number of donor T cells measured 16 hours later (compare with Figure 6B). n = 8 mice/group, 1 of 2 independent experiments shown. **P < .005, n.s., not significant.
Discussion
Resting lymphocytes change dramatically upon activation, differentiating into effector cells that adopt metabolic phenotypes to match bioenergetic demands to the resources available. A common model of lymphocyte metabolism posits that T cells generate energy primarily through FA oxidation and oxidative metabolism when resting, whereas activated T cells generate energy predominantly through aerobic glycolysis.3,4,8 A refinement of this paradigm indicates that CD8+ memory T cells revert to FA oxidation (similar to naïve T cells), whereas CD8+ Teff do not.13 This understanding implies that the metabolic phenotype of a cell correlates with its differentiation status (Tnaive: oxidative metabolism; Teff: glycolysis; Tmem: lipid oxidation).29
The importance of oxidative metabolism in alloreactive T cells suggests that a T cell’s metabolic phenotype might also be influenced by the microenvironment present during T-cell activation, independent of differentiation status.16 To test this, we asked whether effector cells from the same precursor population adopted distinct metabolic phenotypes when activated in differing environments. Our data show that transgenic OT-I T cells responding to cellular immunization adopted the metabolic phenotype expected of an activated T cell,13 but that the same OT-I T cells up-regulated FA metabolism when activated during GVHD, similar to T cells in a nontransgenic GVHD model. Changes in other cells may also influence the subsequent T-cell metabolism. For example, accumulation of M2-glutamate in T cells could occur through processing of palmitate by an accessory cell, followed by T-cell uptake of an intermediate metabolite. In either event, the environment in which a T cell is activated determines its metabolic phenotype independently of differentiation status.
At least 3 antigen-related environmental factors might contribute to the unique oxidative profile we observe in Teff cells activated during GVHD. First, antigenic proteins are expressed throughout the host, resulting in high levels of antigenic stimulation.30,31 Second, many cells that donate antigen (eg, nonhematopoietic cells) persist for extended periods, making the presentation of antigen to T cells nearly continuous. Third, T-cell activation occurs in the setting of systemic inflammation and ongoing target tissue destruction. All 3 of these factors (and perhaps others) drive the T cell to generate ATP as efficiently as possible, with resultant adoption of oxidative metabolism. The environment of cellular immunization differs from GVHD in all 3 environmental factors, with limited amounts of antigen presented for a finite period of time with minimal amounts of systemic inflammation.
Metabolic adaptations in robustly activated T cells also illuminate unexpected pathways as potential therapeutic targets. Our data show that resting T cells, or mature T cells proliferating during normal immune reconstitution (Figure 7C), are not susceptible to inhibitors of FA oxidation, whereas T cells proliferating rapidly during GVHD are susceptible to such inhibition (Figure 6B). Inhibition also leads to clinical improvement, as evidenced by decreased clinical scores 10 days after cessation of the inhibitor. Given the small sample size (n = 5-7 mice/group), the survival advantage did not reach statistical significance in these small groups (50% vs 30%, Eto vs PBS, respectively; P = .61). However, taken together, these data suggest that the dependence on FA metabolism in allogeneic T cells not only distinguishes these cells from other activated T-cell subsets metabolically but also provides potential targets for therapeutic intervention, such as blockade of FA transport, inhibition of FA oxidation, or limitation of essential fuel sources and cofactors (eg, carnitine).
The ability of Teff to adopt different metabolic phenotypes depending on external cues emphasizes the need to understand the detailed environmental conditions present during their activation. As yet, very little is known about which conditions determine specific elements of a metabolic profile in vivo. For example, it is unclear how the metabolic phenotype of a Teff cell changes over time as the response to a stimulus evolves. Furthermore, a large portion of this study focused on metabolic programming in CD8+ T cells. CD4+ T cells also up-regulated FA transport during GVHD and were sensitive to inhibition of FA oxidation, but further analysis of their full metabolic program is needed. Finally, the relative contribution of each key environmental factor (eg, high antigen level, prolonged duration of stimulation) to the eventual metabolic phenotype remains to be elucidated, as do the signaling events and molecular mechanisms in T cells that mediate them. Investigations are in progress to identify and characterize these upstream mechanisms, which may provide further therapeutic targets for immune-mediated diseases.
The online version of this article contains a data supplement.
The publication costs of this article were defrayed in part by page charge payment. Therefore, and solely to indicate this fact, this article is hereby marked “advertisement” in accordance with 18 USC section 1734.
Acknowledgments
We thank P. Reddy and I. Maillard for critical review of this manuscript.
This work was supported by grants from the National Institutes of Health, National Cancer Institute (5PO1-CA039542) and the American Cancer Society (115947-CRP-08-224-01-LIB). C.A.B. was supported by a National Institutes of Health-sponsored Child Health Research Centers grant (5K12-HD028820).
Authorship
C.A.B. performed and designed experiments, interpreted all experiments, and wrote the paper; V.T. executed OT-I experiments, performed liver T cell isolation, and interpreted all experiments; A.W.O. conducted in vivo oxidation experiments and wrote the paper; S.G. performed all western blotting and analysis; J.S. performed RT-PCR analyses and maintained mouse strains; S.S. generated CD45.1+ OT-I mice and performed experiments; G.D.G. designed the in vivo oxidation experiments, interpreted all experiments, and wrote the paper; and J.L.M.F. designed and interpreted all experiments and wrote the paper with C.A.B.
Conflict-of-interest disclosure: A.W.O. acknowledges employment and financial interest in Lycera, Inc., a private company that has licensed technology from the University of Michigan that may have some relationship to content in this report. The remaining authors declare no competing financial interests.
Correspondence: Craig A. Byersdorfer, Department of Pediatrics, 6320 Cancer Center, 1500 East Medical Center Dr, Ann Arbor, MI 48109-5942; e-mail: craigbye@med.umich.edu.

