Abstract
Although proinflammatory and chemotactic cytokines can profoundly affect the tumor microenvironment, and many of them have been shown to have therapeutic efficacy in preclinical models, the role of these molecules in Waldenström macroglobulinemia (WM) remains poorly understood. In this study, simultaneous analysis of WM patient sera and bone marrow biopsies identified a set of dysregulated cytokines including CCL5, G-CSF, and soluble IL-2 receptor, that were significantly elevated in WM patients whereas IL-8 and EGF levels were significantly lower in these patients compared with healthy controls. Interestingly, CCL5 levels positively correlated with features of disease aggressiveness such as elevated IgM levels and bone marrow involvement. Functional analysis of tumor microenvironment revealed a functional correlation between CCL5 levels and IL-6 levels, a proinflammatory cytokine with an important role in normal and malignant B-cell biology. Furthermore, CCL5 stimulated IL-6 secretion in WM stromal cells resulting in increased IgM secretion by WM malignant cells via the JAK/STAT signaling pathway. Thus, together these results define a novel signaling network in the WM tumor microenvironment controlling IgM secretion and suggest CCL5 as a potential target for the treatment of this disease.
Introduction
Cytokines are protein mediators that are known to be involved in many biologic processes including cell growth, survival, inflammation, and differentiation.1-3 In the malignant scenario, cytokines can profoundly affect tumor cells directly as well as the surrounding microenvironment, thereby impacting tumor cell biology. Therefore, understanding the composition of the cytokine milieu, particularly in the tumor microenvironment, is an important component of our understanding of the biology of malignant transformation. Targeting cytokines has been shown to have potent therapeutic efficacy in preclinical cancer models.4,5 Despite the importance of cytokine networks in normal and disease states, only a limited number of studies have addressed the role of cytokines in the regulation of the tumor microenvironment in B-cell malignancies, and in particular, Waldenström macroglobulinemia (WM).
WM is characterized by an infiltration of lymphoplasmacytic cells in the bone marrow accompanied by a high circulating monoclonal IgM protein that often leads to serum hyperviscosity.6 Despite the introduction of multiple therapies, WM remains an incurable disease. Therefore, an understanding of the basic mechanisms underlying disease biology is fundamental to the development of novel therapies. In this study, we used a multiplex immunobead assay to simultaneously measure cytokines, chemokines, angiogenic factors, as well as growth factors and soluble receptors in the sera of WM patients and compared them with healthy donors. Our studies identify CCL5 (also known as regulated on activation, normal T-cell expressed, and secreted [RANTES]), G-CSF, and soluble IL-2 receptor α (sIL-2R/CD25) as highly expressed in WM patient sera whereas IL-8 and EGF are down-regulated. Further analysis of CCL5 found that serum CCL5 levels correlated with expression of CCL5 in the bone marrow, IgM, IL-6 and bone marrow involvement by lymphoplasmacytic cells. Further analysis of the interplay between CCL5 and IL-6 indicated that CCL5 induced IL-6 secretion by WM stromal cells and identified the JAK/STAT signaling pathway as a mediator of IgM secretion in response to IL-6 stimulation. Therefore, therapies targeting CCL5 may provide therapeutic efficacy for WM patients by reducing IL-6 secretion by stromal cells, ultimately reducing monoclonal IgM production by malignant B cells.
Methods
Cell lines and patient samples
The IgM secreting cell line BCWM.1 was a kind gift from Dr Steven Treon (Dana Farber Cancer Institute, Boston, MA).7 HS-5 stromal cells were obtained from ATCC. Saka T stromal cell line (referred to here as Saka) was a kind gift from Dr David Roodman (University of Pittsbugh, Pittsburgh, PA).8 Primary cells were isolated from patients who provided written informed consent in accordance with the Declaration of Helsinki. Bone marrow and tissue biopsy mononuclear cells were isolated as previously described.9 This study was approved by the Mayo Clinic Institutional Review Board. For B-cell isolation, total bone marrow cells were used to sort for CD19+ cells and CD138+ cells concurrently by positive selection. Cells were counted and used for experiments as indicated. For primary stromal cell cultures, 20 million CD19−CD138− cells were cultured in 100 mm tissue culture plates in RPMI containing 10% FBS and antibiotics. Nonadherent cells were washed after 3 days and adherent stromal cells were cultured until monolayers were confluent. Multiple plates were generated for each patient depending on the number of cells available after B-cell sorting. Serum samples were obtained from WM patients who provided written informed consent (n = 40). Serum samples from healthy donors (n = 24) were used as controls. Mononuclear cells from bone marrow aspirates and bone marrow plasma samples were obtained from WM patients who provided written informed consent (n = 60).
Multiplex-bead array assay
The human Cytokine 30-Plex-assay kit was purchased from Invitrogen. The kit comprises specific components for the measurement of human IL-1β, IL-1RA, IL-2, IL-2R, IL-4, IL-5, IL6, IL-7, IL-8, IL-10, IL-12p40/p70, IL-13, IL-15, Il-17, TNFα, IFNα, IFN-γ, GM-CSF, MIP-1α, MIP-1β, IP-10, MIG, Eotaxin, CCL5, MCP-1, VEGF, G-CSF, EGF, FGF-basic, and HGF. Lyophilized standards were reconstituted with kit Assay Diluent and combined to 1 mL for stock solution and serially diluted to generate standard curves for each cytokine. Samples were diluted with Assay Diluent and assay performed in a 96-well filter plate using the kit's components. The assay was performed according to the protocol provided with kit. The resulting raw data were collected using the Luminex-100 system (Luminex) and analyzed using StarStation Version 1.8 software (Applied Cytometry).
Flow cytometry
For the detection of CCR1, CCR3, and CCR5, cells (0.5 × 10⁶) were washed in PBS containing 0.5% BSA and 0.05% sodium azide and incubated with fluorochrome-conjugated antibodies or isotype controls (as indicated in figure legends) for 20 minutes at 4°C. Cells were then washed and data acquisition was done using a FACSCalibur. Analysis was done using FlowJo Version 6.3.4 software (TreeStar). Characterization of surface marker expression on stromal cells was performed as for CCR. Antibodies toward the following receptors were used: CD14, CD16, CD18, CD31, CD33, CD34, CD38, CD44, CD45, CD54, CD59, CD61, CD105, CD138, CD146, CD154, HLA-DR, VEGFR1, VEGFR2, and VEGFR3. STAT phosphorylation was assessed in serum-starved BCWM.1 cells stimulated with 50 ng/mL IL-6 for 15 minutes. Cells were fixed (BD Phosflow Fix Buffer I; BD Biosciences) and permeabilized (BD Phosflow Perm Buffer III) according to the manufacturer's directions. Cells were then stained with AlexaFluor488 or AlexaFluor647-conjugated STAT antibodies (STATs 1-6) or isotype controls, and analyzed on a FACSCalibur. All antibodies were purchased from BD Biosciences.
RT-PCR
After sorting, total RNA was isolated from CD19+CD138+ WM cells using Trizol (Invitrogen). mRNA was reversed transcribed using Superscript III (Invitrogen). DNA was amplified with HotStarTaq polymerase (QIAGEN) and commercially available primers for CCR1, CCR3, CCR5, and actin for 30 cycles in a thermocycler set to 95°C (45 seconds), 55°C annealing (45 seconds), and 72°C extension (60 seconds). PCR products were were analyzed by 1% agarose gel electrophoresis.
Migration assay
Cells were labeled with Calcein AM (5 μg/mL; Invitrogen) and 1 × 10⁶ cells in 150 μL total volume were placed in the top chamber of an 8μM transwell insert (Costar) in triplicate and incubated at 37°C for 4 hours. One mL of media was placed in the bottom of each well either alone or containing 500 ng/mL CCL5. For positive control, 200 ng/mL CCL21 was used (data not shown). Transwells were removed and migrated cells in the lower chamber measured using a multiwell fluorescent plate reader (CytoFluor II; PerSeptive Biosystems). Fluorescently labeled cells placed in lower wells were measured and used as the denominator when calculating the percent migration.
Assessment of cell viability by annexin-V and propidium iodide double-staining
Cell lines were serum-starved overnight in RPMI supplemented with 0.5% BSA. Cells (0.25 × 10⁶ cells/mL) were seeded in 24-well plates (1 mL/well) in RPMI supplemented with 0.5% BSA. Cells were cultured in the presence/absence of CCL5 (500 ng/mL) or left untreated. After 48 hours of culture, cells were assayed for viability using 1 μg annexin V–FITC (Caltag) for 20 minutes at 4°C. Cells were washed once in annexin V binding buffer and then stained with 0.5 μg propidium iodide (PI) and immediately analyzed by flow cytometry.
Proliferation assay
Cells were cultured in 96-well flat-bottom microtiter plates (Costar) at a density of 0.25 × 10⁵ cells/mL (100 μL/well) in the presence of media alone or 500 ng/mL CCL5. Cells were cultured for 3 days at 37°C in the presence of 5% CO2. Cultures were pulsed with 1 μCi (0.037 MBq) tritiated thymidine (3H-TdR; 5.0 Ci/mmol [185 GBq/mmol] (Amersham) for 18 hours before harvesting, and 3H-TdR incorporation levels were determined using a Beckman scintillation counter (GMI).
Immunohistochemistry
Paraffin-embedded bone marrow specimens obtained from patients with WM were cut into 4-μm sections. Slides were stained with 10 μg/mL anti–human CCL5 (R&D Systems) or anti–human IL-6 (Abcam) followed by biotinylated goat anti–rabbit IgG (1:300; Dako) and streptavidin-HRP (1:300; Dako) was added to all slides for 15 minutes followed by rinsing with APK. Staining was visualized using 3,3′-diaminobenzidine (Dako Cytomation) and counterstaining with hematoxylin. All slides were observed with light microscopy (Olympus AX70, 200× aperture 0.46, 400× aperture 0.75, 600× aperture 0.80; Olympus America) with images being captured with a SPOT RT camera and software (Diagnostic Instruments). Images were prepared with Adobe Photoshop (Adobe Systems Incorporated). Bone marrow specimens stained for CCL5 were analyzed by 4 independent researchers and divided into 3 groups: Group 1, no staining; Group 2, moderate intensity staining; Group 3, high intensity staining.
ELISA
IL-6 levels were quantitated using a human IL-6 enzyme linked immunosorbent assay (ELISA; R&D Systems) following manufacturer's recommendations. CCL5 levels were quantitated used a human CCL5 ELISA (Peprotech). IgM levels were quantitated using a human IgM ELISA (Bethyl laboratories) following manufacturer recommendations. For all ELISA kits, plates were developed with Turbo TMB-ELISA (Thermo Scientific). The reaction was stopped by addition of 1 N H2SO4 and results were measured with a plate reader (Molecular Devices) and analyzed using SoftMax Pro 5.2 software.
Immunoblotting
Serum-starved BCWM.1 (0.5 × 10⁶ cells/well) were treated with recombinant IL-6 (50 ng/mL; Peprotech). At the indicated times, cells were lysed and analyzed by SDS-PAGE. Membranes were stained with pERK1/2, total Erk, pSTAT1, total STAT1, pSTAT3, and total STAT3 (Cell Signaling). The Erk inhibitor PD98059 was obtained from Invitrogen, and the JAK inhibitor I was obtained from Calbiochem.
Statistical analysis
Comparison between groups were based on tests for nominal variables; the Mann-Whitney U test or the Kruskal-Wallis test was used for continuous variables. All correlations based on categorical data were performed using a Wilcoxon rank sum t test. For all statistical tests, a signficance value of .05 was used. Analysis was performed on StatView Version 5.0 software (SAS Institute).
Results
CCL5 is elevated in the serum and bone marrow of WM patients and correlates with disease aggressiveness
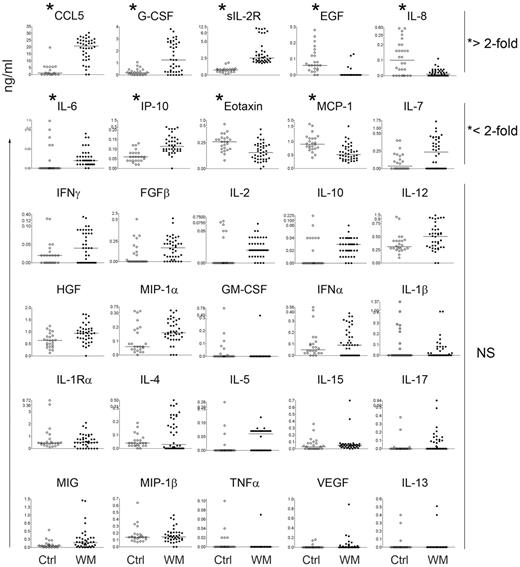
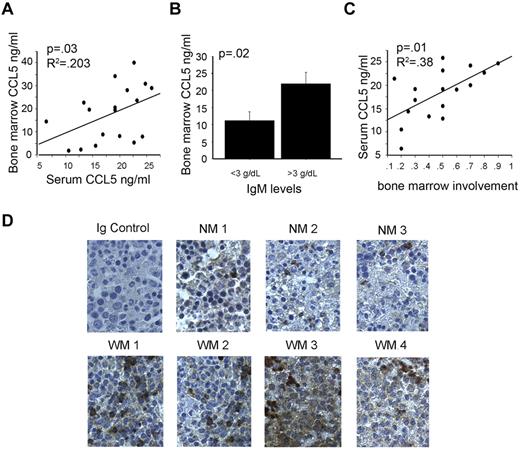
Using a multiplex bead-based array analysis we screened the serum of 40 WM patients and 24 healthy controls for 30 cytokines commonly involved in immune-cell function, and potentially, immunoglobulin production. Of the thirty cytokines screened, 5 cytokines were significantly different in WM patients compared with controls and had greater than a two-fold change in expression (Figure 1). Of these 5 cytokines, CCL5 was the most significantly elevated between patients and control subjects (P < .0001; Figure 1). Analysis of matched bone marrow plasma from 20 of 40 WM patients used for the serum cytokine screening showed that CCL5 levels in the bone marrow microenvironment correlate with CCL5 levels in the serum (Figure 2A). Furthermore, higher bone marrow levels of CCL5 were present in patients with high bone marrow IgM Levels (> 3 g/dL) compared with lower IgM levels (< 3g/dL;P = .02; Figure 2B). CCL5 and IgM levels remained significantly correlated when IgM was used as a continuous variable as well (P = .04; data not shown). In addition, serum levels of CCL5 positively correlated with the degree of bone marrow involvement by malignant cells (P = .01; Figure 2C), a defining characteristic of WM disease.10,11 To further explore the potential role of CCL5 in WM biology, we stained bone marrow biopsy specimens obtained from WM patients and healthy controls. We found that expression of CCL5 was higher in the bone marrow microenvironment from the WM patient group compared with the control group (Figure 2D). Thus, taken together, these findings identify CCL5 as a potential modulator of the WM microenvironment and suggest a role for this cytokine in the regulation of IgM secretion.
Multiplex analysis of serum cytokines in WM patient sera identifies dysregulated cytokines. Multiplex ELISA analysis screening was done on 40 WM samples (closed circles) and 24 healthy controls (open circles). Data displayed represent individual patients and the bars represent the median value (*statistically significant cytokines; P < .001).
Multiplex analysis of serum cytokines in WM patient sera identifies dysregulated cytokines. Multiplex ELISA analysis screening was done on 40 WM samples (closed circles) and 24 healthy controls (open circles). Data displayed represent individual patients and the bars represent the median value (*statistically significant cytokines; P < .001).
Elevated CCL5 expression correlates with disease activity. (A) Correlations between serum CCL5 and CCL5 in the bone marrow of patients with matched samples (n = 20). (B) Correlation between CCL5 levels in bone marrow plasma and IgM levels. (C) Correlation between CCL5 levels in serum and degree of bone marrow involvement by lymphoplasmacytic cells. (D) Immunohistochemical staining of CCL5 (brown) in bone marrow specimens of 3 healthy donors (NM1-NM3) and 4 WM patients (WM1-WM4) was performed using anti-CCL5 mAb as described in “Methods.” Images shown are original magnification ×400.
Elevated CCL5 expression correlates with disease activity. (A) Correlations between serum CCL5 and CCL5 in the bone marrow of patients with matched samples (n = 20). (B) Correlation between CCL5 levels in bone marrow plasma and IgM levels. (C) Correlation between CCL5 levels in serum and degree of bone marrow involvement by lymphoplasmacytic cells. (D) Immunohistochemical staining of CCL5 (brown) in bone marrow specimens of 3 healthy donors (NM1-NM3) and 4 WM patients (WM1-WM4) was performed using anti-CCL5 mAb as described in “Methods.” Images shown are original magnification ×400.
CCL5 has no direct effect on malignant WM cells
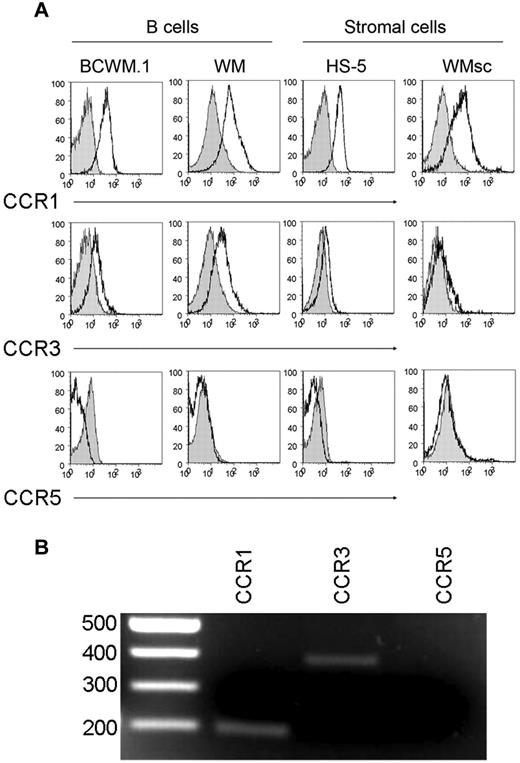
Cytokines such as CCL5 are known to serve as autocrine or paracrine growth factors for tumor cells. The increased expression of CCL5 and its correlation with IgM levels prompted us to examine the effect of CCL5 on the tumorigenic properties of WM malignant cells as well as WM stromal cells. To better characterize the WM stromal cells (WMsc) used in our experiments here, the expression levels of 20 cell surface markers were assessed on primary CD19-CD138- WMsc and compared with expression on the stromal cell lines Saka and HS-5. Similar to Saka and HS-5, WMsc were positive for the established stromal cell markers including CD44, CD54, CD59, and CD105. WMsc also highly expressed CD146 as well, which was not expressed on Saka or HS-5.12-17 WMsc were negative for expression of lymphoid and myeloid markers including CD45, CD14, CD16, CD18, CD33, CD38, and CD138. Optical analysis revealed the WMsc to have maintained a characteristic fibroblast-like morphology for the 2 passages during which the outlined experiments were performed (data not shown). We then determined whether malignant WM cells or WMsc are susceptible to the effects of CCL5. To this end, we performed FACS analysis to analyze the expression of receptors used by CCL5 on the surface of WM cells. These studies revealed that both WM B cells and WM stromal cells express CCR1 and CCR3, but not CCR5, suggesting that WM cells may be responsive to intratumoral CCL5 (Figure 3A). The expression of CCR1 and CCR3, but not CCR5, on WM stromal cells was also confirmed by RT-PCR (Figure 3B).
CCL5 receptors expressed on WM tumor cells. (A) CCL5 receptor expression (CCR1, CCR3, and CCR5) was determined by FACS analysis on BCWM.1 cells, CD19+CD138+ cells from WM patients, HS-5 cells; and primary stromal cells from WM patient by staining cells with anti-CCR1, anti-CCR3, or anti-CCR5 antibodies (white histograms); and the appropriate isotype controls (gray histograms) followed by flow cytometry analysis as described in “Methods.” This experiment was repeated 3 times with similar results. Representative histograms are shown. (B) Differential expression of mRNA in WM stromal cells. Total RNA was isolated from sorted cells and reverse transcribed. cDNA was amplified by primers for CCR1, CCR3, and CCR5. Shown is a gel from one representative donor. The expected sizes for the amplified products of CCR1, CCR3, and CCR5 are 201, 396, and 459 bp, respectively.
CCL5 receptors expressed on WM tumor cells. (A) CCL5 receptor expression (CCR1, CCR3, and CCR5) was determined by FACS analysis on BCWM.1 cells, CD19+CD138+ cells from WM patients, HS-5 cells; and primary stromal cells from WM patient by staining cells with anti-CCR1, anti-CCR3, or anti-CCR5 antibodies (white histograms); and the appropriate isotype controls (gray histograms) followed by flow cytometry analysis as described in “Methods.” This experiment was repeated 3 times with similar results. Representative histograms are shown. (B) Differential expression of mRNA in WM stromal cells. Total RNA was isolated from sorted cells and reverse transcribed. cDNA was amplified by primers for CCR1, CCR3, and CCR5. Shown is a gel from one representative donor. The expected sizes for the amplified products of CCR1, CCR3, and CCR5 are 201, 396, and 459 bp, respectively.
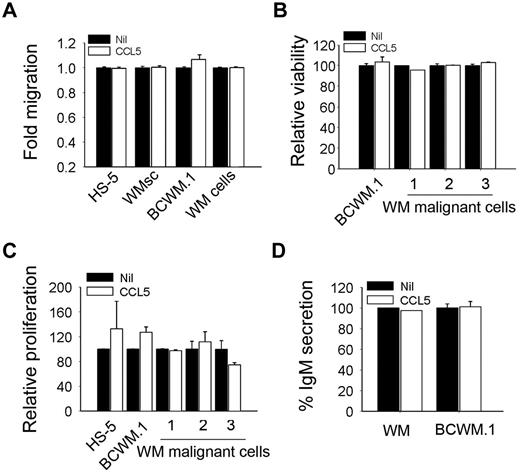
Because chemokines such as CCL5 play a pivotal role in immune cell trafficking, we then examined the ability of CCL5 to induce migration of CD19+CD138+ cells from WM patients or the IgM-secreting cell line BCWM.1. We found that CCL5 had no effect on the migration of these cells (Figure 4A). Because stromal cells in the bone marrow are an important source of cytokines and are affected by the malignant cells, we also tested the ability of CCL5 to induce migration of primary stromal cells from WM patients (WMsc) or the HS-5 stromal cell line (Figure 4A). We then examined the effect of CCL5 on the tumorigenic properties of WM malignant cells. We found that culture of BCWM.1 or CD19+CD138+ positively selected cells from bone marrow biopsy specimens obtained from WM patients in the presence of CCL5 had no effect on cell viability by annexin-V/propidium iodide staining (Figure 4B). Similarly, using a thymidine incorporation assay, we found that culture of BCWM.1 or CD19+CD138+ cells from WM patients cultured in the presence of CCL5 had no change in their growth rate (Figure 4C). Interestingly, although CCL5 levels correlated with IgM levels in WM patients, stimulation of BCWM.1 cells or CD19+CD138+ cells with CCL5 had no effect on IgM secretion (Figure 4D). The lack of a direct effect of CCL5 on malignant cells, particularly on IgM secretion, suggests that CCL5 may indirectly impact WM cells via the microenvironment.
CCL5 has no effect on cell migration, survival, and proliferation. (A) Migration ability of BCWM.1, HS-5, WMsc, and CD19+CD138+ from WM patient cells (WM cells) in response to CCL5 (500 ng/mL). Data represent fold-increased migration compared with either media alone or CCL5 as described. (B) Effect of CCL5 (500 ng/mL) on the viability of BCWM.1, HS-5, and CD19+CD138+ cells from WM patients (n = 3). Data represent cell viability in the presence of CCL5 compared with the media alone. (C) Effect of CCL5 on the proliferation of serum starved BCWM.1, HS-5, and CD19+CD138+ cells from WM patients (n = 3). Cell proliferation was assessed using thymidine incorporation and is presented as relative proliferation compared with cells cultured in the presence of media alone. (D) IgM secretion by BCWM.1 or CD19+CD138+ cells from WM patient cultured in the presence or absence of CCL5 (500 ng/mL). Values represent mean of duplicate values ± SEM.
CCL5 has no effect on cell migration, survival, and proliferation. (A) Migration ability of BCWM.1, HS-5, WMsc, and CD19+CD138+ from WM patient cells (WM cells) in response to CCL5 (500 ng/mL). Data represent fold-increased migration compared with either media alone or CCL5 as described. (B) Effect of CCL5 (500 ng/mL) on the viability of BCWM.1, HS-5, and CD19+CD138+ cells from WM patients (n = 3). Data represent cell viability in the presence of CCL5 compared with the media alone. (C) Effect of CCL5 on the proliferation of serum starved BCWM.1, HS-5, and CD19+CD138+ cells from WM patients (n = 3). Cell proliferation was assessed using thymidine incorporation and is presented as relative proliferation compared with cells cultured in the presence of media alone. (D) IgM secretion by BCWM.1 or CD19+CD138+ cells from WM patient cultured in the presence or absence of CCL5 (500 ng/mL). Values represent mean of duplicate values ± SEM.
CCL5 up-regulates IL-6 secretion by stromal cells
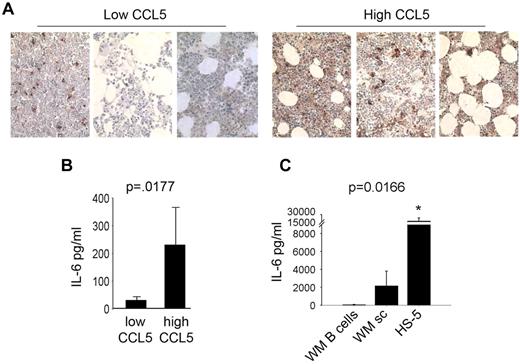
In an effort to identify a role for CCL5 in WM, we analyzed other significantly elevated cytokines in WM patient sera identified by the multiplex ELISA and found that CCL5 levels correlated with IL-6 in WM patients. To confirm this, we divided WM patients into 2 groups based on CCL5 expression in the bone marrow, one with low CCL5 staining by immunohistochemistry (IHC) and the other with high CCL5 staining by IHC, and then stained those bone marrow biopsy specimens for IL-6. We found that WM patients with low CCL5 staining had low IL-6 staining and patients with high CCL5 staining had high IL-6 staining by IHC (Figure 5A). To confirm this observation, we used bone marrow plasma from an additional 60 patients with WM and quantitated IL-6 and CCL5 levels by ELISA. Similar to the IHC data (Figure 5A), ELISA data confirmed that WM patients with low CCL5 levels (below median value) had low IL-6, and patients with high CCL5 (above median value) had high IL-6 (P < .0177; Figure 5B). Taken together, these results suggest a potential interaction between CCL5 and IL-6 in WM.
CCL5 levels correlated with IL-6 levels in WM. (A) Immunohistochemical staining for IL-6 in bone marrow biopsy specimens of 6 WM patient samples (3 with high CCL5 expression and 3 with low CCL5 expression) was performed using anti–IL-6 antibody as described in experimental procedures. Images shown are original magnification ×400. (B) Quantitative correlation of bone marrow IL-6 and CCL5 levels in bone marrow plasma samples from WM patients (n = 60). IL-6 and CCL5 levels were quantitated by ELISA as described in “Methods.” CCL5 levels were divided to high or low based on median value. (C) Average IL-6 production by HS-5 stromal cells (0.1 × 10⁶ cells/well), CD19+CD138+ cells from WM patients (0.5 × 10⁶ cells/well, n = 2 patients) and stromal cells generated from WM patients (0.1 × 10⁶ cells/well, n = 4 patients) was determined using a human IL-6 ELISA.
CCL5 levels correlated with IL-6 levels in WM. (A) Immunohistochemical staining for IL-6 in bone marrow biopsy specimens of 6 WM patient samples (3 with high CCL5 expression and 3 with low CCL5 expression) was performed using anti–IL-6 antibody as described in experimental procedures. Images shown are original magnification ×400. (B) Quantitative correlation of bone marrow IL-6 and CCL5 levels in bone marrow plasma samples from WM patients (n = 60). IL-6 and CCL5 levels were quantitated by ELISA as described in “Methods.” CCL5 levels were divided to high or low based on median value. (C) Average IL-6 production by HS-5 stromal cells (0.1 × 10⁶ cells/well), CD19+CD138+ cells from WM patients (0.5 × 10⁶ cells/well, n = 2 patients) and stromal cells generated from WM patients (0.1 × 10⁶ cells/well, n = 4 patients) was determined using a human IL-6 ELISA.
Previous data from our laboratory have suggested a role for IL-6 in WM, as immunohistochemical staining has revealed significantly higher levels of this cytokine in bone marrow specimens from patients with WM compared with healthy controls.18 Similarly, expression analysis has identified the IL-6 gene to be highly expressed by malignant WM cells.19 To validate these data, we isolated CD19+CD138+ cells from WM patients and compared their IL-6 secretion to that of WMsc. We found that malignant B cells secrete detectable, but very low levels of IL-6, whereas WMsc and stromal cell line HS-5 secreted significantly higher levels of IL-6 (P < .016; Figure 5C). This suggested that CCL5 may induce IL-6 secretion by stromal cells thereby having an indirect effect on WM cells.
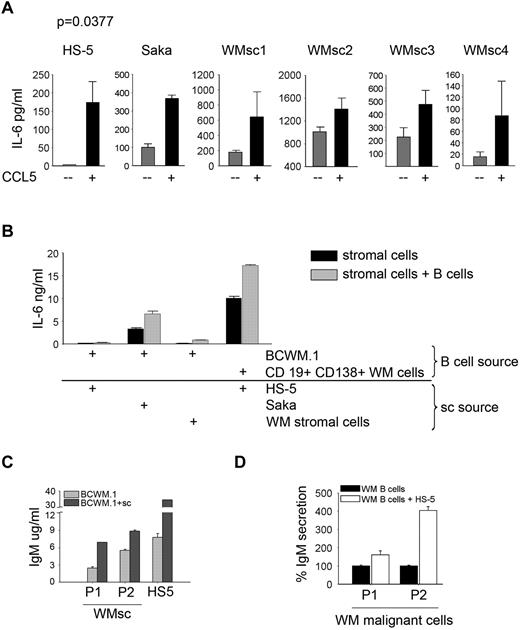
To confirm the effect of CCL5 on IL-6 secretion, we cultured WMsc as well as 2 stromal cell lines (HS-5 and Saka) in the presence or absence of CCL5, and measured the secretion of IL-6. We found that the addition of CCL5 could further stimulate IL-6 secretion in WMsc as well as HS-5 and Saka cell lines (P = .0377; Figure 6A). To determine whether CCL5 produced by malignant B cells could have a similar effect to exogenous CCL5, we cultured stromal cells in the presence of malignant cells and measured IL-6 secretion. We found that the presence of B cells could further stimulate IL-6 secretion in this coculture model system. This phenomenon was found to be true when BCWM.1 cells or CD19+CD138+ cells from WM patients were used (Figure 6B). Similar results were found when BCWM.1 cells were cultured in the presence of HS-5 or Saka cells or WMsc (Figure 6B). This increase in IL-6 secretion in the coculture wells resulted in an increase in IgM secretion by BCWM.1 cells in the presence of WMsc or HS-5 cells (Figure 6C). Similarly, when CD19+CD138+ cells were cocultured with HS-5 stromal cells, there was an increase in IgM in the culture supernatants (Figure 6D).
CCL5 induces IL-6 secretion. (A) HS-5 (0.01 × 10⁶ cells/well), Saka and stromal cells generated from WM patients (WMsc1-WMsc4; 0.1 × 10⁶ cells/well) were serum starved overnight and then cultured in the presence or absence of 500 ng/mL Rantes/CCL5 for 24 hours and IL-6 levels were determined in the culture supernatant by ELISA. (B) IL-6 secretion in coculture wells of stromal cells (0.1 × 10⁶ cells/well) and BCWM.1 or CD19+CD138+ cells from WM patients (0.5 × 10⁶ cells/well). Cells were serum starved overnight and then cocultured for 2 days, then supernatants were harvested and used to quantitate IL-6 levels by ELISA. (C) IgM secretion in coculture wells of HS-5 stromal cells or WMsc (P1 and P2; 0.1 × 10⁶ cells/well) and BCWM.1 (0.5 × 10⁶ cells/well) or (D) HS-5 cells cocultured with CD19+CD138+ cells from WM patients (P1 and P2). Cells were serum starved overnight and then cocultured for 2 days then supernatants were harvested and used to quantitate IgM levels by ELISA.
CCL5 induces IL-6 secretion. (A) HS-5 (0.01 × 10⁶ cells/well), Saka and stromal cells generated from WM patients (WMsc1-WMsc4; 0.1 × 10⁶ cells/well) were serum starved overnight and then cultured in the presence or absence of 500 ng/mL Rantes/CCL5 for 24 hours and IL-6 levels were determined in the culture supernatant by ELISA. (B) IL-6 secretion in coculture wells of stromal cells (0.1 × 10⁶ cells/well) and BCWM.1 or CD19+CD138+ cells from WM patients (0.5 × 10⁶ cells/well). Cells were serum starved overnight and then cocultured for 2 days, then supernatants were harvested and used to quantitate IL-6 levels by ELISA. (C) IgM secretion in coculture wells of HS-5 stromal cells or WMsc (P1 and P2; 0.1 × 10⁶ cells/well) and BCWM.1 (0.5 × 10⁶ cells/well) or (D) HS-5 cells cocultured with CD19+CD138+ cells from WM patients (P1 and P2). Cells were serum starved overnight and then cocultured for 2 days then supernatants were harvested and used to quantitate IgM levels by ELISA.
CCL5-induced IL-6 expression up-regulates IgM secretion in malignant cells via the JAK/STAT pathway
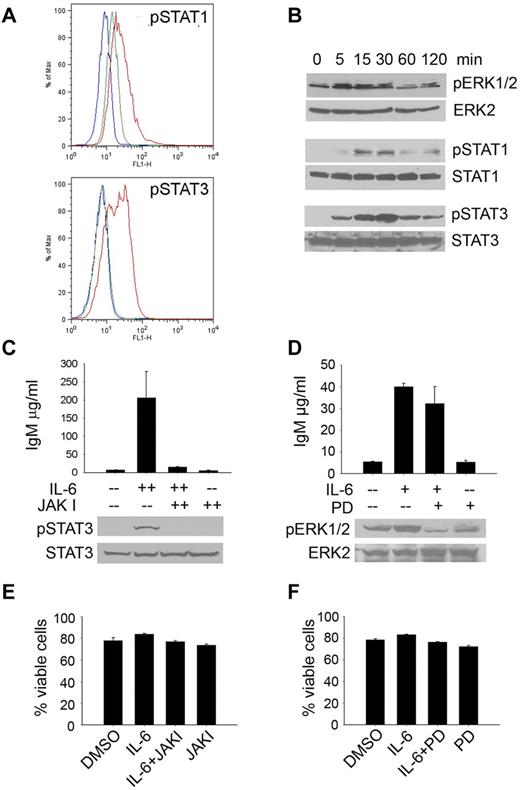
The signaling molecules responsible for mediating the downstream effects of IL-6 have been well-characterized and include members of both the JAK/STAT and the MEK/ERK pathways.20-24 To better understand the role of IL-6–mediated induction of IgM secretion in WM, we examined the activation of these signaling pathways in WM cells. Initial FACS analysis revealed significant activation of both STAT1 and STAT3 in malignant WM cells (Figure 7A), but not STATs 2, 4, 5, or 6. This finding was confirmed by Western blotting as well (Figure 7B). We also observed activation of ERK1/2 in response to IL-6 stimulation, although to a lesser extent than was observed with STATs 1 and 3. To further define the role of the JAK/STAT and MEK/ERK signaling pathways in IL-6–induced IgM secretion, we used an inhibitor of MEK (PD98059), as well as the pan-JAK inhibitor, JAKI, and determined their effects on IL-6–mediated IgM secretion in BCWM.1 cells.25-27 Consistent with previous reports implicating STAT3 in IL-6–mediated IgM secretion, data included in Figure 7C demonstrate that IL-6 induced both the activation of STAT3 and the secretion of IgM in BCWM.1 cells; effects that were abolished on the addition of JAKI.28 Conversely, although there was a decrease in the basal level as well as IL-6–induced activation of ERK1/2 on treatment with the inhibitor, blockade of MEK had a minimal effect on IL-6–induced IgM secretion by BCWM.1 cells (Figure 7D), suggesting that activation of this pathway by IL-6 may not be associated with IgM secretion. Of note, there was no difference in the viability of BCWM.1 cells in the presence of either JAKI (Figure 7E) or the MEK inhibitor (Figure 7F). Overall, these studies demonstrate that IL-6 signaling in WM promotes IgM secretion by malignant cells in a JAK/STAT-dependent manner.
IL-6 signaling induces IgM secretion. (A) BCWM.1 cells were serum-starved and treated with 50 ng/mL IL-6 for 15 minutes. After fixation and permeabilization, cells were probed for the phosphorylated forms of STATs 1-6. The blue histogram represents the isotype control; green represents baseline STAT phosphorylation in untreated BCWM.1 cells; red represents STAT phosphorylation on IL-6 stimulation. This experiment was performed 3 times, and representative histograms are shown. (B) HS-5 cells were plated in 6-well plates overnight and then serum starved overnight. Cells were then treated with 50 ng/mL IL-6 for the indicated times. Cells were then lysed and lysates used to determine activation of MAPK and JAK/STAT signaling pathways by immunoblotting. This experiment was repeated 3 times with similar results (C) IgM secretion by serum starved BCWM.1 cells cultured in the presence or absence of JAKI inhibitor (300nM) or DMSO control for 30 minutes and, then stimulated with IL-6 (50 ng/mL) for 3 days. To determine inhibition of STAT3 by JAKI inhibitor a Western blot was run with whole-cell lysates from serum starved BCWM.1 cultured in the presence of JAKI inhibitor (300nM) for 30 minutes and then treated with IL-6 (50 ng/mL) for 30 minutes. Immunoblots were repeated 2 times with similar results. (D) IgM secretion by serum starved BCWM.1 cells pretreated with or without the ERK inhibitor PD98059 (PD) or DMSO for 30 minutes and then treated with IL-6 (50 ng/mL) as indicated. Cell supernatants were harvested after 3 days and used to determine IgM secretion by ELISA. Experiments were performed twice in triplicate. Inhibition of Erk1/2 phosphorylation was confirmed by immunoblotting by culturing serum starved BCWM.1 in the presence or absence of PD inhibitor (50μM) for 30 minutes and then treated with IL-6 (50 ng/mL) for 30 minutes. Immunoblots were run twice with similar results. (E-F) Viability in the presence of either a pan-JAK (E) or MEK (F) inhibitor was assessed using annexin/propidium iodine staining. Experiments were performed 3 times. Data are presented as the average viability ± SEM.
IL-6 signaling induces IgM secretion. (A) BCWM.1 cells were serum-starved and treated with 50 ng/mL IL-6 for 15 minutes. After fixation and permeabilization, cells were probed for the phosphorylated forms of STATs 1-6. The blue histogram represents the isotype control; green represents baseline STAT phosphorylation in untreated BCWM.1 cells; red represents STAT phosphorylation on IL-6 stimulation. This experiment was performed 3 times, and representative histograms are shown. (B) HS-5 cells were plated in 6-well plates overnight and then serum starved overnight. Cells were then treated with 50 ng/mL IL-6 for the indicated times. Cells were then lysed and lysates used to determine activation of MAPK and JAK/STAT signaling pathways by immunoblotting. This experiment was repeated 3 times with similar results (C) IgM secretion by serum starved BCWM.1 cells cultured in the presence or absence of JAKI inhibitor (300nM) or DMSO control for 30 minutes and, then stimulated with IL-6 (50 ng/mL) for 3 days. To determine inhibition of STAT3 by JAKI inhibitor a Western blot was run with whole-cell lysates from serum starved BCWM.1 cultured in the presence of JAKI inhibitor (300nM) for 30 minutes and then treated with IL-6 (50 ng/mL) for 30 minutes. Immunoblots were repeated 2 times with similar results. (D) IgM secretion by serum starved BCWM.1 cells pretreated with or without the ERK inhibitor PD98059 (PD) or DMSO for 30 minutes and then treated with IL-6 (50 ng/mL) as indicated. Cell supernatants were harvested after 3 days and used to determine IgM secretion by ELISA. Experiments were performed twice in triplicate. Inhibition of Erk1/2 phosphorylation was confirmed by immunoblotting by culturing serum starved BCWM.1 in the presence or absence of PD inhibitor (50μM) for 30 minutes and then treated with IL-6 (50 ng/mL) for 30 minutes. Immunoblots were run twice with similar results. (E-F) Viability in the presence of either a pan-JAK (E) or MEK (F) inhibitor was assessed using annexin/propidium iodine staining. Experiments were performed 3 times. Data are presented as the average viability ± SEM.
Discussion
Waldenström macroglobulinemia is a B-cell neoplasm characterized by infiltration of the bone marrow with lymphoplasmacytic cells, the over production of a monoclonal IgM protein and associated symptoms such as anemia, lymphadenopathy, and serum hyperviscosity.6 Current therapies for WM rely on the use of chemotherapeutic agents often in combination with the monoclonal antibody rituximab.29-31 However, none of the currently available therapies provide a cure and although patients may initially respond to treatment, they perpetually relapse and most patients succumb to disease progression. It is therefore important to identify potential novel targets for the development of new therapies for WM patients.
In previous work, we have shown that B-cell activating factor (BAFF) promotes cell survival and proliferation, and in the presence of IL-2, IL-6, IL-10, and IL-12, BAFF increased IgM secretion.9 Despite the importance of cytokines in the malignant microenvironment, only a limited number of studies have addressed the role of cytokines in WM. Serum levels of IL-6 and its soluble receptor (sIL-6R) are elevated in a limited number of WM patients.32 Levels of MIP-1α were also found to be elevated in WM patient sera.33 Angiogenic cytokines including vascular endothelial growth factor (VEGF), VEFG-A, angiogenin, angiopoetin-1, angiopoetin-2, and basic fibroblast growth factor (bFGF) have also been studied in WM and found to be elevated in patient sera.34 In this study, we measured the levels of 30 different cytokines in sera obtained from WM patients and identified several cytokines, one of which was CCL5, that are dysregulated compared with healthy controls.
CCL5 is a chemokine capable of attracting CCR3- and CCR5- expressing cells, such as Tregs, monocytes, and natural killer cells, and is known to have broad pathologic significance in immune diseases including asthma, rheumatoid arthritis, and AIDS.35 Although the role of CCL5 in malignancy has not been well studied, a recent investigation of CCL5 in Hodgkin lymphoma revealed high expression of CCR5 on Reed-Sternberg cells, and CCL5 had a direct effect on tumor cell survival and proliferation.36 Here we have demonstrated higher serum levels of CCL5 in patients with WM than in healthy controls, and bone marrow CCL5 and IgM levels were highly related. In addition, although relatively small, the correlation between CCL5 and the degree of bone marrow involvement by lymphoplasmacytic cells was statistically significant, suggesting nearly 40% of the variability associated with bone marrow involvement could be accounted for by a patient's serum level of CCL5 (Figure 2). These findings prompted us to further investigate the role of elevated CCL5 in WM.
Our analysis revealed a correlation between CCL5 and IL-6 levels in WM patients indicating a possible interplay between the 2 cytokines. Although malignant B cells secrete detectable levels of IL-6, the majority of IL-6 in the bone marrow is produced by the stromal cells, which have a well-established role in the maintenance of many hematologic malignancies.37-40 Whereas previous studies have identified IL-1ß, TNF-alpha, and IFN-γ as potent regulators of IL-6 secretion, ours is the first study to suggest a relationship between CCL5 and IL-6.41-43 To further elucidate the effects of CCL5 on IL-6 secretion, we used a coculture system consisting of B cells and stromal cells and discovered the addition of CCL5 to this system promotes IL-6 secretion by the stromal cells. We have determined that CCL5 induces the expression of IL-6 in stromal cells through a GLI2-mediated mechanism involving the PI3K-AKT-IkB-p65 signaling pathway.44 This ultimately results in an increase in IgM secretion by the malignant B cells. As both the JAK/STAT and MEK/ERK pathways are activated in response to IL-6, we examined the role of these pathways in IL-6–mediated IgM secretion. As has been reported previously, STAT1, STAT3, and ERK1/2 were activated in a time-dependent manner after IL-6 stimulation.21,22 STAT3 phosphorylation coincided with an increase in IgM secretion, and inhibition of the JAK/STAT pathway through the addition of the pan-JAK inhibitor, JAKI, completely abolished both STAT3 activation and IgM secretion. These effects were not observed on addition of a MEK inhibitor, indicating that although both the JAK/STAT and the MEK/ERK pathways are involved in IL-6 signal transduction, JAK/STAT signaling is the major mediator of IL-6–induced IgM secretion in WM. As much of the morbidity associated with WM is because of elevated serum IgM protein, our data suggest JAK/STAT inhibitors may provide therapeutic benefit for patients with WM by reducing the secretion of this immunoglobulin.6 Interestingly, unlike reports in other malignancies, we did not observe an effect of JAKI on cellular proliferation, possibly because of the low inhibitor concentrations used in these studies.27 However, because of the ability of this inhibitor to significantly decrease IgM secretion, further preclinical studies to characterize the biologic effects of JAK/STAT inhibitors on WM cells are warranted.
In summary, we show a novel role for the chemokine CCL5 in promoting the production of IL-6 in WM. IL-6 plays an important role in the promotion of Ig secretion in normal B cells2 and IgG secretion in MM.45 In this study, we show that IL-6 also promotes IgM secretion by malignant cells in WM via the JAK/STAT signaling pathway. This study expands our understanding of the cytokine profiles in WM and identifies a novel role for CCL5 in promoting IL-6 secretion in the tumor microenvironment. Therefore, therapeutic targeting of CCL5 or IL-6 in the stromal cells may provide a useful tool to inhibit IgM secretion in WM patients. In addition, the use of JAK/STAT inhibitors may block IL-6–mediated IgM secretion by malignant cells.
The publication costs of this article were defrayed in part by page charge payment. Therefore, and solely to indicate this fact, this article is hereby marked “advertisement” in accordance with 18 USC section 1734.
Acknowledgments
This work was supported in part by grants CA92104 and CA97274 from the National Institutes of Health, the International Waldenström's Macroglobulinemia Foundation, the Schulze Center for Novel Therapeutics, the Mayo Clinic Cancer Center, and the Leukemia & Lymphoma Society Translational Research Program.
National Institutes of Health
Authorship
Contribution: S.F.E., S.M.A., A.J.N., and M.E.F.Z. designed research; S.F.E., L.L.A., and S.C.Z., performed research; D.M.G. and L.S.H. collected data; S.F.E., L.L.A., L.S.H., T.E.W., M.E.F.Z., and S.M.A. analyzed and interpreted the data; and S.F.E., L.S.H., M.E.F.Z, and S.M.A. wrote the paper with input from all authors.
Conflict-of-interest disclosure: The authors declare no competing financial interests.
Correspondence: Stephen M. Ansell, Division of Hematology and Internal Medicine, Mayo Clinic, 200 First St SW, Rochester, MN 55905; e-mail: ansell.stephen@mayo.edu.

This feature is available to Subscribers Only
Sign In or Create an Account Close Modal