Abstract
Abstract 851
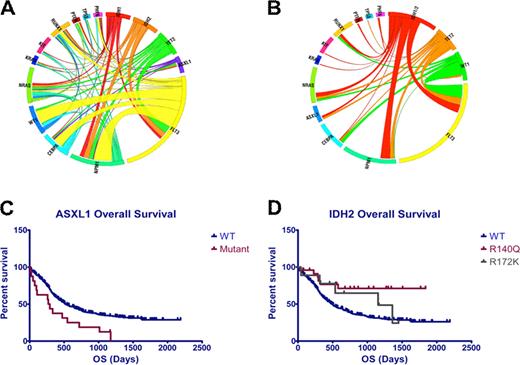
Clinical studies have demonstrated that acute myeloid leukemia (AML) is heterogeneous with respect to presentation and to clinical outcome, and many studies have shown that cytogenetics can be used to improve prognostication. More recently, it has been shown that FLT3, NPM1, and CEBPA mutations can be used to further risk stratify AML patients. Although recent studies have identified novel, recurrent somatic mutations in AML in genes including TET2, ASXL1, IDH1, IDH2, and PHF6, their prognostic value has not yet been evaluated among patients treated on a large phase III clinical trial. Here we report full-length DNA resequencing of FLT3, NPM1, CEBPA, H/K/NRAS, KIT, WT1, TET2, ASXL1, IDH1/2, TP53, RUNX1, PTEN, and PHF6 in pre-treatment genomic DNA from 398 patients with de novo AML younger than 60 years of age enrolled in the ECOG E1900 protocol. We could identify a clonal alteration, defined as a somatic mutation or cytogenetic abnormality, in 91.2% of all patients; 42% had 1 somatic alteration, 36.4% had 2 alterations, 11.3% had 3 alterations and 1.5% had 4 or more somatic alterations. Mutational Analysis: We identified somatic mutations in FLT3 (37% total; 30% ITD, 7% TKD), NPM1 (14%), CEBPA (10%), TET2 (10%), NRAS (10%), WT1 (10%), KIT (9%), IDH2 (8%), IDH1 (6%), RUNX1 (6%), ASXL1 (4%), PHF6 (3%), KRAS (2.5%), TP53 (2%), and PTEN (1.5%) (Figure 1A). We then performed correlation analysis to determine the frequency of different mutational combinations in AML patients. In addition to previously identified mutational correlations (FLT3 and NPM1, KIT and core binding factor leukemia), we found that FLT3 and ASXL1 mutations were mutually exclusive in this large cohort (p =0.0008). In addition, we found that IDH1/IDH2 mutations were mutually exclusive of both TET2 (p=0.02), and WT1 (p=0.01) mutations consistent with overlapping roles in AML pathogenesis (Figure 1B). Integration of mutational data with response data and outcome: Mutations in ASXL1 (CR rate 33.3% versus 66.5% for ASXL1-WT patients; p= 0.009) were enriched in patients who did not respond to induction chemotherapy. We found that mutations in FLT3 (p=0.0005), ASXL1 (p=0.005; Figure 1C), and PHF6 (p=0.02) were associated with reduced OS. Notably, the adverse effects of ASXL1 and PHF6 mutations on outcome were restricted to patients treated with standard dose daunorubicin (p<0.01 for each mutational cohort); ASXL1 and PHF6 mutational status did not affect outcome in patients treated with high-dose daunorubicin, demonstrating that increased intensity induction chemotherapy can improve outcomes in genetically defined poor risk AML subsets. We also found that mutations in CEBPA (p= 0.04) and in IDH2 (p=0.003) were associated with improved OS; the favorable impact of IDH2 mutations on outcome was exclusive to patients with IDH2 R140Q mutations (Figure 1D). Within the subset of patients with cytogenetically defined intermediate risk AML, we found, as expected, that FLT3-ITD mutations were associated with reduced OS and CEBPA mutations were associated with improved OS. Importantly, we found that IDH2 R140Q mutations were associated with improved OS (p=0.003) in patients with intermediate risk AML regardless of FLT3 mutational status. In contrast, TET2 mutations (P=0.0002) and PHF6 (p<0.0001) were associated with reduced OS in intermediate risk, FLT3-WT, AML. Summary: These data provide important clinical implications of genetic alterations in AML and provides insight into the multistep pathogenesis of adult AML. We identified novel mutations that impact response to induction chemotherapy and predict overall outcome, including ASXL1, PHF6, TET2 and IDH2, suggesting these mutations can be used to improve AML risk stratification and therapeutic decisions in AML patients 18–60 years of age. Most importantly, we identify TET2, IDH1/2, and WT1 mutations as mutually exclusive somatic alterations that form a novel mutational complementation group that contributes to AML pathogenesis.
A) Circos diagram depicting relative frequency and pairwise co-occurrence of mutations in de novo AML patients enrolled in the ECOG protocol E1900. B) Circos diagram showing mutational events in IDH1/2, TET2, and WT1 mutant AML patient. C) Overall survival in AML patients with and without ASXL1 mutations (p=0.005). D) Overall survival in AML patients with and without IDH2 R172 and R140 mutations (p=0.003).
A) Circos diagram depicting relative frequency and pairwise co-occurrence of mutations in de novo AML patients enrolled in the ECOG protocol E1900. B) Circos diagram showing mutational events in IDH1/2, TET2, and WT1 mutant AML patient. C) Overall survival in AML patients with and without ASXL1 mutations (p=0.005). D) Overall survival in AML patients with and without IDH2 R172 and R140 mutations (p=0.003).
No relevant conflicts of interest to declare.
Author notes
Asterisk with author names denotes non-ASH members.


This feature is available to Subscribers Only
Sign In or Create an Account Close Modal