

Pediatric acute lymphoblastic leukemia (ALL) is a malignant disease resulting from accumulation of genetic alterations. A robust technology, single nucleotide polymorphism oligonucleotide genomic microarray (SNP-chip) in concert with bioinformatics offers the opportunity to discover the genetic lesions associated with ALL. We examined 399 pediatric ALL samples and their matched remission marrows at 50 000/250 000 SNP sites using an SNP-chip platform. Correlations between genetic abnormalities and clinical features were examined. Three common genetic alterations were found: deletion of ETV6, deletion of p16INK4A, and hyperdiploidy, as well as a number of novel recurrent genetic alterations. Uniparental disomy (UPD) was a frequent event, especially affecting chromosome 9. A cohort of children with hyperdiploid ALL without gain of chromosomes 17 and 18 had a poor prognosis. Molecular allelokaryotyping is a robust tool to define small genetic abnormalities including UPD, which is usually overlooked by standard methods. This technique was able to detect subgroups with a poor prognosis based on their genetic status.
Introduction
Pediatric acute lymphoblastic leukemia (ALL) is the most common malignant disease in children.1,–3 ALL is a genetic disease resulting from accumulation of mutations of tumor suppressor genes and oncogenes.1,–3 Knowledge of these mutations can be of use for diagnosis, prognosis, and therapeutic clinical purposes, as well as to provide an overall understanding of the pathogenesis of ALL.1,–3 Identification of mutated genes in ALL has evolved with improvement in technology. A recent approach is single nucleotide polymorphism (SNP) analysis using an array-based technology4,5 that allows identification of amplifications, deletions, and allelic imbalance, such as uniparental disomy (UPD [represents the doubling of the abnormal allele due to somatic recombination or duplication and loss of the other normal allele]).6,–8 However, since this technique detects allelic dosage, it cannot detect balanced translocations
According to the HapMap publication, 9.2 million SNPs have been reported, and of these, 3.6 million have been validated.9 Global genomic distribution of SNPs and its easy adaptability for high throughput analysis make them the target of choice to look for genomic abnormalities in ALL and other cancers.5,–7
Recently, higher resolution SNP-chip (50 000-500 000 probes) has been developed for large-scale SNP typing.4,10 With a large number of SNP probes, in combination with the algorithms specifically developed for copy number calculations, these SNP-chips enable genomewide detection of copy number changes.11,12 The combination of SNP-chip technology, nucleotide sequencing, and bioinformatics allows the investigator to view the entire genome of ALL in an unbiased, comprehensive approach. Using SNP-chips, the chromosomal abnormalities can be evaluated at a very high resolution (molecular level: average distances of each probe are 47 kb and 5.8 kb in the 50 k/500 k arrays, respectively4,10 ), and allele-specific gene dosage level (gene dosage of paternal and maternal alleles) also can be analyzed in the whole genome.11,12 Hence, we name this new technology “molecular allelokaryotyping.”12 In this study, we performed molecular allelokaryotyping on a very large cohort (399) of pediatric ALL samples to examine genomic abnormalities at high resolution. Further, we examined correlations between the genomic abnormalities detected by SNP-chip and clinical features, including prognosis.
Methods
Clinical samples and DNA/RNA preparation
The ALL-BFM 2000 trial of the Berlin-Frankfurt-Münster (BFM) study group on treatment of childhood ALL enrolled patients from ages 1 year to 18 years at diagnosis.
From September 1999 to January 2002, 566 patients were consecutively enrolled in this trial. The ALL-BFM 2000 study was approved by the ethics committees of the Medical School Hanover and the Cedar Sinai Medical Center. Informed consent was obtained in accordance with the Declaration of Helsinki.
Of the 566 patients (nos. 299-854), 399 patients, representing 70% of the entire patient population, had additional DNA available and could be included in the present SNP-chip study. The 167 patients not available for this analysis did not differ from the 399 patients in this study with regard to their clinical and biological characteristics (data not shown).
Complete remission (CR) was defined as the absence of leukemia blasts in the peripheral blood and cerebrospinal fluid, fewer than 5% lymphoblasts in marrow aspiration smears, and no evidence of localized disease. At day 29, bone marrows were examined, and all patients in this SNP-chip analysis study obtained a CR at that time. The remission marrows were collected and used as matched control for the SNP-chip analysis.
Prednisone response was defined based on numbers of peripheral blood blasts per microliter on day 8, and patients were classified into good (< 1000 blasts/μL) and poor responders (≥ 1000 blasts/μL).13,–15 Relapse was defined as recurrence of lymphoblasts or localized leukemic infiltrates at any site.
DNA index, immunophenotyping, molecular analysis of chromosomal abnormalities
Leukemic or normal bone marrow cells were stained with propidium iodide, and cellular DNA contents were measured by cytometric analysis as previously reported.16,17 DNA index was defined as the DNA content of leukemic cells compared with normal G0/G1 cells. When the DNA index of leukemic cells was the same as or greater than 1.16, it was defined as hyperdiploid ALL by DNA index as previously reported.16,17
Immunophenotyping of ALL was examined using anti-CD2, -CD3, -CD4, -CD10, -CD19, and -CD20 antibodies by FACS.13,–15 ETV6/RUNX1, BCR/ABL, and MLL/AF4 were examined by interphase fluorescence in situ hybridization (FISH) analysis using specific probes and by reverse transcriptase–polymerase chain reaction (RT-PCR) using specific primers for these fusion transcripts as described previously.13,–15
Molecular allelokaryotyping of leukemic cells
DNA from the 399 ALL samples as well as their paired normal DNA from remission samples were analyzed on Affymetrix GeneChip human mapping 50 K XbaI or 250 K Nsp arrays (Affymetrix Japan, Tokyo, Japan) according to the manufacturer's protocol. Microarray data were analyzed for determination of both total and allelic-specific copy numbers using the CNAG program as previously described11,12 with minor modifications, where the status of copy numbers as well as UPD at each SNP was inferred using the algorithms based on Hidden Markov Models.11,12
For clustering of ALL samples with regard to the status of copy number changes as well as UPD, entire genome was divided into contiguous sub-blocks of 100 kb in length, and according to the inferred copy numbers (CNs) and the status of UPD, one of the 4 conditions was assigned to the ith sub-block (Si); CN gain, CN loss, normal CN, and UPD. For a given 2-copy number data, A and B, distance (d[A,B])was simply defined as
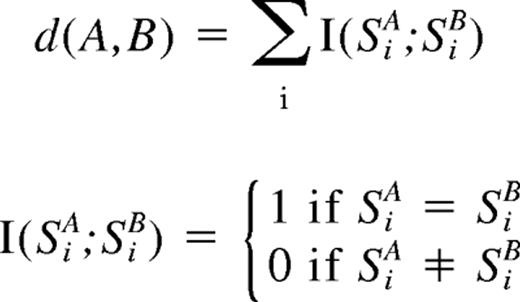
where SiA and SiB are the status of the ith sub-block (Si) in data A and B, respectively, and sum is taken for all sub-blocks. Clustering was initiated by finding a seed cluster of 2 samples showing the minimum distance and replacing them with the cluster data having the mean Si value of the two. This procedure was iteratively performed until all samples were converged to one cluster based on this distance using a program developed for this purpose (GNAGraph), which was followed by manual revisions focusing on particular genetic lesions selected by their frequencies within the sample set. CNAG and CNAGraph are available on request.
Quantitative genomic PCR and direct sequencing
Quantitative genomic PCR (qPCR) was performed on a real-time PCR machine, iCycler (Bio-Rad Laboratories, Hercules, CA) using iQ cyber-green supermix (Bio-Rad Laboratories) according to the manufacturer's protocol. Primer sequences used for the qPCR are listed in Table S2 (available on the Blood website; see the Supplemental Materials link at the top of the online article). Gene dosage at the 2p allele was used as an internal control. Allelic gene dosage of 9p and 9q was measured, and these were compared with the levels in respective matched control DNA. SNP sites were amplified and directly sequenced on Autosequencer 3000 (Applied Biosystems, Foster City, CA). Primers used for SNP site amplification are listed in Table S2. Exons 12 and 14 of JAK2 gene were amplified as previously reported.18 PCR products were purified and subjected to direct sequencing.
Data preparation
Proportional differences between groups were analyzed by either chi-squared (χ2) or Fisher exact tests. The Kaplan-Meier method was used to estimate survival rates. Differences were compared with the 2-sided log-rank test. Event-free survival (EFS) was calculated from diagnosis to the time of the first event (relapse, secondary malignancy, or death from any cause) or to the date of last follow-up.
Results
Features of samples
Clinical features of 399 pediatric ALL patients are shown in Table 1. Infant ALL (< 1years of age) were excluded from this study, and 77% (307 cases) of the patients were from 1 to 9 years old. Forty-nine cases of T-cell lineage ALL and 339 cases of B-cell lineage ALL were examined. Ninety-six samples (24%) had ETV6/RUNX1 fusion, and 6 cases had the BCR/ABL fusion gene.
Characterization of clinical features of 399 ALL cases
| Cases, no. (%) | |
|---|---|
| Sex | |
| Male | 230 (57) |
| Female | 169 (43) |
| Age | |
| 1 to 9 yrs | 307 (77) |
| Older than 10 yrs | 92 (23) |
| WBC | |
| Below 102×109/L | 362 (91) |
| Over 102×109/L | 37 (9) |
| Immunophenotype | |
| T-cell | 49 (12) |
| B-cell | 339 (85) |
| Unknown | 11 (3) |
| CNS involvement | |
| Yes | 11 (3) |
| No | 358 (90) |
| unknown | 30 (7) |
| BCR/ABL | |
| Yes | 6 (2) |
| No | 379 (95) |
| Unknown | 14 (3) |
| ETV6/RUNX1 | |
| Yes | 96 (24) |
| No | 270 (68) |
| Unknown | 33 (8) |
| PDN response | |
| Good | 360 (90) |
| Poor | 35 (9) |
| Unknown | 4 (1) |
WBC indicates white blood cell count (× 109/L) in peripheral blood at diagnosis; CNS involvement, central nervous system involvement at diagnosis; BCR/ABL and ETV6/RUNX1, BCR/ABL or ETV6/RUNX1 fusion was examined by RT-PCR and/or FISH analysis; PDN, prednisone; and PDN response, blast cell count was 1000/μL or greater in peripheral blood after a 7-day exposure to prednisone and one intrathecal dose of methotrexate.
Validation of SNP-chip data
Gene dosage, heterozygous SNPs, allele-specific gene dosage, and allelic composition (loss of heterozygosity [LOH]) was visualized as shown in Figure 1 using our novel analysis software, CNAG for SNP-chip.11,12 Duplication/amplification, deletion, and UPDs of chromosomes were easily detected (Figure 1A). To validate abnormalities found by SNP-chip, genomic quantitative PCR and direct sequencing of SNP sites at duplicated, amplified, deleted, and UPD regions were performed including chromosome 9. Representative results of validation are shown in Figure 1B-D.
![Figure 1. Result of SNP-chip analysis. (A) Results of normal and abnormal chromosomes visualized by CNAG software. Blue lines above each chromosome show total gene dosage; level 2 indicates diploid (2N) amount of DNA, which is normal. Green bars under each chromosome indicate the SNP sites showing heterozygosity in leukemic cells. When heterozygosity is not detected in the leukemic cells but is detected in matched normal controls, the result suggests that the leukemic cells have allelic imbalance (AI) in that region. Pink bars that replaced green ones suggest AI. The bottom lines (green and red lines) in each panel show allele-specific gene dosage levels (one indicates the gene dosage of paternal allele, the other indicates the gene dosage of maternal allele). Level 1 is normal for each gene dosage. (i) Pattern of normal chromosome 9. Blue line is at level 2 (2N DNA). Large number of SNP sites shows normal heterozygosity (green bars under the chromosomes), and no pink bars are detected. Allele-specific gene dosage is at level 1. Panel ii shows the pattern of whole chromosome 9 uniparental disomy (UPD) detected by SNP-chip. Total gene dosage (blue line) is normal (level 2). A number of pink bars (AI) are detected. Allele-specific gene dosage data show that one allele is deleted (level 0) and the other allele is duplicated (level 2). Panel iii shows the pattern of partial UPD. Left half shows the pattern of UPD as described above. Right half shows the pattern of a normal chromosome as described above. This case also has homozygous deletion of p16INK4A gene (see that both allele-specific dosage lines [green and red lines] and total gene dosage line [blue line] are at zero). Panel iv shows nondominant UPD. Total gene dosage (blue line) indicates 2N. Allele-specific gene dosage lines (arrows, green and red lines) on left half show that one allele (green line) is lower than normal, and the other allele (red line) is higher than normal. Allele-specific gene dosage on right half show that each allele has same level. (B-D) Validation of SNP-chip data by direct nucleotide sequencing of SNP sites and qPCR. Top panels: direct nucleotide sequencing of SNP sites in ALL samples with matched controls. ALL indicates leukemic samples; N, matched control samples. Heterozygous SNP sites are indicated by arrows. Middle panels: results of SNP-chip data (see Figure 1 legend). Bottom panels: qPCR at each chromosome location. Gene dosage levels were examined using qPCR at indicated chromosomal region. Gene dosage was determined relative to the levels at the 2p21 region. Gene dosage in leukemic cells (ALL) was compared with the matched normal control DNA (N). (B) ALL with 9p hemizygous deletion; homozygous deletion of 9p21 is also detected. (C) ALL with whole chromosome UPD. (D) ALL with 9p UPD.](/view-large/figure/6389926/zh80020811500001.jpeg)
Result of SNP-chip analysis. (A) Results of normal and abnormal chromosomes visualized by CNAG software. Blue lines above each chromosome show total gene dosage; level 2 indicates diploid (2N) amount of DNA, which is normal. Green bars under each chromosome indicate the SNP sites showing heterozygosity in leukemic cells. When heterozygosity is not detected in the leukemic cells but is detected in matched normal controls, the result suggests that the leukemic cells have allelic imbalance (AI) in that region. Pink bars that replaced green ones suggest AI. The bottom lines (green and red lines) in each panel show allele-specific gene dosage levels (one indicates the gene dosage of paternal allele, the other indicates the gene dosage of maternal allele). Level 1 is normal for each gene dosage. (i) Pattern of normal chromosome 9. Blue line is at level 2 (2N DNA). Large number of SNP sites shows normal heterozygosity (green bars under the chromosomes), and no pink bars are detected. Allele-specific gene dosage is at level 1. Panel ii shows the pattern of whole chromosome 9 uniparental disomy (UPD) detected by SNP-chip. Total gene dosage (blue line) is normal (level 2). A number of pink bars (AI) are detected. Allele-specific gene dosage data show that one allele is deleted (level 0) and the other allele is duplicated (level 2). Panel iii shows the pattern of partial UPD. Left half shows the pattern of UPD as described above. Right half shows the pattern of a normal chromosome as described above. This case also has homozygous deletion of p16INK4A gene (see that both allele-specific dosage lines [green and red lines] and total gene dosage line [blue line] are at zero). Panel iv shows nondominant UPD. Total gene dosage (blue line) indicates 2N. Allele-specific gene dosage lines (arrows, green and red lines) on left half show that one allele (green line) is lower than normal, and the other allele (red line) is higher than normal. Allele-specific gene dosage on right half show that each allele has same level. (B-D) Validation of SNP-chip data by direct nucleotide sequencing of SNP sites and qPCR. Top panels: direct nucleotide sequencing of SNP sites in ALL samples with matched controls. ALL indicates leukemic samples; N, matched control samples. Heterozygous SNP sites are indicated by arrows. Middle panels: results of SNP-chip data (see Figure 1 legend). Bottom panels: qPCR at each chromosome location. Gene dosage levels were examined using qPCR at indicated chromosomal region. Gene dosage was determined relative to the levels at the 2p21 region. Gene dosage in leukemic cells (ALL) was compared with the matched normal control DNA (N). (B) ALL with 9p hemizygous deletion; homozygous deletion of 9p21 is also detected. (C) ALL with whole chromosome UPD. (D) ALL with 9p UPD.
Result of SNP-chip analysis. (A) Results of normal and abnormal chromosomes visualized by CNAG software. Blue lines above each chromosome show total gene dosage; level 2 indicates diploid (2N) amount of DNA, which is normal. Green bars under each chromosome indicate the SNP sites showing heterozygosity in leukemic cells. When heterozygosity is not detected in the leukemic cells but is detected in matched normal controls, the result suggests that the leukemic cells have allelic imbalance (AI) in that region. Pink bars that replaced green ones suggest AI. The bottom lines (green and red lines) in each panel show allele-specific gene dosage levels (one indicates the gene dosage of paternal allele, the other indicates the gene dosage of maternal allele). Level 1 is normal for each gene dosage. (i) Pattern of normal chromosome 9. Blue line is at level 2 (2N DNA). Large number of SNP sites shows normal heterozygosity (green bars under the chromosomes), and no pink bars are detected. Allele-specific gene dosage is at level 1. Panel ii shows the pattern of whole chromosome 9 uniparental disomy (UPD) detected by SNP-chip. Total gene dosage (blue line) is normal (level 2). A number of pink bars (AI) are detected. Allele-specific gene dosage data show that one allele is deleted (level 0) and the other allele is duplicated (level 2). Panel iii shows the pattern of partial UPD. Left half shows the pattern of UPD as described above. Right half shows the pattern of a normal chromosome as described above. This case also has homozygous deletion of p16INK4A gene (see that both allele-specific dosage lines [green and red lines] and total gene dosage line [blue line] are at zero). Panel iv shows nondominant UPD. Total gene dosage (blue line) indicates 2N. Allele-specific gene dosage lines (arrows, green and red lines) on left half show that one allele (green line) is lower than normal, and the other allele (red line) is higher than normal. Allele-specific gene dosage on right half show that each allele has same level. (B-D) Validation of SNP-chip data by direct nucleotide sequencing of SNP sites and qPCR. Top panels: direct nucleotide sequencing of SNP sites in ALL samples with matched controls. ALL indicates leukemic samples; N, matched control samples. Heterozygous SNP sites are indicated by arrows. Middle panels: results of SNP-chip data (see Figure 1 legend). Bottom panels: qPCR at each chromosome location. Gene dosage levels were examined using qPCR at indicated chromosomal region. Gene dosage was determined relative to the levels at the 2p21 region. Gene dosage in leukemic cells (ALL) was compared with the matched normal control DNA (N). (B) ALL with 9p hemizygous deletion; homozygous deletion of 9p21 is also detected. (C) ALL with whole chromosome UPD. (D) ALL with 9p UPD.
Also, hyperdiploid (HD) ALL defined by DNA index and SNP-chip analysis was compared for selected cases (Table 2). Number of total chromosomes was counted manually in SNP-chip analysis, and ALL with more than 50 chromosomes was defined as HD-ALL by SNP-chip. When DNA index of leukemic cells was same as or greater than 1.16, the sample was defined as HD-ALL by DNA index.16,17 DNA index of 278 ALL samples were available, and 200 cases were defined as non-HD ALL by both methods. SNP-chip detected more cases of HD-ALL (74 cases) than DNA index. As shown in Figure 1Aiv, SNP-chip can precisely detect gene dosage, and this high sensitivity of SNP-chip analysis permitted more accurate detection of HD-ALL than by the DNA index method. Results of these analyses validated that the abnormalities detected by SNP-chip were reliable.
Detection of hyperdiploidy ALL by DNA-index and SNP-chip analysis
| SNP-chip | ||
|---|---|---|
| HD | non-HD | |
| DNA index | ||
| HD | 44 cases | 4 cases |
| non-HD | 30 cases | 200 cases |
| SNP-chip | ||
|---|---|---|
| HD | non-HD | |
| DNA index | ||
| HD | 44 cases | 4 cases |
| non-HD | 30 cases | 200 cases |
DNA index was measured by FACS as described in “DNA index, immunophenotyping, molecular analysis of chromosomal abnormalities” and DNA index of 278 ALL samples were available. Normal diploid cells have a DNA index of 1.0. When DNA index is the same as or greater than 1.16, the leukemia is defined as hyperdiploid ALL by DNA index. Hyperdiploid ALL detected by SNP-chip analysis had more than 50 chromosomes, which were counted manually.
HD indicates hyperdiploid ALL; and non-HD, nonhyperdiploid ALL.
Three common abnormalities in pediatric ALL
Figure 2A summarizes molecular allelokaryotyping profiles of the 399 ALL cases after clustering with regard to the status of copy number alterations as well as copy number neutral LOH, so-called UPD, showing a number of clusters having common genetic lesions.

Allelokaryotyping of pediatric ALL. (A) Genetic clustering of 393 ALL samples. Genetic status of each chromosomal region is visualized. Vertical axis: chromosomes, p: short arms, q: long arms. Horizontal axis: individual cases. CN: copy number of alleles. UPD: uniparental disomy. Locations of PBX1, INK4A/ARF(p16), and ETV6 genes are indicated. A rectangle indicates cases having 9p and 20q deletions. (B) Three common genomic abnormalities detected in ALL by SNP-chip analysis. Left panel: Deletion of 9p is frequently detected; the arrow indicates the commonly deleted region (CDR) where the p16INK4A gene is located. Right panel: Deletion of 12p often occurs. The arrow indicates that the CDR is where the ETV6 gene is localized. Green lines under the chromosome indicate the deleted regions in individual cases. Brown lines above the chromosome indicate the duplicated regions. Only representative cases are shown. Green and red bands on idiograms indicate centromeres and noncoding regions, respectively. Bottom panel: Venue diagram of 3 common abnormalities detected in this study. Numbers of respective cases in each category are indicated. HD: ALL with hyperdiploid (chromosomes > 50). ETV6Del: ALL with deletion of ETV6 gene. p16Del: ALL with deletion of p16INK4A gene.
Allelokaryotyping of pediatric ALL. (A) Genetic clustering of 393 ALL samples. Genetic status of each chromosomal region is visualized. Vertical axis: chromosomes, p: short arms, q: long arms. Horizontal axis: individual cases. CN: copy number of alleles. UPD: uniparental disomy. Locations of PBX1, INK4A/ARF(p16), and ETV6 genes are indicated. A rectangle indicates cases having 9p and 20q deletions. (B) Three common genomic abnormalities detected in ALL by SNP-chip analysis. Left panel: Deletion of 9p is frequently detected; the arrow indicates the commonly deleted region (CDR) where the p16INK4A gene is located. Right panel: Deletion of 12p often occurs. The arrow indicates that the CDR is where the ETV6 gene is localized. Green lines under the chromosome indicate the deleted regions in individual cases. Brown lines above the chromosome indicate the duplicated regions. Only representative cases are shown. Green and red bands on idiograms indicate centromeres and noncoding regions, respectively. Bottom panel: Venue diagram of 3 common abnormalities detected in this study. Numbers of respective cases in each category are indicated. HD: ALL with hyperdiploid (chromosomes > 50). ETV6Del: ALL with deletion of ETV6 gene. p16Del: ALL with deletion of p16INK4A gene.
Among these clusters, 3 genetic abnormalities were frequently detected: hyperdiploidy (HD, > 50 chromosomes), deletion of the 9p region, and deletion of 12p (Figure 2A,B). The common deleted region (CDR) on 9p involved the p16INK4A gene (called p16Del, Figure 2B), and the CDR on 12p involved the ETV6 gene (called ETV6Del, Figure 2B). Concurrent abnormalities of p16Del and HD were rare (P < .001); concurrent abnormalities of ETV6Del and HD also were rare (P < .001; Figure 2B). No case had all 3 common abnormalities.
The clinical features of cases with each of these 3 genetic abnormalities were analyzed (Table 3). Individuals with p16Del-ALL frequently were older (P = .017), had higher WBC (P < .001), and T-cell lineage ALL (P < .001). Those with ETV6Del-ALL were more often younger (P = .009), non–T-cell lineage (P = .014), and ETV6/RUNX1 fusion gene positive (P < .001). Patients having HD-ALL were more frequently younger (P < .001), showed lower WBC (P < .001), non–T-cell lineage (P < .001), and ETV6/RUNX1 negative (P < .001).
Clinical features of ALL cases associated with one of three common genetic abnormalities
| Genetic abnormality, no. (%) | Others, no. (%) | P | |
|---|---|---|---|
| p16Del-ALL | |||
| Age | |||
| 1 to 9 y | 76 (68) | 231 (80) | — |
| Older than 9 y | 35 (32) | 57 (20) | .017 |
| WBC | |||
| Below 102 × 109/L | 85 (77) | 277 (96) | — |
| Over 102 × 109/L | 26 (23) | 11 (4) | .001 |
| Non-T lineage | 71 (62) | 263 (96) | — |
| T-lineage | 83 (38) | 11 (4) | .001 |
| ETV6Del-ALL | |||
| Age | |||
| 1 to 9 y | 75 (87) | 232 (74) | — |
| Older than 9 y | 11 (13) | 81 (26) | .009 |
| Non-T lineage | 89 (95) | 261 (85) | — |
| T-lineage | 4 (5) | 45 (15) | .015 |
| ETV6/RUNX1 | |||
| Positive | 53 (66) | 43 (15) | — |
| Negative | 27 (34) | 243 (85) | .001 |
| HD-ALL | |||
| Age | |||
| 1 to 9 y | 101 (89) | 206 (72) | — |
| Older than 9 | 13 (11) | 79 (28) | .001 |
| WBC | |||
| Below 102 × 109/L | 112 (98) | 250 (88) | — |
| Over 102 × 109/L | 2 (2) | 35 (12) | .001 |
| Non-T lineage | 110 (100) | 229 (82) | — |
| T-lineage | 0 (0) | 49 (18) | .001 |
| ETV6/RUNX1 | HD-ALL | Others | |
| Positive | 8 (8) | 88 (34) | — |
| Negative | 97 (92) | 173 (66) | .001 |
p16Del-ALL indicates ALL with deletion of p16INK4A gene; ETV6Del-ALL, ALL with deletion of ETV6 gene; HD-ALL, ALL with hyperdiploidy (chromosomes >50); —, not applicable; WBC, white blood cell count in peripheral blood (× 109/L) at diagnosis; and ETV6/RUNX1, ETV6/RUNX1 fusion was examined by RT-PCR and/or FISH analysis.
Numerical chromosomal abnormalities in pediatric ALL
Numerical chromosome changes were frequently detected in pediatric ALL samples, as summarized in Figure 3A. Numerical change of chromosome 21 (trisomy, tetrasomy, and pentasomy) was the most frequent (134 [34%] cases). We had 8 cases with Down syndrome who had trisomy 21 in their leukemic cells and their matched controls. These 8 cases are excluded in Figure 3A. Most of the numerical abnormalities were detected in HD-ALL cases (Figure S1A) except for those with trisomy 21 (Figure S1B). As for trisomy 21, half (21 cases) occurred in patients with subtypes other than HD (Figure S1B). In HD-ALL, gain of chromosomes was restricted to particular chromosomes, involving chromosomes 4, 6, 8, 10, 14, 17, 18, 21, and X (Figures 2A, 3A).

Numerical chromosomal changes and uniparental disomy in pediatric ALL. (A) Frequency of pentasomy/tetrasomy/trisomy affecting each chromosome. For X chromosome, trisomy (105 cases) contains trisosomy X in male pateints (67 cases) and disomy X in female patients (38 cases). All tetrasomy X were female patients. (B) Frequency of uniparental disomy (UPD). Whole: cases with whole chromosome UPD; p arm: cases with UPD of short arm; and q arm: cases with UPD of long arm. Chr: chromosome. UPD involving X chromosome was detected only in female cases. (C) Distribution of whole and partial chromosome UPD in HD and non–HD-ALL. Whole chromosome UPD is frequently detected in HD-ALL. Thirty-four cases with whole chromosome UPD were HD-ALL. Partial UPD is frequently detected in non–HD-ALL. Fifteen of 63 cases with partial UPD were HD-ALL. (D) Frequency of deletion of p16INK4A gene in whole chromosome 9 UPD and 9p UPD. Twenty-three cases showed deletion of p16INK4A, out of a total of 30 cases with 9p UPD. One case had p16INK4A deletion from a total 18 ALL samples with whole chromosome 9 UPD.
Numerical chromosomal changes and uniparental disomy in pediatric ALL. (A) Frequency of pentasomy/tetrasomy/trisomy affecting each chromosome. For X chromosome, trisomy (105 cases) contains trisosomy X in male pateints (67 cases) and disomy X in female patients (38 cases). All tetrasomy X were female patients. (B) Frequency of uniparental disomy (UPD). Whole: cases with whole chromosome UPD; p arm: cases with UPD of short arm; and q arm: cases with UPD of long arm. Chr: chromosome. UPD involving X chromosome was detected only in female cases. (C) Distribution of whole and partial chromosome UPD in HD and non–HD-ALL. Whole chromosome UPD is frequently detected in HD-ALL. Thirty-four cases with whole chromosome UPD were HD-ALL. Partial UPD is frequently detected in non–HD-ALL. Fifteen of 63 cases with partial UPD were HD-ALL. (D) Frequency of deletion of p16INK4A gene in whole chromosome 9 UPD and 9p UPD. Twenty-three cases showed deletion of p16INK4A, out of a total of 30 cases with 9p UPD. One case had p16INK4A deletion from a total 18 ALL samples with whole chromosome 9 UPD.
Nonrandom genetic abnormalities in pediatric ALL detected by SNP-chip
All copy number changes (deletions and duplications/amplifications) detected by SNP-chip analysis are shown in Figure 2A and Figure S2. Small deletions that could not be detected by conventional cytogenetics were sensitively identified, including deletions of 3p14.2 (500 kb), 3q26.32 (700 kb), and Xp21.1 (1 Mb) (Table 4 and Figure S2). Nonrandom chromosomal abnormalities (frequency > 1.5% of all cases) are listed in Table 4. Besides the 3 common genetic abnormalities, duplication of 1q (11%) and deletion of 6q (11.5%) were often detected. In 13 cases with 1q duplication, the duplication began at the PBX1 gene (Figures 2A, S2). Since gain of the entire or part of either chromosome 21 or X was frequently found in non–HD-ALL, these abnormalities were grouped separately (Table 4).
Recurrent genetic abnormalities detected by SNP-chip
| Chromosomal sites | Type of abnormality | No. of cases (%) | Candidate genes |
|---|---|---|---|
| 1q | Duplication | 44 (11) | — |
| 1q | Deletion | 11 (3) | — |
| 3p21 | Deletion | 6 (2) | — |
| 3p14.2 | Deletion | 6 (2) | FHIT |
| 3q26.3 | Deletion | 10 (3) | TBL1XR1 |
| 4q31 | Deletion | 7 (2) | — |
| 6q | Deletion | 46 (11) | — |
| 7p | Deletion | 10 (3) | — |
| 7q34 | Deletion | 7 (2) | — |
| 8p | Deletion | 13 (3) | — |
| 8q | Duplication | 9 (2) | — |
| 9q | Dup/amp | 9 (2) | ABL |
| 10p | Duplication | 7 (2) | — |
| 10q24 | Deletion | 12 (3) | — |
| 11q | Deletion | 24 (6) | — |
| 12p | Duplication | 13 (3) | — |
| 13q14.2 | Deletion | 14 (4) | RB1 |
| 15q | Deletion | 7 (2) | — |
| 17p | Deletion | 8 (2) | TP53 |
| 17q | Duplication | 10 (3) | — |
| 17q11.2 | Deletion | 7 (2) | NF1 |
| 20p12.2 | Deletion | 6 (2) | — |
| 20q | Deletion | 13 (3) | — |
| Xp21.2 | Deletion | 8 (2) | DMD |
| Gain of Chr. 21 or 21q in non-HD ALL cases | — | 37/283 (13) | — |
| Gain of Chr. X or Xq in non-HD ALL cases | — | 23/283 (8) | — |
Nonrandom chromosomal abnormalities (frequency >1.5% of all cases) are listed. 9p deletion and 12p deletions are separately shown in Figure 2B.
HD indicates hyperdiploid (>50 chromosomes); dup/amp, duplication and amplification of the region; and —, not applicable.
Recently, other groups of investigators performed SNP-chip analysis on pediatric ALL and found deletions of several transcriptional factors associated with B-cell development including PAX5 (9p13), EBF (5q33), Ikaros (7p12.2), Aiolos (17q12), LEF1(4q25), RAG1(11p12), and RAG2 (11p12).19,20 We also have found deletion of these genes in our study. However, the frequency of deletion of these genes, except for PAX5, was low (fewer than 2%) and/or the deleted regions contained multiple genes (Table 4; Figure S2 and data not shown).
UPD
One of the major advantages of SNP-chip analysis is capability of sensitive detection of UPD, even in samples suffering from small tumor content; UPD in samples with as low as 20% of tumor contents are clearly identified (Figure 1Aiv). Whole and partial chromosome UPDs were observed in 95 cases; 6 cases showed both whole and partial chromosome UPD (Figure 3B). Most of the whole chromosome UPD was detected in HD-ALL (Figure 3C). UPD of whole chromosome 9 was the most common whole chromosome UPD (Figure 3B). In contrast, UPD involving part of chromosomes was most often found in non–HD-ALL cases (Figure 3C). Recurrent partial chromosome UPD was detected in many chromosomal regions (Figure 3B). We frequently found whole chromosome 9 UPD (18 cases) and 9p UPD (30 cases) (Figure 3B). INK4A deletion was often found in 9p UPD (23 of 30, 77%), while it was rare in whole chromosome 9 UPD (1 of 18, 6%) (Figure 3D).
Relationship between genetic abnormalities
Recurrent abnormalities described above were compared with each other (3 common abnormalities and 26 nonrandom alterations) to detect relationships between these abnormalities (Table S1). Strong correlations between abnormalities of 12p and 21q were detected, duplications of 12p and 21q often occurred simultaneously, and duplications of 21q were accompanied by deletion of the ETV6 gene that was localized on 12p. ETV6Del ALL frequently had additional changes, including duplications (21q and 1q) and deletions (3p21, 1q, FHIT, 15q, and 4q). Abnormalities involving chromosome X, including DMD (Xp21.2) deletion, were frequently accompanied by deletions of 8p, 4q, and 6q. Deletion of 20q often occurred with either p16INK4A deletion or duplication of 21q (Figure 2A and Table S1).
Impact of nonrandom genetic abnormalities on prognosis
We analyzed prognosis of cases showing nonrandom abnormalities listed in Table 4 and found that the recurrent abnormalities had no impact on the event-free survival (EFS; data not shown) except for amplification/duplication of chromosome 9q. Our initial, early analysis found that EFS of pediatric ALL patients was not impacted by ETV6 deletion either with or without ETV6/RUNX1. Nine cases with 9q amplification/duplication showed a poor prognosis (6 patients relapsed within 3 years; Figure S3A), although the number of cases having this abnormality is too small to reach a significant conclusion. Of these cases, 3 also had duplication of part of chromosome 22 (Figure S3B), suggesting that duplication of 9q is part of an extra copy of the Philadelphia chromosome. These 3 cases showed BCR/ABL positively by FISH/RT-PCR analysis (data not shown). Two other cases showed high copy number amplification that encompassed ABL and NUP214 genes (Figure S3C), suggesting these cases had a NUP214/ABL fusion.21 The ALL cells of these 2 cases were steroid-resistant and T-cell lineage phenotype.
Children with HD-ALL without gain of either chromosome 17 or 18 had a worse prognosis (Figure 4). Furthermore, children with HD-ALL and no extra copies of chromosomes 17 and 18 had a significantly worse prognosis (P < .001), with 53% EFS at 5 years compared with a 90% 5-year EFS in the other HD-ALL cohort (Figure 4).

Prognostic impact of chromosomes 17 and 18. Absence of a gain of either chromosome 17 (left panel) or chromosome 18 (middle panel) is associated with poor prognosis in patients with HD-ALL; concurrent absence of a gain of both chromosomes 17 and 18 (right panel) is associated with very poor prognosis. Tri/tetra 18 and 17: HD-ALL with trisomy or tetrasomy 18 or 17. Others: HD-ALL without gain of chromosomes 17 and/or 18.
Prognostic impact of chromosomes 17 and 18. Absence of a gain of either chromosome 17 (left panel) or chromosome 18 (middle panel) is associated with poor prognosis in patients with HD-ALL; concurrent absence of a gain of both chromosomes 17 and 18 (right panel) is associated with very poor prognosis. Tri/tetra 18 and 17: HD-ALL with trisomy or tetrasomy 18 or 17. Others: HD-ALL without gain of chromosomes 17 and/or 18.
Discussion
SNP-chip analysis is a reliable method to detect gene dosage, which was validated by direct sequencing of SNP sites and quantitative PCR in this study. To detect HD-ALL, DNA index is not a sensitive method since contaminated normal cells (DNA index 1.0) decrease the levels of DNA index of hyperdiploid leukemic cells. Although karyotyping is a good method to detect HD-ALL, sufficient number of high-quality chromosomal metaphases is not always obtained from the leukemic cells. SNP-chip analysis may be a more useful and reliable method to detect this subtype of ALL.
Molecular allelokaryotyping of a large series of pediatric ALL samples showed 3 major abnormalities: deletion of p16INK4A, deletion of ETV6, and hyperdiploidy. Besides these 3 common abnormalities, a number of novel, nonrandom changes were found in ALL. Some of them showed a very narrow commonly deleted region, which was limited to one target gene, including FHIT (3p14.2), TBL1XR1 (3q26.3), and DMD (Xp21.2). DMD is the causative gene for Duchenne-type muscular dystrophy.22 While germ-line inactivating mutations of this gene cause the disease, no association has been made between this disease and cancers, including ALL. Since DMD is an extremely large gene (2.4 Mb), deletion of it may occur as a result of instability of genomic DNA in ALL cells.
Other investigators and we have found in pediatric ALL a number of deleted genes, including transcriptional factors involved in B-cell differentiation.19,20 However, since no point mutations of those genes, except PAX5, were detected,19 it is unclear that these transcriptional factors associated with B-cell development are target genes of these deletions. Mullighan et al19 and we have found that PAX5 gene is frequently involved in deletions and translocations (N.K., S.O., M.Z., et al, manuscript submitted), suggesting that impairment of PAX5 is associated with leukomogenesis.
This study showed that numerical chromosomal changes and UPD were common genomic abnormalities in pediatric ALL. Interestingly, whereas trisomy 21 was the most common numerical chromosomal abnormality, UPD of chromosome 21 was not detected in our study. Even in 8 cases with Down syndrome who had trisomy 21 in their constitutional DNA, UPD of chromosome 21 was not detected. Although UPD of chromosome 21 in leukemic cells of patients with Down syndrome has been reported,8 it may be a rare event in pediatric ALL.
Chromosomal mis-segregation occurs when duplicated chromosomes separate improperly during cell division,23 leading to numerical chromosomal changes in leukemic cells, including HD-ALL. Most of the whole chromosome UPD was detected in HD-ALL, suggesting that whole chromosome UPD is due also to chromosomal mis-segregation. In contrast, UPD involving part of chromosomes was most often found in non–HD-ALL cases. This may suggest that these partial UPDs are not caused by mis-segregation, but by mitotic recombination, which can usually cause chromosomal exchange.24
UPD involving chromosome 9 or 9p is a very common abnormality in pediatric ALL. INK4A gene may be a target gene of 9p UPD since most of the cases with 9p UPD had deletion of INK4A (23 of 30 cases with 9p UPD). For UPD involving whole chromosome 9, INK4A is not a target gene, since only one case with whole chromosome 9 UPD had deletion of this gene (1 of 18, 6%). Which gene is the target of whole chromosome 9 UPD is unclear. Furthermore, 7 cases with 9p UPD had intact INK4A, and the target gene of 9p UPD in these cases is also unknown. This is the first report showing that whole chromosome 9 UPD and 9p UPD are common abnormalities in pediatric ALL. Although Mullighan et al also analyzed a large number of pediatric ALL patients by SNP-chip,19 they did not report this abnormality.
UPD on 9p is associated with activating point mutations of JAK2 in myeloproliferative disorders (MPDs).26,–28 However, point mutation of JAK2 in ALL is very rare.29,30 We examined for JAK2 mutations at “hot-spots” (exons 12 and 14)18,26,–28 in these 7 cases of ALL with 9p UPD in which deletion of INK4A was not detected. We found no mutations of JAK2 in these cases. Another unidentified gene(s) in the region may be mutated in these cases.
In this study, we found that absence of gain of chromosomes 17 and 18 had an adverse impact on the prognosis of children with HD-ALL. Another large-scale study found that gain of chromosome 17 was associated with a better prognosis in HD-ALL.31 Although this previous study reported that gain of chromosomes 4 and 10 also was associated with a better prognosis, our study showed that change in number of these chromosomes did not have an impact on prognosis. Even though the size of our study is relatively large, it might not be able to detect some important factors associated with survival because the number of cases of this ALL subtype enrolled in our study was too small or advances in treatment of pediatric ALL may have eliminated several factors that previously influenced prognosis.
One of the limitations of SNP-chip analysis is that it cannot detect balanced translocations, which are common abnormalities in ALL, since this technique can detect only allelic dosage. In our correlation study of genomic abnormalities, a strong correlation was found between abnormalities involving 12p and 21q as described above. This, in part, reflected translocations of chromosome 12p and 21q (ETV6/RUNX1 fusion). Another correlation that we found between p16Del (on 9p) and deletion of 20q, may reflect dic(p13;q11).9,20,32,33 These strong correlations of gains or loss of genetic materials may, therefore, sometimes suggest unbalanced translocations in ALL. Combination of SNP-chip and karyotyping will be a very strong technique to examine all genomic abnormalities in malignant cells.
Molecular allelokaryotyping of a series of 399 pediatric ALL samples has defined the range of genetic changes that occur in childhood ALL, including those associated with a poor prognosis. SNP-chip analysis is a novel technique that allows a thorough interrogation of the genome in ALL and identification of clinically significant subgroups of patients.
An Inside Blood analysis of this article appears at the front of this issue.
The online version of this article contains a data supplement.
The publication costs of this article were defrayed in part by page charge payment. Therefore, and solely to indicate this fact, this article is hereby marked “advertisement” in accordance with 18 USC section 1734.
Acknowledgments
We thank the Parker Hughes Fund and National Institues of Health grants for supporting this study. N.K. is supported by the fellowship from The Tower Cancer Research Foundation. H.P.K. holds the Mark Goodson Chair in Oncology Research at Cedars Sinai and is a member of the Jonsson Cancer Center and the Molecular Biology Institute of UCLA. This work was also supported by grant-in-aid from Department of Health, Welfare. and Labor and from MEXT of the Japanese government, by EU grant FOOD-CT-2005-016320, and a grant from the Deutsche Krebshilfe to C.R.B. The ALL-BFM 2000 trial is supported by 50-2698-Schr 1 of the Deutsche Krebshilfe.
Authorship
Contribution: N.K. and S.O. designed this study, performed experiments, analyzed the data, and wrote the paper. M.Z., K.H., R.K., and W.-D.L. analyzed the data and wrote the paper. M.K., T.F., C.W.M., J.H., and M.S. analyzed the data. M.S., G.Y. and Y.N. performed experiments and analyzed the data. M.S. designed this study and wrote the paper. C.R.B. and H.P.K. designed this study, analyzed the data, and wrote the paper.
Conflict-of-interest disclosure: The authors declare no competing financial interests.
Correspondence: Seishi Ogawa, Department of Regeneration Medicine for Hematopoiesis, Graduate School of Medicine, University of Tokyo, 7-3-1 Hongo, Bunkyo-ku, Tokyo 113-8655, Japan; e-mail: sogawa-tky@umin.ac.jp; or Norihiko Kawamata, Hematology/Oncology, Cedars-Sinai Medical Institute, 8700 Beverly Blvd, Los Angeles, CA 90048; e-mail: kawamatan@cshs.org.

This feature is available to Subscribers Only
Sign In or Create an Account Close Modal