

Abstract
The physical interactions between B cells and stromal cells from the lymphoid tissue microenvironment are critical to the survival of normal and malignant B cells. They are principally mediated by integrins expressed on B cells and counterreceptors on stromal cells. Specifically, α4β1 integrin engagement rescues B cells from physiological or drug-induced apoptosis. Therefore, in order to understand the mechanisms by which integrins prevent apoptosis in leukemia B cells, we compared the temporal gene expression profiles induced by β1-integrin ligation with fibronectin (Fn) or adhesion by poly-L-Lysine in serum-starved precursor B leukemia cells. Among the 38 selected differentially expressed genes, 6 genes involved in adhesion (VAV2, EPB41L1, CORO1A), proliferation (FRAP1, CCT4), and intercellular communication (GJB3) were validated by real-time quantitative polymerase chain reaction (RT-Q-PCR). Gene expression modulation could also be validated at the protein level for 5 other genes. We show that integrin stimulation up-regulated FBI-1 expression but inhibited CD79a, Requiem, c-Fos, and caspase 7 induction when the cells underwent apoptosis. We further demonstrate that Fn stimulation also inhibits caspase 3 activation but increases XIAP and survivin expression. Moreover, integrin stimulation also prevents caspase activation induced by doxorubicin. Therefore, we identified genes modulated by adhesion of human precursor B leukemia cells that regulate proliferation and apoptosis, highlighting new pathways that might provide insights into future therapy aiming at targeting apoptosis of leukemia cells.
Introduction
Integrins are αβ chain heterodimers involved in cell-cell and cell–extracellular matrix interactions1that regulate cell survival, growth, differentiation, and motility.2 Integrins are the principal adhesion molecules expressed on B cells that allow physical interactions with stromal cells in lymphohematopoietic microenvironments. These interactions have been shown to be critical to the survival of both normal and neoplastic B cells. Adhesion-dependent cell survival has been observed for precursor B leukemia cells.3 Cells isolated from most patients with precursor B acute lymphoblastic leukemia (ALL) undergo apoptosis when cultured in media alone. However, in the presence of bone marrow stromal cells, apoptosis is prevented.4,5Moreover, the prolongation of ALL cell survival has been shown to be dependent on interactions between stromal and leukemia cells, with a direct involvement of β1 integrins.6 Disruption of the adhesion with monoclonal antibodies (mAbs) against α4β1 on the malignant cell or VCAM-1 on the stromal cell leads to apoptosis of the leukemia cells. Similarly, VCAM-1 expression on stromal cells regulates survival of B-lineage leukemia cells during chemotherapy.7 We also recently reported that β1 integrin stimulation by fibronectin (Fn), a ligand for β1 integrin, reversed apoptosis induced by doxorubicin in human precursor B leukemia cells.8 Analogous studies in acute myeloid leukemia (AML) cells and progenitor cells from patients with chronic myelogenous leukemia (CML) have demonstrated the relationship between β1 integrin adhesion to BM stromal cells and leukemia cell proliferation/differentiation.9 10 All these different studies strongly support the notion that stromal cells are directly involved in the regulation of leukemia cell growth, with β1 integrins playing a major role.
Integrin crosslinking in normal and malignant human B cells induces intracellular signaling, leading to protein kinase activation and phosphorylation of various substrates.11 12 In this report, we used high-density oligonucleotide microarrays to study the temporal profile of gene expression induced by β1 integrin ligation in precursor B leukemia cells. In order to identify which apoptosis-related pathways might be regulated by integrin crosslinking, serum-starved ALL cell lines were stimulated over time with Fn or with poly-L-lysine (PLL), which attaches the cells but does not induce integrin-specific signaling, as a control. The profiles of gene expression of these 2 groups of cells were comparatively analyzed using 2 statistical methods. These comparisons allowed us to identify 38 genes differentially regulated in the presence of Fn or PLL, with many being involved in adhesion, proliferation, or apoptosis. We confirmed the regulation of 6 of these genes by real-time quantitative polymerase chain reaction (RT-Q-PCR) and of 5 at the protein level by Western blot. Several genes involved in adhesion were up-regulated when the cells were cultured on PLL, indicating that attachment by PLL is not a neutral adhesion control but that it regulates genes involved in adhesion and cytoskeletal rearrangement. Furthermore, we show that Fn stimulation up-regulated molecules involved in cytoskeletal rearrangement and, importantly, in the control of proliferation, not previously identified upon integrin stimulation. Finally, we demonstrated that β1 integrin inhibited the induction of proteins at least partly responsible for apoptosis in human B cells, and increased the expression of proteins preventing apoptosis. Therefore, by using microarray technology, we identified additional components of β1 integrin–mediated pathways, including key molecules regulating cell proliferation and apoptosis that might be partly responsible for the observed effects of β1 integrin stimulation on human precursor B leukemia cells. These results might provide future therapeutic strategies to modulate the growth and survival of neoplastic B cells.
Materials and methods
Reagents
Antibodies (Abs) used were horseradish peroxidase–conjugated goat anti–rabbit immunoglobulin (Ig) and anti–mouse Ig (Promega, Madison, WI); anti–phosphotyrosine Ab (P-Tyr) 4G10 (Upstate Biotechnology, Lake Placid, NY); caspase 7 (total and cleaved), cleaved caspase 3, survivin, and XIAP Ab (Cell Signaling Technology, Beverly, MA); caspase 3 Ab (Santa Cruz Biotechnology, Santa Cruz, CA); c-Fos and CD79a Ab (NeoMarkers, Fremont, CA); and GAPDH Ab (Advanced Immunochemical, Long-Beach, CA). Requiem Ab was made as previously described.13 FBI-1 Abs were kindly provided by N. Hernandez (Cold Spring Harbor Laboratory, Cold Spring Harbor, NY). Fibronectin was purchased from Life Technologies (Rockville, MD) and poly-L-lysine from Sigma (St Louis, MO).
Generation of cRNA and microarray hybridization
Total RNAs were isolated using Trizol (Life Technologies) followed by RNeasy purification (Qiagen, Valencia, CA) and then treated according to Affymetrix's recommendations (Sacramento, CA). Briefly, dscDNAs were generated using a poly dT–oligonucleotide containing a T7 RNA polymerase initiation site and the SuperScript Choice System kit (Life Technologies). cDNAs were then purified by phenol/chloroform extraction. Biotinylated cRNA was generated by in vitro transcription using the BioArray High Yield RNA Transcript Labeling kit (Enzo Diagnostics, Farmingdale, NY), purified by RNeasy kit, and fragmented before hybridization on U95Av2 microarrays (Affymetrix).
Cell stimulation
REH or Nalm-6 cells (2 pre-B ALL cell lines; 3 × 10⁷) were cultured over time in RPMI 1640, with or without 10% fetal calf serum (FCS), on 10-cm plates or 6-well plates coated with Fn (15μg/mL) or PLL. For the condition without serum, the cells were also precultured in plain RPMI without serum for 3 hours at 37°C before stimulation. After 2 washes with phosphate-buffered saline (PBS), RNAs were extracted by adding Trizol directly on the plate or proteins were obtained with 400μL ice-cold NP-40 lysis buffer (containing 9.5 μg/mL aprotinin, 1 mM phenylmethylsulfonyl fluoride, 1mM pepstatin A, and 2.5 mM sodium vanadate), put on ice for 15 minutes, centrifuged, and then supernatants were collected. For transcription factor analysis, cells were lysed with boiling sample buffer, harvested, and boiled for an additional 5 minutes. For caspase detection, cells were lysed with Chaps buffer (Cell Signaling Technology) according to the manufacturer's instructions. Samples were analyzed by Western blot with specific antibodies, as previously described.14
Apoptosis detection
After stimulation with Fn or PLL, cells were detached with Trypsin (Life Technologies) and stained with annexin V–fluorescein isothiocyanate (FITC) and propidium iodide (PI) according to the manufacturer's instructions (BD Biosciences, San Jose, CA). Samples were then analyzed using a Coulter-EPICS-XL flow cytometer (Hialeah, Miami, FL).
Data mining
After scanning, the expression values for the genes were determined using Affymetrix GeneChip software. These data were plotted in order to validate the sample quality. Data mining was then performed on the expression values obtained using DNA-Chip Analyzer (D-Chip, Wong Lab, Dept of Biostatistics, Harvard School of Public Health, Boston, MA) with the *.CEL files obtained from GeneChip. As there were 4 time points in the temporal expression of the genes, we modeled the expression values as a quadratic function of time (see data plots in Figure 3 for an example). We also took into consideration the effects of treatment, cell line, and their interactions with time. This led to the following regression model: expression ∼ cell + trtmt + cell*trtmt + tt + tt2 + cell*tt + trtmt*tt + cell*trtmt*tt + cell*tt2 + trtmt*tt2 + cell*trtmt*tt2, where “cell” stands for cell line, “trtmt” for treatment, “tt” for time, and “tt2” for time squared. In order to select potentially interesting genes, we applied 2 criteria: no obvious cell line–by–treatment interactions (the 3rd, 8th, and last terms in the right-hand side of the equation being “nonsignificant” as defined by a Pgreater than a certain threshold according to the F distribution) and a substantial treatment effect (the 2nd, 7th, and 10th terms in the right-hand side of the equation being “significant” as defined by aP less than a certain threshold). The P values here were used as a summary statistic of the corresponding effects and as a screening tool for selecting genes. To obtain the Pvalues for the treatment effect, we used first the normality assumption of the expression data (ie, the F distribution of the statistic) and then a permutation method where the observed statistic was compared with the empirical distribution of the statistic from the permutations. The permutations were carried out within the same time points and the same cell lines, that is, the 2 labels each of Fn and PLL were permuted within the 4 replicates. This gave 6 possible permutations for each time point and each cell line. As there were 3 time points (excluding time 0 when there was no treatment given) and 2 cell lines, there were a total of 66 = 46 656 permutations. For our analysis we randomly chose 500 permutations, which would make computation feasible and give us a 95% confidence interval no wider than 0.1 for the estimated P value and, in particular, a 95% confidence interval no wider than 0.05 if the estimated P is around .1 (“Results”). These unadjusted (for multiple comparison)P values from either the F distribution or the permutation distribution provided useful ways to rank the genes. All data analyses were carried out using the statistical software package R (http://www.r-project.org/).
Real-time quantitative PCR
Analysis was performed with an ABI PRISM 7700 Sequence Detection System instrument using the SYBR Green I dye (PE Biosystems, Foster City, CA). Briefly, detection of PCR product was monitored by measuring the increase in fluorescence caused by the binding of SYBR Green I dye to dsDNA directly in the reaction tube. The sequence detector software calculates the threshold cycle number (CT) when signals reach 10-fold the standard deviation of the baseline. It was previously demonstrated that the calculated CT values are a quantitative measurement for the mRNA levels of various genes tested.15,16 The samples were treated as previously described.17 Briefly, DNase I–treated total RNAs were reverse-transcribed using the Advantage RT-for-PCR kit (Clontech, Palo-Alto, CA) following the manufacturer's instructions and cDNAs or water as control were amplified in triplicates by real-time PCR using the SYBR Green Master Mix reagent.
For each sample, CT values for GAPDH and ribosomal protein S9 genes were generated for normalization purposes. A correction factor was calculated by dividing by the minimum GAPDH and ribosomal protein S9 values and averaging the adjusted control values for the sample. This value was used to correct each sample for differences in RNA content.
Primer sequences
The following primers were designed using Primer Express 1.0 software (PE Biosystems). 5′ GJB3 CCCAACATCGTGGACTGCTA, 3′ GJB3 GGCGCCCACCATGAAGT, 5′ CORO1aTGCACCCAGACACGATCTACA, 3′ CORO1a TGTCACGGCAGGAGGTACAA, 5′CCT4 CCTATCAGGACCGCGACAAG, 3′ CCT4AGCATCAGCAACCGCTTTG, 5′ VAV2 TCGATGTGCGAGACTTTGGA. 3′VAV2 CTTTGTTCTGCGCGATGCT, 5′ FRAP1AGGCCGCATTGTCTCTATCAA, 3′ FRAP1 GCAGTAAATGCAGGTAGTCATCCA, 5′EBP41L1 CACTGCGGAAACCCTCTCAA, 3′ EBP41L1TCTCAGAAAACCCTCCTTTCACA, 5′ GAPDH CCACCCATGGCAAATTCC, 3′GAPDH GATGGGATTTCCATTGATGACA. To ensure the purity of the reaction, the PCR product for each gene was verified using dissociation curve software that illustrates a product as “pure” when it has a consistent melting temperature across replicates.
Results
Sample quality
To determine which genes were involved in the antiapoptotic effect induced by integrin ligation in B cells, REH or Nalm-6 cells were cultured in serum-free medium on plates coated with Fn, a ligand for β1 integrin, or PLL as control. We first analyzed the percentage of apoptotic cells after 1, 3, or 5 hours of culture on PLL or Fn by annexin-PI staining. Figure 1A shows a representative experiment performed with Nalm-6 cells. Similar results were obtained with REH cells (data not shown). Whereas an increase of apoptotic cells (about 40%) was observed when cells were cultured on PLL (P) or in media alone (control C), the number of apoptotic cells did not increase when the cells were cultured on Fn (F). Furthermore, the culture of cells on PLL in presence of serum prevented apoptosis (P+). This result indicates that under our conditions, Fn stimulation repressed the apoptosis of B cells induced by serum starvation.

Sample quality for the microarrays.
(A) Nalm-6 cells were cultured in serum-free medium on plates coated with Fn or PLL for various periods of time. Apoptosis was analyzed by flow cytometry using Annexin-propidium iodide staining after 1, 3 and 5 hours of culture on Fn (F) or PLL (P) or medium alone (C). P+ indicates culture on PLL in presence of serum. Cells were also lysed after for 15, 45 and 90 minutes of stimulation. Cell lysates were immunoprecipitated and analyzed by Western blot with anti–P-Tyr Ab. The results are representative of 3 experiments. (B) Comparison of gene expression changes induced by the technical variability (same sample on 2 chips) to 2 time point experiments (Fn vs PLL treatment, 8 and 48 hours). The data obtained with Affymetrix's GeneChip software (Avg Diff) were plotted. Twofold changes are indicated with straight lines.
We previously reported that integrin ligation in B cells induces a cascade of tyrosine phosphorylation events.18 We examined tyrosine (Tyr) phosphorylation of the total cellular lysates following β1 integrin stimulation as a control for the stimulation of the cells (Figure 1A). Cell lysates were immunoprecipitated and analyzed by Western blot with anti–P-Tyr Ab. As previously shown, stimulation of the cells with Fn induced Tyr phosphorylation of various intracellular proteins whereas PLL did not (Figure 1A). Total RNA was prepared in the same experiment at time 0 and 1, 3, or 8 hours after stimulation. The total RNAs were then processed according to Affymetrix's recommendations in order to load U95Av2 chips. Each experiment was performed in duplicate for both cell lines. The quality of the microarrays was established by scatter plots (Figure 1B). To evaluate the changes in RNA expression levels induced by Fn or PLL stimulation and the background of fluctuations in gene expression, we compared the technical variability (same cRNA loaded on 2 different chips) to one time point experiment (Fn vs PLL treatment). The data for Nalm-6 cells obtained with Affymetrix's GeneChip software (Avg Diff) were plotted. As depicted in Figure 1B, PLL versus Fn stimulation resulted in a larger number of genes showing a change in expression level as compared with the technical variability (compare left and right panels of Figure1B). A similar variation could be observed when the values obtained with REH cells were analyzed (data not shown). This figure also illustrates that Fn and PLL treatments are weak stimuli in terms of gene induction, since no major fold change of expression level could be observed, compared with similar analysis with stimulated T cells19 or activated dendritic cells.20 In order to determine if greater fold changes in gene expression could be detected at later time points, we then analyzed in an additional experiment, in replicate, the gene expression profile of Nalm-6 cells stimulated for longer periods of time (0, 24, and 48 hours). Again, no major increase in fold change could be detected even at the longest time point (48 hours; Figure 1B, right panel). These results are further evidence that Fn or PLL are very weak stimuli, since no major fold changes in gene expression could be detected even after longer stimulation. In order to select genes that, although weakly regulated, may be biologically relevant, we performed data mining as described below.
Data mining
The data were first processed using D-Chip software.21,22 Figure 2A shows the same replicate scatter plot as Figure 1B, but obtained after D-Chip processing and not Affymetrix's GeneChip software. We also plotted the cubic root of the values in order to evaluate the noise at the lower end of the expression values (right panel) and to apply a sufficient threshold to eliminate all low-expressed genes. We applied a threshold of more than 100 in expression level in at least one of the 28 experimental conditions to identify putative genes regulated by Fn or PLL treatment. Figure 2B shows the scatter plots of the average values (average of the 2 independent experiments) for both cell lines at 1, 3, and 8 hours. To select genes that were differentially expressed between the 2 treatments, we modeled the temporal expression profile of the genes as a quadratic regression function of time at 0, 1, 3, and 8 hours, plus the effects of treatment, cell line, and their interactions with time, as described in “Materials and methods.” The selected genes were those that did not have obvious cell line–by–treatment interactions and those that had a treatment effect. We applied a threshold of P greater than .1 for no cell line–by–treatment interaction; this, together with the previous filter of at least one expression greater than 100, gave us a total of 4670 genes. To identify the differentially expressed genes, we first used the normality assumption of the expression data and a Pcutoff of .1 in the F distribution (72 genes, data not shown) and then a permutation method where the observed statistic was compared with the empirical distribution of the statistic from 500 permutations.23 The Ps here did not carry the traditional meaning of pure statistical significance but allowed us to select the top 72 genes that were differentially expressed between the 2 treatments as summarized by the F statistic. The genes that were selected by the permutation method with a P cutoff of .1 (64 genes) are shown in Table 1. The permutation method does not rely on the normality assumption, although it is computationally intensive. The genes in Table 1 have been classified by biological functions. Forty-six of the 64 genes overlap with the 72 genes selected by assuming normality. We did not include in this analysis the additional 24-hour and 48-hour time-point experiments, since the 2 sets of experiments were performed independently and the second set does not have enough samples to permit permutation analysis. Furthermore, longer stimulation could have led to the regulation of the target genes of the first early responses genes. However, we did analyze these later time points independently, using a 2-sample t statistic, and we indicated with asterisks the genes that were identical or related to the ones selected from the first time-point experiments in Table 1.

Scatter plots of gene expression in stimulated cells.
(A) Scatter plot of the same sample loaded on 2 different chips obtained after D-Chip processing. We also plotted the cubic roots of the values in order to evaluate the noise (right panel). (B) scatter plots of the average values (average of the 2 independent experiments) obtained after Fn or PLL stimulation at 1 hour, 3 hours, and 8 hours for both cell lines (REH, top panels; Nalm6, bottom panels).
The 64 genes selected by the permutation method
| Affymetrix probe no. | HUGO name | Description | Unigene accession no. |
|---|---|---|---|
| Signal transduction | |||
| 35665_at | PIK3C3** | phosphoinositide-3-kinase, class 3 | Hs.32971 |
| 37598_at | RASSF2 | Ras association (RalGDS/AF-6) domain family 2 | Hs.80905 |
| 1704_at | VAV2 | vav 2 oncogene | Hs.4248 |
| 38617_at | LIMK2 | LIM domain kinase 2 | Hs.278027 |
| 31389_at | OSIL | oxidative stress induced like | Hs.158298 |
| 32963_s_at | DKFZP761H171 | hypothetical GTP-binding protein DKFZp761H171 | Hs.238679 |
| 38018_g_at | CD79A | CD79A antigen (immunoglobulin-associated alpha) | Hs.79630 |
| 38767_at | SPRY1 | sprouty (Drosophila) homolog 1 (antagonist of FGF signaling) | Hs.88044 |
| 1692_s_at | GFRA2 | GDNF family receptor alpha 2 | Hs.19317 |
| 38749_at | GPR39 | G protein–coupled receptor 39 | Hs.85339 |
| Transcription | |||
| 39539_at | FBI-1* | HIV-1 inducer of short transcripts binding protein | Hs.104640 |
| 1915_s_at | FOS | v-fos FBJ murine osteosarcoma viral oncogene homolog | Hs.25647 |
| 1789_at | COPS5 | COP9 subunit 5 (Jun activation domain binding protein) | Hs.198767 |
| 37194_at | GATA2 | GATA-binding protein 2 | Hs.334695 |
| 1612_s_at | JUND** | jun D proto-oncogene | Hs.2780 |
| 2084_s_at | ETV4** | ets variant gene 4 (E1A enhancer-binding protein, E1AF) | Hs.77711 |
| Adhesion | |||
| 38976_at | CORO1A | coronin, actin-binding protein, 1A | Hs.109606 |
| 36958_at | ZYX | zyxin | Hs.75873 |
| 32594_at | CCT4 | chaperonin containing TCP1, subunit 4 (delta) | Hs.79150 |
| 1140_at | ITGAE | integrin, alpha E (antigen CD103) | Hs.851 |
| 1846_at | LGALS8 | lectin, galactoside-binding, soluble, 8 (galectin 8) | Hs.4082 |
| 31775_at | SFTPD | surfactant, pulmonary-associated protein D | Hs.253495 |
| 39657_at | KRT4** | keratin 4 | Hs.3235 |
| 33917_at | EPB41L1** | erythrocyte membrane protein band 4.1-like 1 | Hs.26395 |
| Apoptosis | |||
| 38281_at | CASP7** | caspase 7, apoptosis-related cysteine protease | Hs.9216 |
| 39688_at | REQ | requiem, apoptosis response zinc finger gene | Hs.13495 |
| Cell cycle/proliferation | |||
| 35688_g_at | MTCP1 | mature T-cell proliferation 1 | Hs.3548 |
| 36577_at | MIG2 | mitogen inducible 2 (cell cycle, cell proliferation) | Hs.75260 |
| 40139_at | FRAP1 | FK506 binding protein 12-rapamycin associated protein 1 | Hs.338207 |
| 218_at | IK | IK cytokine, down-regulator of HLA II | Hs.8024 |
| Ubiquit/trafficking | |||
| 40701_at | USP13** | ubiquitin specific protease 13 (isopeptidase T-3) | Hs.85482 |
| 40584_at | NUP88** | nucleoporin 88 kD | Hs.172108 |
| 35779_at | VPS45B** | vacuolar protein sorting 45B (yeast homolog) | Hs.6650 |
| 32234_at | DYT1 | dystonia 1, torsion (similar to heat-shock proteins, Clp proteases) | Hs.19261 |
| 31535_i_at | SEC23B | Sec23 (S. cerevisiae) homolog B (vesicle trafficking) | Hs.173497 |
| 688_at | PSMC1 | proteasome (prosome, macropain) 26S subunit, ATPase, 1 | Hs.4745 |
| 41076_at | GJB3 | gap junction protein, beta 3, 31 kD (connexin 31) | Hs.98485 |
| Metabolism | |||
| 33881_at | FACL3 | fatty-acid-Coenzyme A ligase, long-chain 3 | Hs.268012 |
| 37355_at | MLN64 | steroidogenic acute regulatory protein related | Hs.77628 |
| 40963_at | ABCA4** | ATP-binding cassette, subfamily A (ABC1), member 4 | Hs.198396 |
| 37033_s_at | GPX1 | glutathione peroxidase 1 | Hs.76686 |
| 31816_at | GAA | glucosidase, alpha; acid | Hs.1437 |
| 38529_at | ACACB | acetyl-Coenzyme A carboxylase beta | Hs.183857 |
| 33568_at | CHRNB4 | cholinergic receptor, nicotinic, beta polypeptide 4 | Hs.54397 |
| Miscellaneous | |||
| 33060_g_at | NULL | Homo sapiens clone 24820 mRNA sequence | Hs.146312 |
| 36375_at | ODF1* | outer dense fibre of sperm tails 1 | Hs.159274 |
| 32913_i_at | LOC58509 | NY-REN-24 antigen | Hs.128425 |
| 33464_at | NULL | Homo sapiens mRNA full-length cDNA clone EUROIMAGE 25206 | Hs.25314 |
| 39229_at | SDCCAG1 | serologically defined colon cancer antigen 1 | Hs.54900 |
| 39784_at | EIF2S1 | eukaryotic translation initiation factor 2, subunit 1 (alpha, 35kD) | Hs.151777 |
| 36971_at | KIAA0257 | KIAA0257 protein | Hs.75912 |
| 37036_at | KIAA0301 | KIAA0301 protein | Hs.76730 |
| 32646_at | KIAA0449 | KIAA0449 protein | Hs.169182 |
| 41134_at | KIAA0964 | KIAA0964 protein | Hs.177425 |
| 40223_r_at | KIAA0685 | KIAA0685 gene product | Hs.296406 |
| 35260_at | MONDOA* | KIAA0867 protein | Hs.52081 |
| 38728_at | KIAA0225 | KIAA0225 protein | Hs.84790 |
| 32556_at | U2AF65 | U2 small nuclear ribonucleoprotein auxiliary factor (65 kD) | Hs.7655 |
| 1532_g_at | NULL | Human BRCA2 region, mRNA sequence CG006 | Hs.110630 |
| 32502_at | NULL | Homo sapiens clone PP1665 unknown mRNA | Hs.6748 |
| 34703_f_at | NULL | ESTs, Highly similar to ORF2 [H.sapiens] | Hs.323782 |
| 31414_at | TTY2** | testis-specific testis transcript Y 2 | Hs.158345 |
| 37885_at | AF038169 | hypothetical protein | Hs.145567 |
| 36398_at | NULL | ESTs, Moderately similar to POL2_HUMAN RETROVIRUS | Hs.163863 |
The mRNAs from Fn- or PLL-stimulated cells were analyzed by Hu95av2 microarrays as described in “Materials and methods.” Data were then analyzed with D-Chip software. Genes were selected if an expression of more than 100 was reached for at least one time point in one condition. Genes are classified by biological functions. Forty-six of the 64 genes overlap with the 72 genes selected by assuming normality (designated by shading in the first column). One asterisk (*) indicates that the same gene has also been selected at 24 or 48 hours; two asterisks (**), that a relative gene (same family or other subunit) has also been selected at 24 or 48 hours.
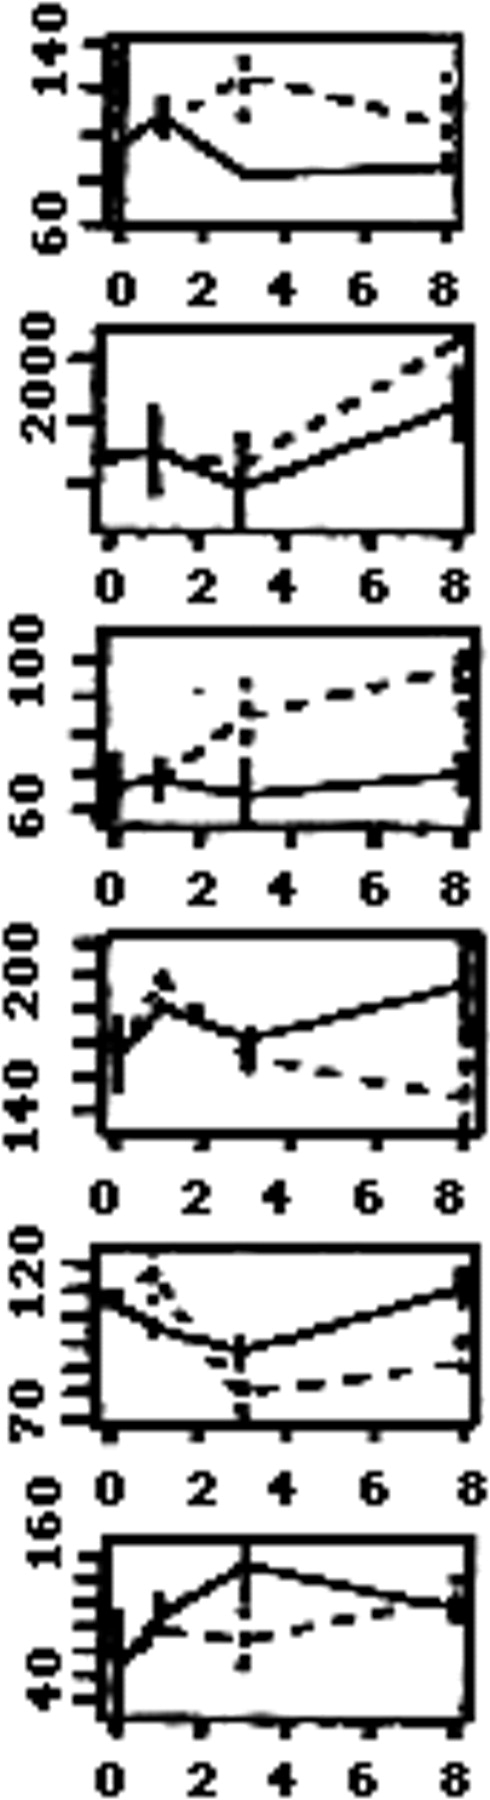
The expression levels of these 64 genes obtained by D-Chip were then plotted for each independent experiment as a function of time (not shown). We also plotted the average expression level for each cell line as a function of time. This allowed us to discard 26 genes that showed very different levels of expression across the duplicates within a cell line. Therefore, there were 38 genes, listed in Figure3, which appeared to have a reproducible pattern of expression as well as a high enough expression level. For the purpose of clarity, we show plots only for Nalm-6 cells. However, similar patterns of expression were obtained for REH cells. (See the Supplemental Figure link at the top of the online article, at theBlood website.)

List of 38 of the 64 genes selected by the permutation method from Table 1.
Genes (HUGO names) that have been selected for having reproducibility across the cell lines and the replicates are classified by biological functions. The average expression levels as function of time are shown on the right side for each gene, for Nalm-6. Dashed line: PLL; solid line: Fn.
Regulation of proteins involved in intercellular communication, adhesion, and proliferation
We analyzed the RNA expression levels of 6 of these 38 genes by RT-Q-PCR experiments24 using SYBR Green I, as previously described.17 We selected 3 genes induced by PLL (VAV2, CORO1A, EPB41L1) and 3 genes induced by Fn (CCT4, FRAP1, GJB3). These genes play a role in adhesion or proliferation and were therefore of potential relevance. We also selected GJB3, which is not known to be expressed by B cells. The results of one representative experiment for each gene are shown in Table 2. The CTvalues were normalized for each gene in all of the samples using GAPDH and S9 expression as described in “Materials and methods.” A lower CT value reflects a higher mRNA content. The difference between the mean CT value for Fn and the mean CT value for PLL (ΔCT) was calculated for each time point. No important differences were observed except forVAV2, which exhibits a ΔCT greater than 3. However, we were expecting low values for ΔCT because no considerable increase in fold change could be detected on the overall scatter plot of Fn/PLL treatments shown in Figure 1B. Of the 6 genes tested, 5 reproduced the results obtained from our data mining (shown on the left side of the table), showing an increased expression on PLL for VAV2, CORO1A, and EBP41L1 (positive ΔCT) and an increased expression on Fn for CCT4, FRAP1, and GJB3 (negative ΔCT). No changes for FRAP1 could be observed for Nalm-6 cells when the average expression was plotted as a function of time (Figure 3), but when plotted separately, one of the 2 experiments shows amplification on Fn similar to the 2 REH experiments, whereas the other one has the reversed effect (not shown). However, amplification on Fn by RT-Q-PCR was detected with both cell lines. CORO1Ashowed, as expected, an up-regulation after PLL stimulation but then an up-regulation with Fn was detected that was not observed when the data were plotted as a function of time. Also, changes at 1 hour could be detected by RT-Q-PCR, whereas no change was observed on our plots.
Gene expression analysis by real-time quantitative PCR
| 1 h | 3 h | 8 h | |||||||||
|---|---|---|---|---|---|---|---|---|---|---|---|
| Probe | UNIGENE | CTFn ± SD | CT PLL ± SD | ΔCT1h | CT Fn ± SD | CT PLL ± SD | ΔCT 3h | CT Fn ± SD | CTPLL ± SD | ΔCT 8h | |
 | 1704_at | VAV2 | 33.20 ± 0.63 | 30.15 ± 0.26 | +3.04 | 33.16 ± 0.78 | 31.07 ± 0.33 | +2.09 | 34.59 ± 0.69 | 34.23 ± 0.71 | +0.36 |
| 38976_at | CORO1A | 22.28 ± 0.18 | 21.38 ± 0.09 | +0.90 | 21.27 ± 0.05 | 22.41 ± 0.03 | −1.13 | 20.28 ± 0.00 | 20.57 ± 0.16 | −0.29 | |
| 33917_at | EPB41L1 | 26.26 ± 0.41 | 26.12 ± 0.22 | +0.14 | 24.04 ± 0.25 | 24.02 ± 0.48 | +0.02 | 25.15 ± 0.37 | 24.18 ± 0.49 | +0.97 | |
| 32954_at | CCT4 | 21.62 ± 0.28 | 20.71 ± 0.32 | +0.90 | 21.53 ± 0.18 | 22.50 ± 0.27 | −0.97 | 20.89 ± 0.10 | 21.85 ± 0.37 | −0.96 | |
| 40139_at | FRAP1 | 25.55 ± 0.09 | 24.48 ± 0.56 | +1.07 | 24.67 ± 0.09 | 25.41 ± 0.07 | −0.74 | 24.24 ± 0.90 | 24.63 ± 0.18 | −0.39 | |
| 41076_at | GJB3 | 36.01 ± 0.20 | 40.85 ± 0.46 | −4.84 | 32.09 ± 0.46 | 33.57 ± 0.78 | −1.48 | 32.614 ± 0.48 | 32.87 ± 0.97 | −0.26 | |
| 1 h | 3 h | 8 h | |||||||||
|---|---|---|---|---|---|---|---|---|---|---|---|
| Probe | UNIGENE | CTFn ± SD | CT PLL ± SD | ΔCT1h | CT Fn ± SD | CT PLL ± SD | ΔCT 3h | CT Fn ± SD | CTPLL ± SD | ΔCT 8h | |
| 1704_at | VAV2 | 33.20 ± 0.63 | 30.15 ± 0.26 | +3.04 | 33.16 ± 0.78 | 31.07 ± 0.33 | +2.09 | 34.59 ± 0.69 | 34.23 ± 0.71 | +0.36 |
| 38976_at | CORO1A | 22.28 ± 0.18 | 21.38 ± 0.09 | +0.90 | 21.27 ± 0.05 | 22.41 ± 0.03 | −1.13 | 20.28 ± 0.00 | 20.57 ± 0.16 | −0.29 | |
| 33917_at | EPB41L1 | 26.26 ± 0.41 | 26.12 ± 0.22 | +0.14 | 24.04 ± 0.25 | 24.02 ± 0.48 | +0.02 | 25.15 ± 0.37 | 24.18 ± 0.49 | +0.97 | |
| 32954_at | CCT4 | 21.62 ± 0.28 | 20.71 ± 0.32 | +0.90 | 21.53 ± 0.18 | 22.50 ± 0.27 | −0.97 | 20.89 ± 0.10 | 21.85 ± 0.37 | −0.96 | |
| 40139_at | FRAP1 | 25.55 ± 0.09 | 24.48 ± 0.56 | +1.07 | 24.67 ± 0.09 | 25.41 ± 0.07 | −0.74 | 24.24 ± 0.90 | 24.63 ± 0.18 | −0.39 | |
| 41076_at | GJB3 | 36.01 ± 0.20 | 40.85 ± 0.46 | −4.84 | 32.09 ± 0.46 | 33.57 ± 0.78 | −1.48 | 32.614 ± 0.48 | 32.87 ± 0.97 | −0.26 | |
The RNA expression level of 3 genes induced by PLL attachment (VAV2, CORO1A, EPB41L1) and 3 genes induced by Fn (CCT4, FRAP1, GJB3) was analyzed by real-time quantitative PCR experiments using SYBR Green. Mean values ± SDs are shown for Fn (CT Fn) and PLL (CT PLL), as well as the difference between the means (ΔCT). A lower CT value is indicative of a higher mRNA expression. The expression profile plots obtained for Nalm6 (except FRAP plot) corresponding to each gene analyzed by RT-Q-PCR are shown on the left side of the table.
FBI-1 induction in Fn-stimulated cells
We investigated whether some of the genes found to be differentially expressed by microarrays could be validated at the protein level. We chose 5 genes up-regulated by either Fn or PLL and analyzed their expression by Western blotting experiments using specific antibodies.
Several of the genes found by our models were transcription factors. Among them, FBI-1 (also described as lymphoma-related factor [LRF]) was increased by Fn stimulation. The protein encoded by this gene has been described as a potential transcription factor.25 It contains a POZ domain at its N terminus and 4 Kruppel-type zinc fingers at its C terminus. Furthermore, FBI-1 may bind actin,26 and therefore likely plays a role in adhesion. We investigated whether an up-regulation could also be detected at the protein level. Nalm-6 cells were cultured on Fn- or PLL-coated plates in the absence of serum and lysed after various periods of time. Aliquots of each cell lysate were analyzed by Western blot using anti–FBI-1 antibodies. The membrane was then stripped and reprobed with anti-GAPDH antibodies to confirm that equivalent amounts of proteins were loaded in each lane. As depicted in Figure4A, Fn stimulation induced up-regulation of FBI-1, which was more obvious after 1 and 2 days of stimulation.

Regulation of various proteins by Fn and PLL treatments.
(A) Nalm-6 cells were cultured with Fn or PLL for 0.5, 1 or 2 days, in absence of serum. An aliquot of each cell lysate was then analyzed by Western blot using anti–FBI-1 and after stripping with anti-GAPDH antibodies. (B) Nalm-6 cells were cultured with Fn or PLL for 1, 2, 3 or 6 days without serum before lysis. An aliquot of each cell lysate was then analyzed by Western blot using anti–c-Fos and anti-GAPDH antibodies. (C) An aliquot of each cell lysate listed in the legend to panel B was analyzed by Western blot using anti-CD79A and anti-GAPDH antibodies.
c-Fos and CD79A regulation
Among transcription factors, we could also detect an induction of both c-Fos and Jun-D RNAs when the cells were cultured on PLL. The cellular proto-oncogenes encoded by these genes are members of the AP1 family of transcription factors, and they control proliferation, differentiation, and apoptosis.27 We analyzed whether c-Fos protein was modulated on Fn or PLL treatment. As shown in Figure 4B, an induction of c-Fos could be observed after 3 days of serum starvation but was repressed when the cells were cultured with Fn.
An up-regulation of CD79A RNA could be detected using microarrays when the cells were cultured on both Fn and PLL, although a larger increase was observed on PLL. We confirmed this result by Western blot using Nalm-6 cells. CD79A protein was induced when the cells were stimulated by Fn or PLL. However, the induction was higher in the presence of PLL (Figure 4B). This result suggests that adherence of B cells to a substratum leads to an increased CD79A expression.
Regulation of proteins controlling apoptosis by integrin stimulation
Among the genes induced by PLL but suppressed on Fn, caspase 7 and requiem encode proteins regulating apoptosis. Caspase 7 belongs to a large family of cysteine proteases involved in apoptosis.28 These proteases exist as inactive proenzymes, which undergo proteolytic processing to produce 2 subunits that dimerize to form the active enzyme. Requiem is a zinc-finger protein with 2 C4HC3 domains that are highly homologous to the C4HC3 zinc fingers of MOZ, an acetyltransferase protein involved in the t(8;16) leukemia-associated breakpoint.29 It is required for the apoptotic response induced by interleukin 3 (IL-3) deprivation of murine myeloid cell lines.13 Since Fn treatment rescues cells from apoptosis, we investigated whether these 2 proteins were involved in apoptosis of human B cells, meaning up-regulated when the cells were cultured on PLL but repressed when cultured on Fn. Nalm-6 cells were cultured on Fn- or PLL-coated plates in the absence or presence of serum to induce or prevent apoptosis and were lysed after various periods of time. An aliquot of each cell lysate was then analyzed by Western blot using anti-requiem antibodies (Figure5A) or anti–caspase 7 antibodies (Figure5B). As shown in Figure 5A, an increase of requiem protein could be observed when the cells were cultured on PLL after 2 and 3 days in the absence of serum, whereas no induction was observed in presence of Fn. Furthermore, the presence of serum abrogates requiem induction observed with PLL. Similarly, a faint but reproducible increase of caspase 7 was detected after 4 and 5 days of culture on PLL but not on Fn. Furthermore, by using a specific antibody, we were able to detect the cleaved fragment of caspase 7 in PLL treated cells, which was greatly reduced when the cells were treated with Fn (Figure 5B) or in the presence of serum (data not shown). Therefore, caspase 7 was induced and activated in B cells cultured with PLL, whereas Fn stimulation inhibits its induction and further activation.

Regulation of proteins involved in the control of apoptosis.
(A) Nalm-6 cells were cultured with Fn or PLL for 1, 2 or 3 days before lysis, in absence or presence of serum. An aliquot of each cell lysate was then analyzed by Western blot using anti-Requiem and anti-GAPDH antibodies. (B) Nalm-6 cells were cultured with Fn or PLL for 1, 2, 4 or 5 days in absence of serum before lysis. An aliquot of each cell lysate was then analyzed by Western blot using anti–total and anti–cleaved caspase 7 antibodies as well as anti-GAPDH antibodies. (C) An aliquot of Nalm-6 cell lysate was analyzed by Western blot using anti–caspase 3 and anti-GAPDH antibodies. (D) REH cells were cultured with Fn or PLL for 1, 2, 3 or 5 days before lysis. An aliquot of each cell lysate was then analyzed by Western blot using anti-XIAP, antisurvivin, anti–cleaved caspase 3 and anti-GAPDH antibodies. (E) Nalm-6 cells were cultured on Fn or PLL coated plates for one day with doxorubicin (0.5 μg/mL) before lysis. An aliquot was then analyzed with anti–cleaved caspase 3 or 7, as well as GAPDH antibodies.
We then examined the potential role of other proteins regulating caspase 7 activity. We first analyzed whether caspase 3, which shares most of its biological functions with caspase 7, was also involved in this process. As shown in Figure 5C, caspase 3 was up-regulated during apoptosis but integrin engagement inhibited the induction. We also evaluated whether the expression of the antiapoptotic proteins XIAP and survivin, which inhibit caspase 3 and 7, were modified by integrin stimulation. Stimulation with Fn increased the expression of both proteins (Figure 5D). We could also detect an increased expression of both proteins in the presence of serum (data not shown), suggesting that the increased expression of both XIAP and survivin was not necessarily due to apoptotic conditions but was correlated with integrin engagement. Furthermore, in the same experiment, we found that XIAP expression inversely correlates with the level of caspase 3 activation. In the presence of Fn, XIAP was induced, and therefore no caspase 3 activation occurred. In contrast, XIAP was not induced on PLL, and we could detect the cleaved caspase 3 portion, indicating that caspase 3 was activated.
Finally, we analyzed whether the integrin-mediated inhibitory effect on caspase 3 and 7 activation could be validated in another model of apoptosis. We cultured Nalm-6 cells on Fn or PLL with doxorubicin in order to induce apoptosis.30 After one day, cells were lysed and Western blots were performed using cleaved caspase 7 or 3 antibodies. As shown in Figure 5E, Fn stimulation clearly inhibited activation of both caspases.
Discussion
The regulation of normal and neoplastic B-cell survival involves integrin engagement. Precursor B leukemia cell survival is supported by ligation of β1 integrins following adhesion to bone marrow stromal cells. In the present study, we analyzed the expression patterns of genes regulated by β1 integrin in precursor B leukemia cell lines. We used serum-starved cells in order to select genes that presumably play a role in the regulation of apoptosis within these cells. Considering the low-level fold changes in gene expression obtained, we chose to select a limited number of genes whose reproducibility of expression was consistent between the replicates and the 2 cell lines studied.31 32 By using such a threshold, we may have discarded some potentially interesting genes. However, by applying such stringency in our selection, we obtained a good correlation between the results obtained from data mining experiments and from validation experiments performed by quantitative RT-Q-PCR. More important, we could also validate all 5 genes tested at the protein level. Therefore, we are confident that although Fn and PLL are very weak stimuli, the observed changes are significant.
Among the 38 selected genes (Figure 3), a number play a role in adhesion. Half of these genes were up-regulated when cells were cultured on PLL. This indicates that the chemical adhesion of the cells on PLL was not neutral but rather up-regulated genes involved in the adherence of cells, such as ZYXIN, CORO1A, EBP41L1, andVAV2. These last 3 genes were confirmed by quantitative PCR. CORO1A (coronin) is an actin-binding protein involved in mitosis and cell motility.33,34 Erythrocyte membrane protein band 4 like 1 (EPB4L1), homologous to EPB4.1, mediates interactions between the erythrocyte cytoskeleton and the overlying plasma membrane and therefore plays also a role in cytoskeletal rearrangement.35 VAV2, the second member of the VAV oncogene family, is expressed in most tissues and has been shown to be required for cell spreading.36
Several genes identified provide links between integrin adhesion and regulation of proliferation. We confirmed that Fn plating of the precursor B cell lines led to an induction of CCT4, the δ subunit of the cytosolic chaperonin containing TCP-1.37 This protein assists the folding of newly translated polypeptide substrates, such as the 2 cytoskeletal proteins tubulin and actin, indicating a role in cytoskeletal rearrangement. Moreover, a role of CCT4 in the control of proliferation has also been described.38 CCT4 is essential for cyclin E maturation and accumulation, which has been implicated in the positive control of the G1/S phase transition.39 We also confirmed that FKBP12-rapamycin–associated protein (FRAP)40 was induced by Fn stimulation. A role for FRAP upon β1 integrin stimulation has been suggested in fibroblasts in which p70/S6 kinase activation was inhibited by the FRAP inhibitor rapamycin.41 FRAP has serine/threonine kinase activity and promotes G1 phase progression through signaling to p70/S6 kinase and 4E-BP1. Recent data place FRAP downstream of the phosphatidyl inositol 3-kinase/Akt–signaling pathway. We have reported that β1 integrin stimulation of precursor B cell lines leads to PI3K and AKT activation8 and AKT stimulation has been linked to α5β1 integrin-dependent survival in epithelial cells.42 Therefore, Fn stimulation activates the AKT signaling pathway, including the downstream kinase FRAP, which may then promote cell proliferation of both normal and neoplastic B cells.
One of the transcription factors up-regulated by Fn stimulation was FBI-1 (or LRF). FBI-1 contains a POZ domain at its N terminus and 4 Kruppel-type zinc fingers at its C terminus. The C terminus is sufficient for specific binding, and FBI-1 can form homomers through its POZ domain. Furthermore, FBI-1 may bind actin. A recent study reported that other POZ-containing proteins, the hcKrox family members (α, β, and γ), regulate multiple extracellular matrix genes.43 Transient transfection analyses in fibroblasts have shown that all hcKrox members, as well as the murine cKrox-beta homolog, LRF, suppress transcription driven by promoters for the α1(I) and α2(I) collagen, fibronectin, and elastin genes. Human FBI-1 might also heterodimerize with members of the hcKrox family and then negatively regulate transcription of proteins encoding for the extracellular matrix. Although these proteins are not produced in abundance by B cells, it has been shown that cultured lymphoblastoid cells produce low levels of collagen.44 This may be a mechanism by which β1 integrin stimulation limits expression of proteins that might compete for binding to the integrin adhesion receptors, preventing the subsequent survival signals to be induced.
Members of the transcription factor AP-1 complex c-Fos and Jun-D were highly overexpressed when the precursor B cell lines were cultured on PLL. These proteins are proto-oncogenes that control proliferation, differentiation, and apoptosis by propagating signals from the cell membrane to the nucleus. Interestingly, it has also been reported that inhibitors of microtubule assembly induce an increased phosphorylation and expression of specific Jun and Fos proteins, underlining a link between the cytoskeleton and AP-1 family members.45,46 Both c-Fos and Jun-D proteins have been linked to apoptosis, although the role of Jun-D has been described as antiapoptotic or proapoptotic depending on the cell type. c-Fos induces apoptosis in germinal center B cells, and its overexpression induces apoptosis of CD43+ pro-B cells.47,48 Jun-D also negatively regulates cell proliferation. Its constitutive overexpression inhibits proliferation of immortalized fibroblasts by increasing the number of resting cells,49 whereas Jun-D–deficient fibroblasts exhibit increased proliferation.50 The similar temporal inductions of both c-Fos and Jun-D suggest that this AP-1 complex plays a role in B-cell apoptosis and that Fn stimulation prevents this induction, hence protecting the cells from apoptosis.
One major goal of this study was to try to understand the mechanisms by which adhesion to stromal cells promotes cell survival. We identified several proteins that play a role in apoptosis regulation. One of these was the cysteine protease caspase 7. These proteases are activated by a proteolytic cleavage cascade. We observed that caspase 7 was up-regulated when cells are cultured with PLL but suppressed by Fn. Of note, we observed that caspase 7 was cleaved and therefore activated, and that, similarly, Fn stimulation greatly reduced its activation. Moreover, we found that caspase 3 was also up-regulated and activated during apoptosis but that integrin engagement inhibited its induction. We show that integrin stimulation also protected the cells from apoptosis induced by chemotherapy drugs, indicating that this is a mechanism of rescue common to different apoptotic signals. We further analyzed whether, on the contrary, Fn stimulation could up-regulate proteins from the IAP (inhibitor of apoptosis proteins) family.51,52 We found that Fn stimulation increased XIAP and survivin expression. Both proteins directly inhibit at least caspase 3 and caspase 7,53,54and XIAP has been described to inhibit serum deprivation-induced apoptosis.55 We also identified a gene up-regulated on PLL called REQUIEM that had been cloned after IL-3 deprivation in murine myeloid cells. This protein is required for apoptosis within these cells.13 We were able to detect an increase in the protein level of requiem, indicating that this protein is also likely involved in apoptosis of precursor B ALL cells induced by serum starvation. Furthermore, we show that Fn stimulation prevented the up-regulation of this protein in the absence of serum, making this protein an interesting target for future use in therapy.
In conclusion, our results led to the following hypothesis, which is illustrated in Figure 6: Upon stimulation through β1 integrins, precursor B ALL lines can be rescued from apoptosis. Engagement of β1 integrin suppresses the induction of 3 proteins: caspase 3, caspase 7, and requiem, which are up-regulated when cells undergo apoptosis. Furthermore, while caspase 3 and 7 are cleaved and activated when ALL cells undergo apoptosis, Fn stimulation greatly prevents their activation. In addition, integrin stimulation increases the expression of 2 antiapoptotic proteins, XIAP and survivin. Similarly, c-Fos and possibly Jun-D are overexpressed when the cells are cultured on PLL, suggesting that this AP-1 complex plays a role in B cell apoptosis but is suppressed by Fn stimulation. We also identified other proteins involved in cytoskeletal rearrangement, which may permit the cells to maintain or enhance their adhesion to extracellular matrix and/or stromal cells in the bone marrow, allowing a continuation of the antiapoptotic signals. Furthermore, we identified proteins that promote proliferation that were also increased by Fn stimulation. These results may provide insights into new potential targets for therapy of precursor B cell acute leukemias.

Regulation of proliferation and apoptosis by integrin engagement in ALL cells as detected by microarrays and validation experiments.
Our model depicts the regulation of proteins involved in the control of apoptosis as well as the induction of proteins involved in proliferation or cytoskeletal rearrangements. Under apoptotic conditions, β1 integrin ligation represses the induction and activation of caspase 3 and 7, the induction of Requiem and of the AP-1 complex composed of c-Fos and JunD. On the other hand, integrin engagement leads to increased expression of survivin and XIAP. It also enhances the expression of FBI-1 that may inhibit further production of components from the extracellular matrix. Integrin ligation also increases the expression of CCT4 that assists the folding of both actin and tubulin. Finally, FRAP and CCT4 have been shown to play a role in proliferation. ECM indicates extracellular matrix proteins; and †, cell death.
We thank S. Gullans, L. Hsiao, and R. Gentleman for helpful discussion. Many thanks to S. Chiaretti and K. Wang for their help with Affymetrix protocol. We are very grateful to N. Hernandez (CSHL, NY) for the generous gift of FBI-1 Ab. We thank H. Husson for his critical reading of the manuscript.
Prepublished online as Blood First Edition Paper, September 19, 2002; DOI 10.1182/blood-2002-05-1519.
Supported by National Institutes of Health grants CA81494 and CA06516, the Leukemia and Lymphoma Foundation of America, and the Norman Hirschfield Foundation. A.L.A. was partly supported by CNRS, France.
A.L.A. and R.X. contributed equally to this work.
The online version of the article contains a data supplement.
The publication costs of this article were defrayed in part by page charge payment. Therefore, and solely to indicate this fact, this article is hereby marked “advertisement” in accordance with 18 U.S.C. section 1734.

This feature is available to Subscribers Only
Sign In or Create an Account Close Modal