Key Points
Abundant aberrant somatic hypermutation contributes to the promiscuity of MYC rearrangement partners in HGBCL-DH-BCL2.
MYC rearrangement architecture in HGBCL-DH-BCL2 preserves expression of both the B-cell receptor and BCL2 from the preexisting IGH::BCL2.
Visual Abstract
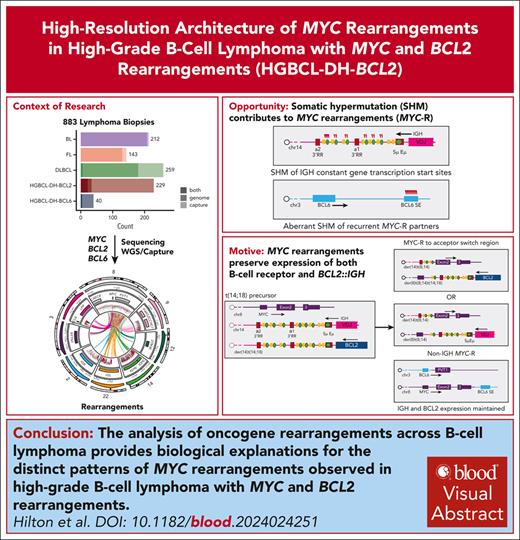
Rearrangements that place the oncogenes MYC, BCL2, or BCL6 adjacent to superenhancers are common in mature B-cell lymphomas. Lymphomas with diffuse large B-cell lymphoma (DLBCL) or high-grade morphology with both MYC and BCL2 rearrangements are classified as high-grade B-cell lymphoma with MYC and BCL2 rearrangements (“double hit”; HGBCL-DH-BCL2) and are associated with aggressive disease and poor outcomes. Although it is established that MYC rearrangements involving immunoglobulin (IG) loci are associated with inferior outcomes relative to those involving other non-IG superenhancers, the frequency of and mechanisms driving IG vs non-IG MYC rearrangements have not been elucidated. Here, we used custom targeted capture and/or whole-genome sequencing to characterize oncogene rearrangements across 883 mature B-cell lymphomas including Burkitt lymphoma, follicular lymphoma, DLBCL, and HGBCL-DH-BCL2 tumors. We demonstrate that, although BCL2 rearrangement topology is consistent across entities, HGBCL-DH-BCL2 have distinct MYC rearrangement architecture relative to tumors with single MYC rearrangements or with both MYC and BCL6 rearrangements (HGBCL-DH-BCL6), including both a higher frequency of non-IG rearrangements and different architecture of MYC::IGH rearrangements. The distinct MYC rearrangement patterns in HGBCL-DH-BCL2 occur on the background of high levels of somatic hypermutation across MYC partner loci in HGBCL-DH-BCL2, creating more opportunity to form these rearrangements. Furthermore, because 1 IGH allele is already disrupted by the existing BCL2 rearrangement, the MYC rearrangement architecture in HGBCL-DH-BCL2 likely reflects selective pressure to preserve both BCL2 and B-cell receptor expression. These data provide new mechanistic explanations for the distinct patterns of MYC rearrangements observed across different lymphoma entities.
Introduction
Mature B-cell lymphomas frequently harbor rearrangements that place oncogenes, most often MYC, BCL2, and BCL6, adjacent to immunoglobulin (IG) loci, leading to constitutive transcription driven by the regulatory elements that normally drive B-cell receptor (BCR) expression. MYC rearrangements (MYC-Rs) are universal in Burkitt lymphoma (BL)1,2; BCL2 rearrangements (BCL2-Rs) occur in ∼85% of follicular lymphomas (FLs),3 and MYC-, BCL2-, and BCL6-Rs occur in ∼8%, ∼25%, and ∼40% of tumors with diffuse large B-cell lymphoma (DLBCL) morphology, respectively.4,5 In DLBCL, BCL2-Rs are almost exclusively found in tumors classified as germinal center B-cell–like (GCB) cell of origin (COO).4,6 In tumors with DLBCL or high-grade (blastoid or intermediate between DLBCL and BL) morphology, the co-occurrence of MYC-R with BCL2-R (high-grade B-cell lymphoma with MYC- and BCL2-R [“double hit”; HGBCL-DH-BCL2]) or BCL6-R (HGBCL-DH-BCL6) is associated with inferior outcomes after standard-of-care R-CHOP (rituximab with cyclophosphamide, doxorubicin, vincristine, and prednisone) chemoimmunotherapy.2,5,7 HGBCL-DH-BCL2 tumors have unifying biology beyond rearrangement status: they are almost always classified as GCB and, along with BL and a subset of GCB-DLBCL tumors, typically express the dark-zone gene expression signature (DZsig), which phenocopies the dark zone of normal germinal centers (GCs).4,8-10 Although MYC-R involving IG loci are associated with inferior outcomes relative to those involving non-IG loci,5,8,11,12 mechanisms enabling diverse MYC rearrangement partners and their relationship to tumor biology have not yet been extensively characterized.
Oncogene rearrangements arise via aberrant activity of physiological mechanisms responsible for generating antibody diversity. BCL2-Rs occur in the bone marrow at the pre/pro–B-cell stage when the IG loci undergo V(D)J recombination, a process mediated by the RAG recombinase enzyme.13 A small population of B cells bearing BCL2-R are commonly detected circulating in the blood of healthy individuals who may never develop lymphoma,14-17 demonstrating that BCL2-R alone is not sufficient for lymphomagenesis but may provide an early survival advantage due to the antiapoptotic function of BCL2. In contrast, MYC-R is a driver of proliferation and is strongly associated with aggressive tumor biology. However, MYC overexpression is also proapoptotic, so MYC-R usually occurs on the background of antiapoptotic events such as BCL2-R in HGBCL-DH-BCL2 or the presence of Epstein-Barr virus (EBV) in BL.1 Indeed, both MYC-R and BCL6-R arise relatively late in lymphomagenesis in the GC through the activity of the activation-induced cytidine deaminase (AID) enzyme.11,18-21 AID has 2 roles in physiological B-cell development: it drives somatic hypermutation (SHM) in the variable region of IG loci and induces double-strand breaks (DSBs) in the constant region of the IGH locus for class-switch recombination (CSR). AID activity is also associated with off-target “aberrant” SHM (aSHM), especially in superenhancers (SEs) and the transcription start sites (TSSs) of highly transcribed genes, which occurs in both mature B-cell neoplasms and normal B cells that have transited the GC.22-29 Many of the regions with evidence of recurrent aSHM, such as BCL6 and PAX5 SEs, are also recurrent non-IG partners of MYC-R.11
The effects of the distinct genetic and developmental backgrounds of different lymphoma entities on the architecture and mechanisms of MYC-R have not yet been well characterized, and there is uncertainty about the relationship of different MYC-R partners to MYC expression and outcomes.30 Here, we present comprehensive characterization of oncogene rearrangements across 883 mature B-cell lymphomas. Using base pair-resolution breakpoint sequences, transcriptomics, aSHM patterns, and flow cytometry data, we provide new mechanistic explanations for the distinct observed rearrangement patterns.
Methods
Patients and samples
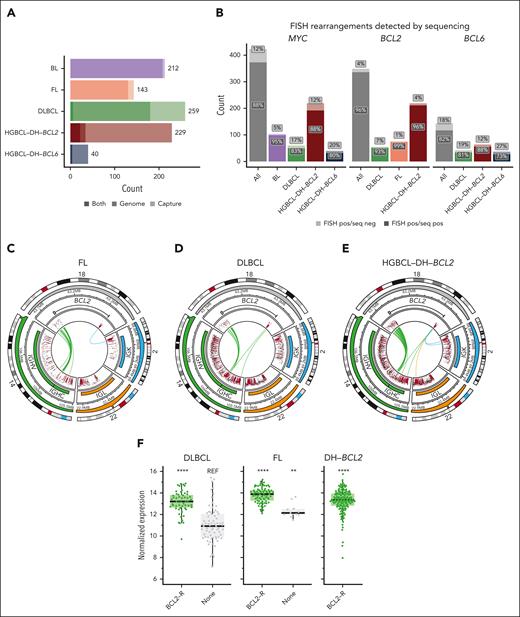
To characterize the architecture of MYC-, BCL2-, and BCL6-Rs, we assembled a cohort of 883 mature B-cell lymphomas across BL (n = 212), FL (n = 143), DLBCL (n = 259), HGBCL-DH-BCL2 (n = 229), and HGBCL-DH-BCL6 (n = 40; Figure 1A; supplemental Tables 1-2, available on the Blood website). These include 622 biopsies with previously published whole genome sequencing (WGS)20,23,31-36 and targeted capture sequencing,11 with complementary RNA sequencing (RNAseq) data when available (supplemental Table 3).9 A total of 261 new biopsies were selected for WGS (n = 12) and/or hybridization capture sequencing (n = 249; supplemental Table 2) using a panel designed to capture the regions around MYC, BCL2, and BCL6 commonly involved in rearrangements, as well as recurrent partner loci: IGH, IGK, IGL, and PAX5 (supplemental Figure 1; supplemental Table 4). New RNAseq data were generated for 198 biopsies and combined with published RNAseq data from 509 biopsies (supplemental Figure 2). Further details of library construction and sequencing are in the supplemental Methods. Diagnosis and morphology of newly sequenced samples were confirmed by central pathology review performed by expert hematopathologists within the Lymphoma/Leukemia Molecular Profiling Project (LLMPP) group. Twenty-five percent of HGBCL-DH-BCL2, 4% of DLBCL, and 5% of HGBCL-DH-BCL6 tumors were from patients with a prior history of FL.
FISH
Fluorescence in situ hybridization (FISH) was performed on tissue microarrays or whole sections with break-apart (BA) probes to identify rearrangements involving MYC, BCL2, and BCL6 for most tumors with DLBCL or high-grade morphology, as described previously (supplemental Table 1).8,37 Limited FISH data were available for published FL and BL cohorts. To characterize the rearrangement architecture in tumors with both MYC::IGH and IGH::BCL2 rearrangements, custom FISH probes targeting chr8 and chr18 were designed, and FISH was performed on paraffin isolated nuclei. More details are available in the supplemental Methods.
Alignment and variant calling
New targeted capture sequencing data were aligned to hg38 with BWA-MEM 0.7.6a. Existing data were kept in their original alignment format. Structural variants (SVs) were identified with an ensemble approach using GRIDSS38 and Manta,39 intersecting SVs from both callers with the BioConductor package StructuralVariantAnnotation.40 SVs with variant allele frequency of <0.05 were removed, and a subset of SVs were subjected to manual review in IGV and either rescued or removed. Simple somatic mutations (SSMs; single nucleotide variants and indels) were identified with a consensus variant calling approach, SLMS-3, using Strelka2,41 LoFreq,42 SAGE, and mutect2,43 as described previously.34,36 Circular plots were generated with the R package Circlize.44 Each circular plot represents mutations and SVs from all tumors of a given entity. SVs and SSMs derived from WGS data aligned to GRCh37 were mapped to the hg38 genome build with CrossMap.45 IG rearrangements were identified from RNAseq data with MiXCR, and assembled BCR sequences were further annotated with IgBLAST.46,47 To analyze somatic variants for signatures of AID activity, variants were extracted from samples with WGS or targeted capture sequencing across regions covered by the capture panel (supplemental Table 5). SigProfiler was used to quantify exposure to the COSMIC single base substitution (SBS)96 signatures and to identify additional de novo signatures.48 When >1 sequencing library was available per biopsy (ie, both genome and capture), all available libraries were analyzed for SVs, and the results were collapsed to 1 rearrangement partner per biopsy (supplemental Table 1). For single nucleotide variant analyses, 1 library per biopsy was selected for analyses, prioritizing genome or Twist capture. Bioinformatic pipelines are available as part of the LCR module repository (https://github.com/LCR-BCCRC/lcr-modules). Statistical analyses were performed in R 4.1.3, and a complete repository of scripts used in statistical analyses and plotting is available at GitHub (https://github.com/LCR-BCCRC/nhl_oncogene_translocations). Statistical comparisons were corrected for multiple testing when applicable.
The study was reviewed and approved by the University of British Columbia/BC Cancer Research Ethics Board in accordance with the Declaration of Helsinki. Sequencing data are deposited at the European Genome-Phenome Archive under study EGAS50000000328.
Results
Sequencing for the identification of rearrangement breakpoints
To characterize the architecture of rearrangements involving MYC, BCL2, and BCL6, breakpoints were identified either by WGS or custom targeted capture sequencing (Figure 1A) encompassing all 3 IG loci, 3.8 MB surrounding the MYC locus, the 5' and 3' flanks of BCL2, and regions flanking BCL6 and PAX5 (supplemental Table 4; supplemental Figure 1). Tumors with DLBCL or high-grade morphology with MYC and BCL2 and/or BCL6 rearrangements detected by FISH or by sequencing were placed in appropriate categories (HGBCL-DH-BCL2 or -BCL6) according to the International Consensus Classification guidelines.2 WGS/capture sequencing identified the translocation breakpoint in 96%, 88%, and 82% of tumors positive for BCL2, MYC, or BCL6 BA-FISH, respectively (Figure 1B; supplemental Tables 6-8). Although recall of MYC-R was higher among tumors sequenced with WGS (supplemental Figure 3A), a generalized linear model revealed that recall for MYC-R was significantly higher among BLs and was not influenced by sequencing type or tissue preservation (supplemental Figure 3B). There was no association between total sequencing depth and SV recall for any of the rearrangements (Wilcoxon test, P < .05).
BCL2 hypermutation status correlates strongly with rearrangements
FISH identified BCL2-Rs in 82% of FL tumors and 22% of DLBCL tumors, consistent with previously published frequencies,8 with 96% of DLBCL BCL2-Rs occurring in tumors classified as GCB (supplemental Table 1). Sequencing data revealed remarkable consistency of BCL2-R architecture across FL, DLBCL, and HGBCL-DH-BCL2 (Figure 1C-E), with 98% of rearrangements involving the IGH locus and only 2% and 0.4% involving IGK and IGL, respectively. Consistent with previous studies,49 IGH::BCL2 rearrangements involved the 3' flank of BCL2 rearranged to D(H) and J(H) loci, whereas IGK::BCL2 and BCL2::IGL rearrangements involved breaks at the 5' end of BCL2 (Figure 1C-E). Unsurprisingly, we observed higher BCL2 messenger RNA expression in BCL2-R cases relative to the non–BCL2-rearranged GCB-DLBCL (Figure 1F). The uniformity of these events across FL, DLBCL, and HGBCL-DH-BCL2 confirms that V(D)J recombination is universally the mechanism giving rise to BCL2-Rs.
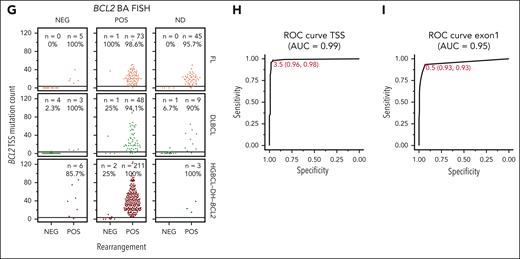
Among the 358 BCL2-Rs identified by sequencing, 17 (5%) occurred in tumors that were BCL2-R negative by BA-FISH (Figure 1G), hereafter referred to as cryptic rearrangements.33 Of 229 HGBL-DH-BCL2 tumors, 7 (3%) harbored cryptic BCL2-Rs. All tumors with cryptic BCL2-R were positive for BCL2 by immunohistochemistry (IHC) compared with only 35% of GCB-DLBCL tumors without BCL2-Rs (supplemental Figure 4). Across FL, DLBCL, and HGBCL-DH-BCL2, tumors harboring sequencing-confirmed BCL2-Rs had multiple coding and noncoding mutations around the BCL2 TSS, whereas those without rearrangements had few or no mutations (Figure 1G). Notably, these mutations occur far from the position of most IGH::BCL2 breakpoints, which are predominantly >200 kb away at the 3' end of the BCL2 gene (Figure 1C-E), showing that aSHM is targeted to the distal TSS in translocated tumors and not to the translocation breakpoint. The number of BCL2 mutations could be used to predict the presence of a rearrangement with very high sensitivity and specificity (receiver operating characteristic [ROC] area under the curve [AUC], 0.99) with an optimal cutoff of ≥4 TSS mutations to identify tumors with BCL2-Rs (Figure 1H). The presence of at least 1 BCL2 coding mutation in exon 1 (the region covered by typical exome and targeted sequencing panels) was less accurate in predicting rearrangement status (ROC AUC, 0.95; Figure 1I). Using the presence of a rearrangement detected by sequencing as truth, we calculated the accuracy of FISH or the presence of ≥4 TSS mutations for identifying BCL2-R. In all tumors or within each lymphoma entity or sequencing type, using mutations to identify BCL2-R was equal to or significantly more accurate than FISH (McNemar test; supplemental Table 9). Although short-read sequencing cannot definitively demonstrate that aSHM of BCL2 occurs on the same allele as the IGH::BCL2 rearrangement, these data strongly support that BCL2 mutations are a consequence of SHM targeting the IG locus to which BCL2 is rearranged and are an excellent proxy for BCL2 rearrangements.
MYC-R partners vary across lymphoma entities
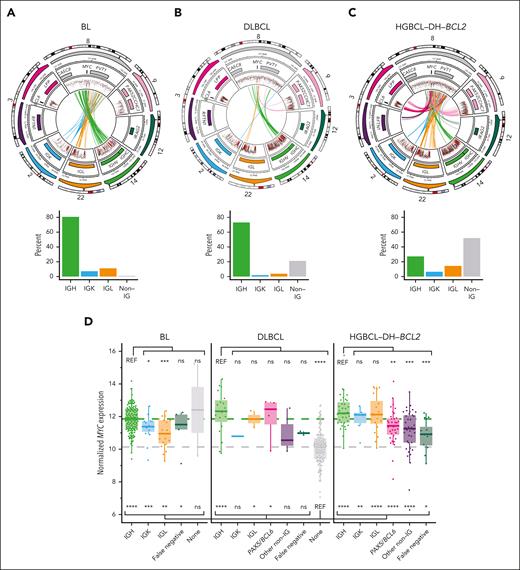
In both BL and DLBCL with sole MYC-Rs, MYC was rearranged to IGH in >70% of tumors (Figure 2A-B). In BL, non-IGH MYC-R involved IGL and IGK, whereas DLBCL non-IGH MYC-R typically involved non-IG loci such as PAX5. In contrast, only 27% of MYC-Rs in HGBCL-DH-BCL2 tumors involved IGH, whereas 51% involved non-IG partners, including frequently BCL6, PAX5, IRAG2, and RFTN1 (Figure 2C). In total, 22 of 453 MYC-Rs were cryptic to BA-FISH (4.8%), and 10 of 229 HGBCL-DH-BCL2 tumors (4.3%) were reclassified from DLBCL-NOS (not otherwise specified) or HGBCL-NOS based on the presence of a cryptic MYC-R. Of 53 DZsig+ tumors that were negative for BCL2-R and/or MYC-R by BA-FISH, 10 (18.9%) had cryptic rearrangements leading to their reclassification as HGBCL-DH-BCL2, a rate in keeping with the 30% we reported previously using a smaller cohort (P > .05, Fisher exact test).33 As demonstrated previously, MYC::IGH rearrangements consistently occur centromeric to MYC, focused in the 5' flank, 5' untranslated region (UTR), and intron 1 of MYC, whereas non-IGH rearrangements are consistently telomeric, occurring up to 600 kb downstream of the MYC gene (supplemental Figure 5).11 RNAseq revealed consistently elevated MYC expression in all groups of MYC-R partners across BL, DLBCL, and HGBCL-DH-BCL2 relative to MYC-R-negative DLBCL, although the highest levels of MYC expression were associated with MYC::IG rearrangements (Figure 2D).
MYC-Rs frequently involve non-IG loci in HGBCL-DH-BCL2. (A-C) Diagrams showing the architecture of MYC-R (top row) and relative frequency (bottom row) of different rearrangement partners across BL (A), DLBCL (B), and HGBCL-DH-BCL2 (C). In each circular plot, the outermost ring gives the chromosome ideogram, followed by a genomic coordinate scale, a gene coordinate track, and a rainfall plot of intermutation distance with points colored according to whether the mutation overlaps the canonical AID WRCY motif (red) or not (black). Mutations are only shown in regions covered by the targeted capture panel and include tumors without rearrangements. Innermost lines show the linkages between MYC and the most common rearrangement partners. (D) MYC expression measured from RNAseq data across different lymphoma entities, stratified by rearrangement partner group. FDR-corrected Wilcoxon tests compare expression to DLBCL with no MYC-R (“none”; below the boxplots) or to tumors with MYC::IGH rearrangements within each entity (above the boxplots). “False negative” indicates tumors that were positive for MYC-R by FISH but the rearrangement was not identified by sequencing. ns, not significant; REF, reference group; ∗P < .05; ∗∗P < .01; ∗∗∗P < .001; ∗∗∗∗P < .0001.
MYC-Rs frequently involve non-IG loci in HGBCL-DH-BCL2. (A-C) Diagrams showing the architecture of MYC-R (top row) and relative frequency (bottom row) of different rearrangement partners across BL (A), DLBCL (B), and HGBCL-DH-BCL2 (C). In each circular plot, the outermost ring gives the chromosome ideogram, followed by a genomic coordinate scale, a gene coordinate track, and a rainfall plot of intermutation distance with points colored according to whether the mutation overlaps the canonical AID WRCY motif (red) or not (black). Mutations are only shown in regions covered by the targeted capture panel and include tumors without rearrangements. Innermost lines show the linkages between MYC and the most common rearrangement partners. (D) MYC expression measured from RNAseq data across different lymphoma entities, stratified by rearrangement partner group. FDR-corrected Wilcoxon tests compare expression to DLBCL with no MYC-R (“none”; below the boxplots) or to tumors with MYC::IGH rearrangements within each entity (above the boxplots). “False negative” indicates tumors that were positive for MYC-R by FISH but the rearrangement was not identified by sequencing. ns, not significant; REF, reference group; ∗P < .05; ∗∗P < .01; ∗∗∗P < .001; ∗∗∗∗P < .0001.
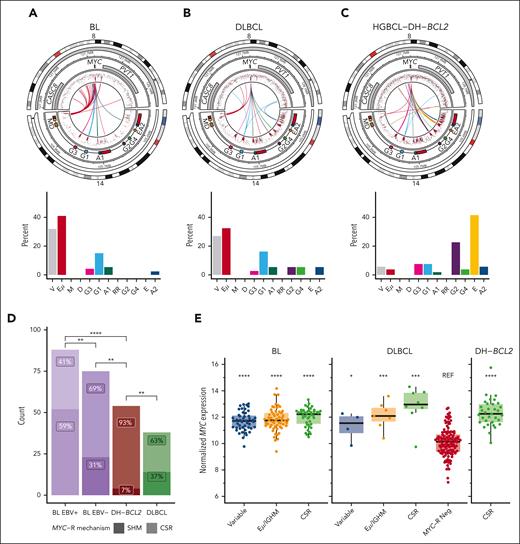
We next examined the more granular architecture of MYC-R involving the IGH locus. BL and DLBCL are both dominated by MYC-Rs involving either the variable region or the IGH enhancer Eμ (Figure 3A-B). MYC-Rs involved CSR acceptor regions more frequently in DLBCL than in BL, and the rare acceptor region rearrangements in BL were almost completely restricted to constant genes proximal to the first 3' regulatory region enhancer (Figure 3A-B). In contrast, in HGBCL-DH-BCL2, MYC::IGH rearrangements almost exclusively involved CSR acceptor regions, most often IGHE (Figure 3C). Previously, analysis of MYC::IGH rearrangements in BL demonstrated a higher frequency of rearrangements attributable to CSR in EBV-negative BL, along with a propensity for genic breakpoints occurring in the 5' UTR and intron 1 of MYC.20 To extend this finding, we identified physiological CSR events involving IGHM and any downstream acceptor switch region to define the boundary separating SHM from CSR at IGHM and Eμ (supplemental Figure 6A). Using this boundary, 60% to 70% of MYC::IGH rearrangements were associated with CSR in DLBCL and EBV– BL, whereas 93% of MYC::IGH rearrangements in HGBCL-DH-BCL2 were associated with CSR (Figure 3D). In all groups except EBV+ BL, the breakpoints in MYC were predominantly genic (supplemental Figure 6B-D). Although MYC::IGH rearrangements frequently occur in the regions attributed to the IGHM donor switch region in BL, the paucity of CSR and lack of SHM at acceptor loci suggests that the mechanism driving these rearrangements in BL differs from physiological CSR. Relative to DLBCL without MYC-R, MYC::IGH rearrangements are associated with elevated MYC expression regardless of the region of IGH involved (Figure 3E). Notably, the IGH acceptor regions at the TSS of each heavy-chain gene have been extensively hypermutated in both DLBCL and HGBCL-DH-BCL2 (Figure 3A-C), which may reflect high levels of AID activity and propensity for CSR and/or MYC-Rs involving the IGH constant gene (IGHC) region in these entities.
MYC::IGH rearrangements arise by distinct mechanisms across lymphoma entities. (A-C) Diagrams showing the architecture of MYC::IGH rearrangements at high resolution (top row) and the frequency of each rearrangement partner (bottom row) across BL (A), DLBCL (B), and HGBCL-DH-BCL2 (C). In each circular plot, the outermost ring gives the chromosome ideogram, followed by a genomic coordinate scale, a gene coordinate track including Eμ and 3' regulatory region enhancers in red, and a rainfall plot of intermutation distance with points colored according to whether the mutation overlaps the canonical AID WRCY motif (red) or not (black), including mutations from tumors without rearrangements. Innermost lines show the linkages between MYC and IGH. (D) The frequency of MYC::IGH rearrangements attributable to either CSR or SHM. The frequency of each type of event was compared by FDR-corrected pairwise Fisher exact tests. (E) Expression of MYC determined from RNAseq data, stratified by the region of IGH to which MYC is rearranged. FDR-corrected Wilcoxon tests were used to compare expression levels of each group with DLBCL without MYC-R (“MYC-R Neg”). No RNAseq data were available for any of the HGBCL-DH-BCL2 tumors with MYC-R involving variable or Eμ/IGHM regions. ∗P < .05; ∗∗P < .01; ∗∗∗P < .001; ∗∗∗∗P < .0001. REF, reference group.
MYC::IGH rearrangements arise by distinct mechanisms across lymphoma entities. (A-C) Diagrams showing the architecture of MYC::IGH rearrangements at high resolution (top row) and the frequency of each rearrangement partner (bottom row) across BL (A), DLBCL (B), and HGBCL-DH-BCL2 (C). In each circular plot, the outermost ring gives the chromosome ideogram, followed by a genomic coordinate scale, a gene coordinate track including Eμ and 3' regulatory region enhancers in red, and a rainfall plot of intermutation distance with points colored according to whether the mutation overlaps the canonical AID WRCY motif (red) or not (black), including mutations from tumors without rearrangements. Innermost lines show the linkages between MYC and IGH. (D) The frequency of MYC::IGH rearrangements attributable to either CSR or SHM. The frequency of each type of event was compared by FDR-corrected pairwise Fisher exact tests. (E) Expression of MYC determined from RNAseq data, stratified by the region of IGH to which MYC is rearranged. FDR-corrected Wilcoxon tests were used to compare expression levels of each group with DLBCL without MYC-R (“MYC-R Neg”). No RNAseq data were available for any of the HGBCL-DH-BCL2 tumors with MYC-R involving variable or Eμ/IGHM regions. ∗P < .05; ∗∗P < .01; ∗∗∗P < .001; ∗∗∗∗P < .0001. REF, reference group.
HGBCL-DH-BCL2 tumors experience more SHM at MYC partner loci
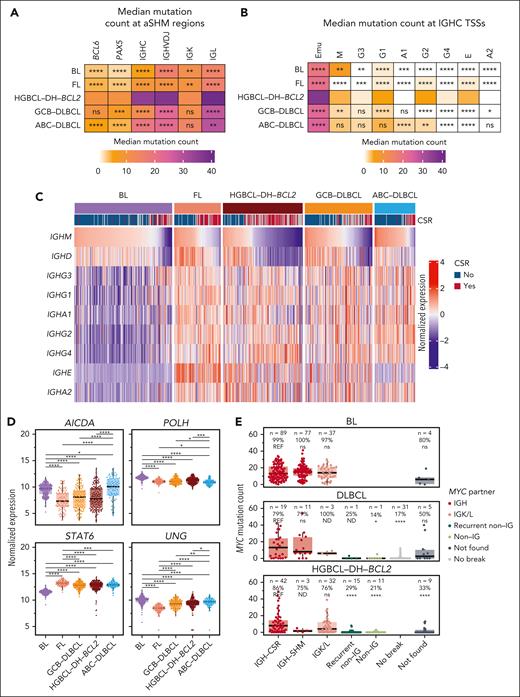
To explore the relationship between aSHM and MYC-R partners in HGBCL-DH-BCL2, we quantified mutation frequencies across the regions covered by our targeted capture assay. BCL6, PAX5, IGK, and parts of the IGH locus experienced elevated mutation rates in HGBCL-DH-BCL2 relative to BL, FL, and DLBCL (Figure 4A; supplemental Figure 7). Both IGHC and IGK, but not other regions, had more mutations in HGBCL-DH-BCL2 when MYC was rearranged to these loci (supplemental Figure 6A). Mutation signature analysis across recurrent MYC partner loci identified exposure to SBS84, the signature of canonical AID activity (supplemental Figure 8B-C).50 All regions also had significantly more mutations overlapping the canonical WRCY AID motif than expected (supplemental Figure 8D-E).
HGBCL-DH-BCL2 experience elevated SHM across MYC partner loci. (A) Median mutation counts across recurrent MYC partner loci covered by the targeted capture sequencing assay. (B) Mutation counts per tumor within the IGH Eμ enhancer and TSS of each constant gene. IGHM was separated from Eμ using the boundary defined in supplemental Figure 6A. In panels A-B, HGBCL-DH-BCL2 was used as the reference group for FDR-corrected Wilcoxon tests to identify significant differences in mutation counts for each locus. (C) A row-normalized heat map showing expression levels of each IGH constant gene determined by RNAseq. Samples are ordered according to IGHM expression. The CSR track indicates whether each tumor was predicted to express a functional IGHM/D (no) or a different IGHC gene (yes). (D) Expression levels of genes that may be involved in the regulation of aSHM and/or CSR compared with pairwise FDR-corrected Wilcoxon tests. (E) Mutation counts at the MYC TSS stratified by lymphoma entity and MYC rearrangement partner or predicted IGH rearrangement mechanism. The number and percentage of tumors with ≥1 mutation in the MYC TSS are indicated above each grouping. Within each entity, FDR-corrected Wilcoxon tests were used to compare the mutation counts for each MYC-R partner/mechanism group (with at least 4 tumors) with that of IGH-CSR. ns, not significant; ∗P < .05; ∗∗P < .01; ∗∗∗P < .001; ∗∗∗∗P < .0001. IGHC, constant region of IGH locus; IGHVDJ, variable (V), diversity (D), and joining (J) region of the IGH locus; ND, not done; REF, reference group.
HGBCL-DH-BCL2 experience elevated SHM across MYC partner loci. (A) Median mutation counts across recurrent MYC partner loci covered by the targeted capture sequencing assay. (B) Mutation counts per tumor within the IGH Eμ enhancer and TSS of each constant gene. IGHM was separated from Eμ using the boundary defined in supplemental Figure 6A. In panels A-B, HGBCL-DH-BCL2 was used as the reference group for FDR-corrected Wilcoxon tests to identify significant differences in mutation counts for each locus. (C) A row-normalized heat map showing expression levels of each IGH constant gene determined by RNAseq. Samples are ordered according to IGHM expression. The CSR track indicates whether each tumor was predicted to express a functional IGHM/D (no) or a different IGHC gene (yes). (D) Expression levels of genes that may be involved in the regulation of aSHM and/or CSR compared with pairwise FDR-corrected Wilcoxon tests. (E) Mutation counts at the MYC TSS stratified by lymphoma entity and MYC rearrangement partner or predicted IGH rearrangement mechanism. The number and percentage of tumors with ≥1 mutation in the MYC TSS are indicated above each grouping. Within each entity, FDR-corrected Wilcoxon tests were used to compare the mutation counts for each MYC-R partner/mechanism group (with at least 4 tumors) with that of IGH-CSR. ns, not significant; ∗P < .05; ∗∗P < .01; ∗∗∗P < .001; ∗∗∗∗P < .0001. IGHC, constant region of IGH locus; IGHVDJ, variable (V), diversity (D), and joining (J) region of the IGH locus; ND, not done; REF, reference group.
Analysis of the IGH locus reveals that the TSS of most constant genes had a significantly higher mutation burden in HGBCL-DH-BCL2 relative to other lymphoma entities (Figure 4B; supplemental Figure 9A). CSR is targeted to different constant genes via germ line transcription, which creates the conditions for AID to induce DSBs required for completion of CSR.51 Consistent with this, expression of each constant gene was lowest in BL, corresponding to the low rates of SHM (Figure 4C; supplemental Figure 9B).20,31 In contrast, FLs have high levels of germ line transcription across the IGHC genes but low SHM (Figure 4B-C), suggesting low AID activity consistent with globally lower rates of aSHM observed in FL.36 At IGHE, the most common MYC::IGH rearrangement partner, SHM was highest in HGBCL-DH-BCL2 relative to other lymphoma entities (Figure 4B-C). Notably, the canonical AID signature SBS84 was not identified in the IGH constant region, and instead, de novo signatures involving C>T mutations predominated, suggesting differences in the cofactors and DNA repair mechanisms working alongside AID in the formation of these mutations relative to that observed in canonical SHM target loci (supplemental Figure 8B-C).51
We reasoned that the differences in aSHM rates could also be explained by differential expression of AID and associated DNA repair enzymes. However, contrary to observed SHM rates, the expression of AICDA (AID) and DNA repair enzymes POLH (DNA polymerase η) and UNG (uracil N-glycosylase) is consistently higher in BL relative to FL, GCB-DLBCL, and HGBCL-DH-BCL2 (Figure 4D), suggesting that high expression of these genes is insufficient to drive widespread aSHM. Germ line transcription of IGH constant genes has also been attributed to the transcription factor STAT6,52-54 so we reasoned that its expression may also be associated with the hypermutation observed at IGHC genes. Indeed, expression of STAT6 is lowest in BL in which IGHC hypermutation and germ line transcription are lowest (Figure 4D).
As observed for BCL2, SHM of the MYC TSS was almost exclusively found in tumors with MYC::IG rearrangements (Figure 4E). Tumors with MYC::IGK/L rearrangements, which occur up to 600 kb downstream of MYC (supplemental Figure 3), had SHM of the MYC TSS comparable with that observed in MYC::IGH rearrangements. This suggests that SHM of the MYC TSS requires MYC overexpression driven by IG SEs, similar to the SHM pattern observed for BCL2, and suggests that other mechanisms besides aSHM may explain the origin of DSBs and rearrangements at MYC.55 Because of the lack of aSHM associated with non-IG MYC-R, aSHM is not a reliable proxy for MYC-R in tumors with DLBCL or high-grade morphology.
HGBCL-DH-BCL2 tumors are frequently class switched
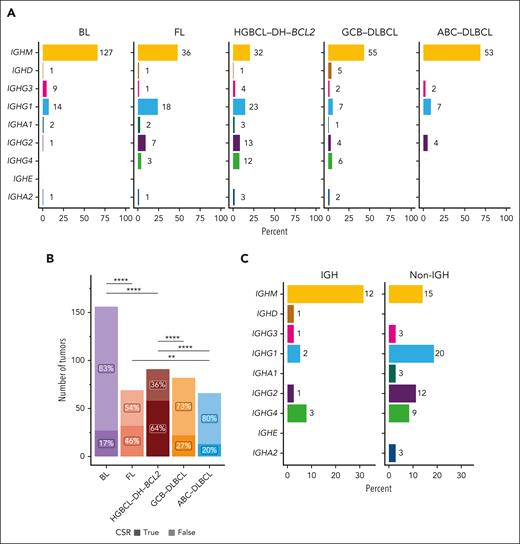
Given the high rates of SHM at CSR acceptor sites and CSR-type MYC-R in HGBCL-DH-BCL2, we hypothesized that these tumors would also demonstrate evidence of successful CSR more frequently. We used MiXCR and IgBLAST to predict IG gene usage from RNAseq data and validated the MiXCR-predicted light chain against flow cytometry data, when available (supplemental Figure 10A-B; supplemental Table 10). Across lymphoma entities, HGBCL-DH-BCL2 was most frequently class switched, with only 20% of tumors expressing IGHM or IGHD, whereas, as expected, ABC-DLBCL (activated B-cell COO) and BL were rarely class switched (Figure 5A-B).56-58 Within HGBCL-DH-BCL2, CSR was observed more frequently in tumors with non-IGH MYC-R, whereas most tumors with MYC::IGH rearrangements expressed IGHM (Fisher exact test odds ratio, 4.9; 95% confidence interval, 1.5-16.7; P = .005; Figure 5C).
HGBCL-DH-BCL2 tumors are frequently class switched. (A) Constant gene usage predicted from RNAseq data with MiXCR across lymphoma entities. The x-axis indicates the percent of tumors within each entity, whereas numbers at each bar indicate the absolute number of tumors predicted to use each constant gene. (B) The proportion of each lymphoma entity with predicted CSR (IGH constant gene other than IGHM or IGHD). The frequency of CSR between entities was compared with FDR-corrected pairwise Fisher exact tests. ∗∗P < .01; ∗∗∗∗P < .0001. (C) Constant gene usage in HGBCL-DH-BCL2 stratified by MYC-R partner.
HGBCL-DH-BCL2 tumors are frequently class switched. (A) Constant gene usage predicted from RNAseq data with MiXCR across lymphoma entities. The x-axis indicates the percent of tumors within each entity, whereas numbers at each bar indicate the absolute number of tumors predicted to use each constant gene. (B) The proportion of each lymphoma entity with predicted CSR (IGH constant gene other than IGHM or IGHD). The frequency of CSR between entities was compared with FDR-corrected pairwise Fisher exact tests. ∗∗P < .01; ∗∗∗∗P < .0001. (C) Constant gene usage in HGBCL-DH-BCL2 stratified by MYC-R partner.
MYC-Rs are constrained by the preceding BCL2-R
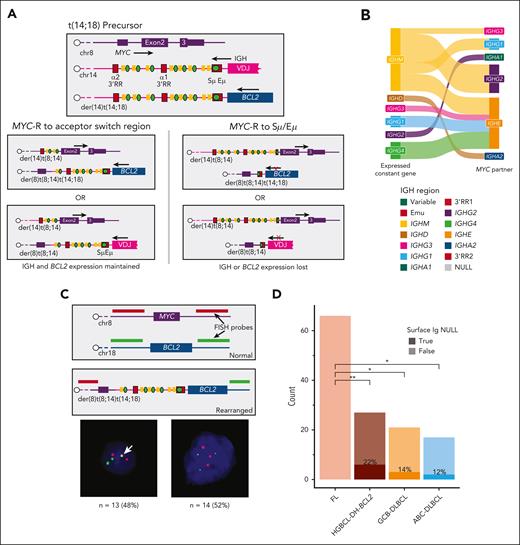
Together, the data on MYC-R, CSR, and SHM present a contradiction: although HGBCL-DH-BCL2 present very high levels of SHM across the Eμ and IGHM switch region, MYC-R were virtually never observed at these loci (Figures 2C and 3C). We hypothesized that this could be due to the dependence on sustained expression of both a functional BCR and the BCL2 allele rearranged to IGH. Considering the topology of the 2 IGH alleles before the formation of the MYC-R, it is possible for MYC::IGH rearrangements to involve either the IGH::BCL2 allele,59 creating a der(8)t(8;14)t(14;18) chromosome, or the normal IGH allele creating separate der(8)t(8;14),der(14)t(14;18) chromosomes (Figure 6A). In either case, a MYC-R involving Eμ would disrupt the expression of either BCR or BCL2, whereas those involving CSR acceptor regions downstream of the expressed constant gene would preserve the expression of both. We compared the MiXCR–predicted expressed constant gene with the partner locus in MYC::IGH-rearranged HGBCL-DH-BCL2 and confirmed that all MYC::IGH events but 1 involved a CSR acceptor region downstream of the expressed constant gene (Figure 6B). To determine the frequency of rearrangements involving the IGH or IGH::BCL2 alleles, we created custom FISH probes that would distinguish der(8)t(8;14)t(14;18) involving a single IGH allele from der(8)t(8;14),der(14)t(14;18) involving both IGH alleles (Figure 6C; supplemental Figure 11). Of 27 HGBCL-DH-BCL2 tumors with MYC::IGH rearrangements, 13 (48%) had a fusion indicating a der(8)t(8;14)t(14;18) rearrangement (Figure 6C; supplemental Table 11). We next sought to confirm the preservation of both BCL2 and BCR expression in HGBCL-DH-BCL2. BCL2 IHC is positive in 95% of HGBCL-DH-BCL2, demonstrating that BCL2 expression is consistently preserved (supplemental Table 1). Using flow cytometry data, we found that 78% of HGCBL-DH-BCL2 had detectable surface IG expression; however, 100% of FLs had detectable surface IG (Figure 6D). Because FL and HGBCL-DH-BCL2 evolve from consistent common precursor cell populations,34,60 this result may indicate that BCR expression is essential at the time that the MYC-R is acquired, and the loss of BCR expression in HGBCL-DH-BCL2 occurs only after additional aberrations permit it.
MYC-R are constrained by the preceding BCL2-R. (A) Diagrams showing the topology of MYC and IGH alleles in a precursor cell harboring a IGH::BCL2 rearrangement, followed by the possible positions of rearrangements and their effects on BCL2 and BCR expression. (B) A Sankey diagram comparing the MiXCR-predicted expressed constant gene vs the MYC partner in HGBCL-DH-BCL2 tumors with MYC::IGH rearrangements. The figure legend gives the order of all constant genes and enhancer regions as they appear in the genome. (C) A custom FISH assay designed to identify MYC-R involving the der(14)t(14;18) chromosome, with representative examples of FISH patterns identified. The white arrow indicates the fusion observed in tumors with der(8)t(8;14)t(14;18). (D) The frequency of surface Ig expression determined by flow cytometry, compared with FDR-corrected pairwise Fisher exact tests. RR, regulatory region; ∗P < .05; ∗∗P < .01.
MYC-R are constrained by the preceding BCL2-R. (A) Diagrams showing the topology of MYC and IGH alleles in a precursor cell harboring a IGH::BCL2 rearrangement, followed by the possible positions of rearrangements and their effects on BCL2 and BCR expression. (B) A Sankey diagram comparing the MiXCR-predicted expressed constant gene vs the MYC partner in HGBCL-DH-BCL2 tumors with MYC::IGH rearrangements. The figure legend gives the order of all constant genes and enhancer regions as they appear in the genome. (C) A custom FISH assay designed to identify MYC-R involving the der(14)t(14;18) chromosome, with representative examples of FISH patterns identified. The white arrow indicates the fusion observed in tumors with der(8)t(8;14)t(14;18). (D) The frequency of surface Ig expression determined by flow cytometry, compared with FDR-corrected pairwise Fisher exact tests. RR, regulatory region; ∗P < .05; ∗∗P < .01.
BCL6-Rs do not constrain MYC-Rs
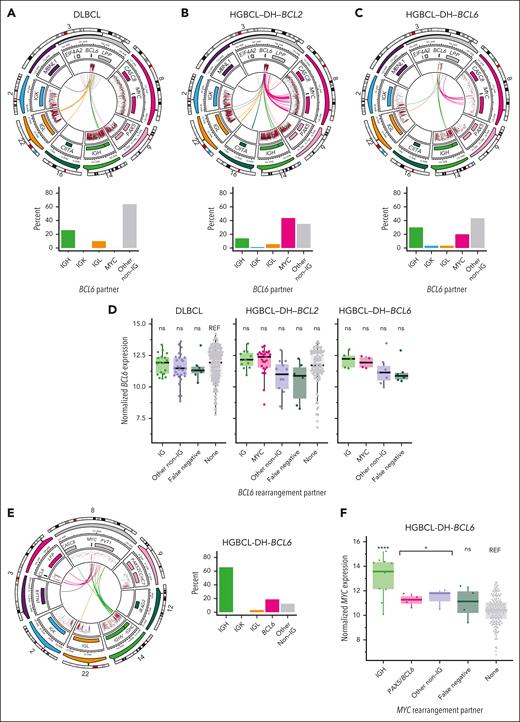
BCL6-Rs may occur alone or together with MYC-R and/or BCL2-R. In DLBCL, BCL6 was frequently rearranged to IGH or IGK, but more frequently, the BA-FISH pattern for BCL6 was explained by recurrent intrachromosomal events (Figure 7A; supplemental Table 8). In HGBCL-DH-BCL2, most BCL6-R involved MYC as the partner locus (Figure 7B). In HGBCL-DH-BCL6, 20% of BCL6-R involved MYC (Figure 7C). Like MYC, BCL6 had several recurrent non-IG rearrangement partners including PAX5 and other known targets of aSHM (Figure 7A-C). None of the BCL6 partners are associated with increased BCL6 expression compared with that observed in DLBCL without BCL6-Rs (Figure 7D), consistent with a previous study that found no difference in BCL6 IHC in DLBCL with and without BCL6-R.61 In HGBCL-DH-BCL2, BCL6::IGH rearrangements more frequently involved CSR acceptor regions, whereas, in DLBCL and HGBCL-DH-BCL6, rearrangements predominantly involved Eμ (supplemental Figure 12). Overall, BCL6::IGH rearrangement patterns are similar to MYC-R and consistent with the role of aSHM/CSR in the formation of these rearrangements.
BCL6-R architecture. (A-C) Diagrams showing the architecture of MYC::IGH rearrangements at high resolution (top row) and the frequency of each rearrangement partner (bottom row) across DLBCL (A), HGBCL-DH-BCL2 (B), and HGBCL-DH-BCL6 (C). In each circular plot, the outermost ring gives the chromosome ideogram, followed by a genomic coordinate scale, a gene coordinate track, and a rainfall plot of intermutation distance with points colored according to whether the mutation overlaps the canonical AID WRCY motif (red) or not (black). Innermost lines show the linkages between BCL6 and IGH. (D) BCL6 expression measured from RNAseq data, stratified by lymphoma entity and BCL6-R partner. FDR-corrected Wilcoxon tests compared the expression of BCL6 stratified by rearrangement partner with that of DLBCL without BCL6-R. (E) Diagram showing MYC-R architecture in HGBCL-DH-BCL6. (F) MYC expression determined in HGBCL-DH-BCL6. FDR-corrected Wilcoxon tests compared the expression of MYC::IGH, all MYC::non-IGH, or false negative (tumors in which the MYC partner was not identified by sequencing) with the expression of MYC in DLBCL without MYC-R (“none”). ns, not significant; ∗P < .05; ∗∗∗∗P < .0001.
BCL6-R architecture. (A-C) Diagrams showing the architecture of MYC::IGH rearrangements at high resolution (top row) and the frequency of each rearrangement partner (bottom row) across DLBCL (A), HGBCL-DH-BCL2 (B), and HGBCL-DH-BCL6 (C). In each circular plot, the outermost ring gives the chromosome ideogram, followed by a genomic coordinate scale, a gene coordinate track, and a rainfall plot of intermutation distance with points colored according to whether the mutation overlaps the canonical AID WRCY motif (red) or not (black). Innermost lines show the linkages between BCL6 and IGH. (D) BCL6 expression measured from RNAseq data, stratified by lymphoma entity and BCL6-R partner. FDR-corrected Wilcoxon tests compared the expression of BCL6 stratified by rearrangement partner with that of DLBCL without BCL6-R. (E) Diagram showing MYC-R architecture in HGBCL-DH-BCL6. (F) MYC expression determined in HGBCL-DH-BCL6. FDR-corrected Wilcoxon tests compared the expression of MYC::IGH, all MYC::non-IGH, or false negative (tumors in which the MYC partner was not identified by sequencing) with the expression of MYC in DLBCL without MYC-R (“none”). ns, not significant; ∗P < .05; ∗∗∗∗P < .0001.
Unlike in HGBCL-DH-BCL2, 65% of MYC-R involved IGH in HGBCL-DH-BCL6 even when BCL6 was also rearranged to IGH (Figure 7E), a pattern consistent with MYC-R in single-hit DLBCL (Figure 2B). Of 26 HGBCL-DH-BCL2 in which both MYC and BCL6-R were identified by sequencing, 17 had MYC::IGH rearrangements, and 8 of these had concurrent BCL6::IGH rearrangements. Although few HGBCL-DH-BCL6 tumors had RNAseq data, MYC expression was significantly elevated relative to DLBCL without MYC-R (Figure 7F).
Discussion
The genome of normal B cells is uniquely vulnerable to somatic mutations and SVs due to the processes involved in generating BCR diversity and affinity. Aggressive B-cell lymphomas, which persist in a state that phenocopies GC B cells, are subject to ongoing SHM in which AID is targeted to highly expressed genes. Our data confirm that the oncogenes MYC and BCL2, which are only transiently expressed or repressed, respectively, during the GC reaction and are not targets of AID activity in normal GC and memory B cells,24,62-64 usually only experience SHM when translocated to IG loci, which are themselves targets of abundant SHM. For BCL2, but not MYC, this translocation-induced SHM is a very accurate proxy for the presence of rearrangements, even when cryptic to BA-FISH. This could be exploited to identify BCL2-R in targeted sequencing assays designed to perform genetic subgroup classification (ie, LymphGen60) in tumors with DLBCL morphology. In contrast, BCL6 is extensively hypermutated in DLBCL, HGBCL-DH-BCL2, and HGBCL-DH-BCL6 and is a target of aSHM in normal B cells.24 Together with the equivocal effect on expression of BCL6 in tumors with BCL6-R, these data show that BCL6 is highly expressed independent of rearrangements. Notably, our data demonstrate that BCL6::MYC and other MYC::non-IG rearrangements do drive elevated MYC expression,30 which may contribute to the high rate of DZsig expression observed in HGBCL-DH-BCL2 with non-IG MYC-R.8
The distinct patterns of MYC-R observed in HGBCL-DH-BCL2 appear to be driven by a combination of opportunity and constraint. Opportunity is created through abundant aSHM across several genomic regions, which likely contributes to the promiscuity of MYC-R partners in these tumors. We postulate that the burst of MYC expression that occurs on GC (re-)entry and in B cells selected for DZ re-entry creates the conditions for MYC-R with AID-mediated DSBs at partner loci. An intriguing possibility is that the burst of MYC expression involves its localization to transcriptional hubs that also drive high expression of GC-specific genes, encompassing known MYC partners, resulting in proximity within 3-dimensional nuclear architecture.65-67 This proximity may facilitate rearrangement through erroneous nonhomologous end joining repair of AID-mediated DSBs.68 Recent evidence suggests that CSR occurs on GC (re-)entry, with this being the likely juncture for MYC::IGH rearrangement, which, in HGBCL-DH-BCL2, occurs in a pool of BCL2-R memory-like B cells. A novel finding of this study was the high rate of MYC::IGHE partnership seen exclusively in HGBCL-DH-BCL2. Immunoglobulin E (IgE)–expressing B cells can be produced by CSR from IgM- or IgG-expressing B cells, resulting in low- and high-affinity IgE, respectively.69-71 These 2 routes to IgE expression are mirrored in the patterns of IGH constant region expression in HGBCL-DH-BCL2 tumors with MYC::IGHE rearrangements, which express either IgM or IgG, although it is not yet clear what signals drive the failed attempt to class switch to IgE in these tumors. If CSR precedes the MYC::IGH rearrangement, the region between IGHM and the acceptor switch region is deleted, leading to fewer opportunities for MYC::IGH rearrangements to form in class switched cells. Thus, an alternative hypothesis for the high rate of MYC::IGHE is that it merely reflects the restricted availability of IGH constant regions for rearrangement.
Constraint manifests in MYC-R that preserve both BCR and BCL2 expression in HGBCL-DH-BCL2, in which, unlike single-hit MYC-R lymphomas, 1 of the 2 IGH alleles is already disrupted by an IGH::BCL2 rearrangement. Given the proapoptotic effects of MYC overexpression, preservation of the antiapoptotic effects of BCL2 overexpression may be required for survival. Although we did observe some examples of loss of functional BCR expression in HGBCL-DH-BCL2, 100% of FLs retained BCR expression, suggesting that its expression is essential to the common precursor cells that give rise to both FL and HGBCL-DH-BCL234,35,60,72,73 at the moment when the MYC-R is acquired and may be lost subsequently after additional compensatory mutations have been acquired. Loss of BCR expression may correlate with acquired independence from the tumor microenvironment observed in HGBCL-DH-BCL2 and DZsig+ tumors,9 and ongoing SHM across the IG loci may contribute to the eventual loss of BCR expression. Constraint would also contribute to the promiscuity of MYC-R partners in HGBCL-DH-BCL2. Although these tumors have ostensibly the greatest opportunity to form MYC::IGH rearrangements through abundant IGH SHM, any event that would disrupt BCR and/or BCL2 expression would be selected against, thus leading to a larger proportion of MYC-R involving other loci.
The data presented here provide a comprehensive and detailed characterization of oncogene rearrangement architecture across aggressive B-cell lymphomas. Although lymphomas with a single-hit MYC-R and HGBCL-DH-BCL6 have similar patterns of rearrangements involving mostly MYC::IGH, HGBCL-DH-BCL2 have distinct rearrangement architecture that sets them apart. By leveraging SSM and SV data, along with gene expression and IG rearrangement data from RNAseq, we have identified new mechanistic explanations for the distinct patterns of MYC-R observed in different lymphomas.
Acknowledgments
This study was supported by grants from the National Institutes of Health, National Cancer Institute (1P01CA229100), the Canadian Cancer Society Research Institute (704848 and 705288), Terry Fox Research Institute (TFRI) Program Project Grants (1061 and 1108), the TFRI Marathon of Hope Cancer Centre Network, and the Genome BC Marathon of Hope Cancer Centre Network (MOH001). This study was also supported by a Large Scale Applied Research Project funded by Genome Canada (13124), Genome BC (271LYM), Canadian Institutes of Health Research (CIHR) (GP1-155873, PJT-183895), the British Columbia Cancer Foundation, and the Provincial Health Services Authority. R.D.M. and C.S. are supported by Michael Smith Foundation for Health Research, Career Investigator Awards. D.W.S. is supported by a Michael Smith Foundation for Health Research, Health Professional Investigator Award. B.C. is supported by a CIHR Canada Graduate Scholarship Doctoral Award.
Authorship
Contribution: L.K.H., B.C., S.B.-N., A.J.M., C.S., L.M.R., R.D.M., and D.W.S. contributed to the experimental design; L.K.H., H.S., M.C., A.P.W., S.B.-N., B.C., and R.D.M. performed data analysis; L.K.H. and S.B.-N. prepared the figures; S.B.-N., W.A., L.H.S., K.J.S., D.W.S., M.B., and B.M. contributed to clinical data collection and management; G.W.S., P.F., T.M.-T., J.R.C., S.L.O., G.O., A.R., E.C., C.A., T.C.G., P.W.R., J.Y.S., G.I., E.S.J., D.D.W., W.C.C., K.B., K.F., J.D., S.P., A.L.F., and L.M.R. contributed to pathology review and provision of materials; L.K.H. and D.W.S. wrote the manuscript; and all authors contributed to data interpretation and manuscript review and approved the manuscript for submission.
Conflict-of-interest disclosure: D.W.S., R.D.M., L.M.R., G.W., L.M.S., E.C., T.C.G., J.R.C., K.F., E.S.J., A.R., W.C.C., G.I., J.D., and D.D.W. are named inventors on patents for the use of gene expression to subtype aggressive B-cell lymphomas, one of which is licensed to NanoString Technologies. C.S. reports consultancy fees from AbbVie, Bayer, and Seattle Genetics; and research funds from Trillium Therapeutics, Bristol Myers Squibb (BMS), and Epizyme. L.H.S. reports consulting fees/honoraria from AbbVie, Amgen, AstraZeneca, BeiGene, BMS/Celgene, GenMab, Kite/Gilead, Incyte, Janssen, Merck, Seagen, and Roche/Genentech; and research funding from Roche/Genentech and Teva. K.J.S. reports honoraria/consulting fees from BMS, Merck, Seagen, Janssen, and AbbVie; steering committee fees from AstraZeneca; research funding from BMS and Roche; and the data safety monitoring committee for Regeneron. D.W.S. reports consulting fees/honoraria from AbbVie, AstraZeneca, GenMab, Incyte, Roche/Genentech, and Veracyte and research funding from Roche/Genentech. The remaining authors declare no competing financial interests.
Correspondence: David W. Scott, Centre for Lymphoid Cancer, BC Cancer Research Centre, 675 W 10th Ave, Vancouver, BC V5Z 1L3, Canada; email: dscott8@bccancer.bc.ca; and Laura K. Hilton, Centre for Lymphoid Cancer, BC Cancer Research Centre, 675 W 10th Ave, Vancouver, BC V5Z 1L3, Canada; email: lhilton@bccrc.ca.
References
Author notes
Data have been deposited in the European Genome-Phenome Archive with accession number EGAS50000000328.
The online version of this article contains a data supplement.
There is a Blood Commentary on this article in this issue.
The publication costs of this article were defrayed in part by page charge payment. Therefore, and solely to indicate this fact, this article is hereby marked “advertisement” in accordance with 18 USC section 1734.

