Key Points
PRMT5 inhibition restores regulation of the cell cycle, promotes cell death, and reactivates negative regulators of the BCR in MCL.
Wild-type TP53 and MTAP deletion are biomarkers predicting refractory MCL vulnerability to PRMT5-targeted therapy.
Abstract
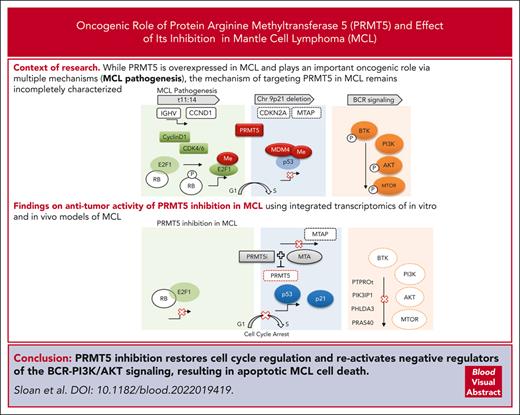
Mantle cell lymphoma (MCL) is an incurable B-cell malignancy with an overall poor prognosis, particularly for patients that progress on targeted therapies. Novel, more durable treatment options are needed for patients with MCL. Protein arginine methyltransferase 5 (PRMT5) is overexpressed in MCL and plays an important oncogenic role in this disease via epigenetic and posttranslational modification of cell cycle regulators, DNA repair genes, components of prosurvival pathways, and RNA splicing regulators. The mechanism of targeting PRMT5 in MCL remains incompletely characterized. Here, we report on the antitumor activity of PRMT5 inhibition in MCL using integrated transcriptomics of in vitro and in vivo models of MCL. Treatment with a selective small-molecule inhibitor of PRMT5, PRT-382, led to growth arrest and cell death and provided a therapeutic benefit in xenografts derived from patients with MCL. Transcriptional reprograming upon PRMT5 inhibition led to restored regulatory activity of the cell cycle (p-RB/E2F), apoptotic cell death (p53-dependent/p53-independent), and activation of negative regulators of B-cell receptor-PI3K/AKT signaling (PHLDA3, PTPROt, and PIK3IP1). We propose pharmacologic inhibition of PRMT5 for patients with relapsed/refractory MCL and identify MTAP/CDKN2A deletion and wild-type TP53 as biomarkers that predict a favorable response. Selective targeting of PRMT5 has significant activity in preclinical models of MCL and warrants further investigation in clinical trials.
Introduction
Mantle cell lymphoma (MCL) is an incurable B-cell malignancy with complex tumor heterogeneity and a poor prognosis despite recent advances in treatment options.1 The hallmark chromosomal translocation t(11;14) drives cyclin D1 overexpression and cell cycle progression.2 Antigen-dependent stimulation of B-cell receptor (BCR) signaling promotes MCL proliferation and survival through activation of Bruton’s tyrosine kinase (BTK) and downstream signaling through AKT, protein kinase B, and NF-κB.3 Ibrutinib and other BTK inhibitors are widely used for relapsed/refractory MCL; however, most patients inevitably relapse, with a median overall survival of 6 to 8 months after progression.4-8 Although targeted agents have shown promise, including CD19 chimeric antigen receptor–T cell therapy,9 treatment options leading to durable responses are still needed for patients with relapsed/refractory MCL.10
Accumulating evidence has implicated epigenetic dysregulation as a driver of tumorigenesis promoting phenotypic plasticity and disease progression. Protein arginine methyltransferase 5 (PRMT5) is a type II arginine methyltransferase that catalyzes symmetric dimethylation (SDMA) of histone residues (H3R2, H3R8, H4R3, and H2AR3) and nonhistone proteins regulating many cellular processes.11-14 Methylation of histones by PRMT5 mediates epigenetic transcriptional regulation, cofactor recruitment, and chromatin remodeling.15 In addition, PRMT5 regulates DNA damage repair pathways by transcriptional activation of double-strand break repair genes (RAD51, NHEJ1), methylation of proteins involved in DNA repair (RuvBl1 and 53BP1), and maintaining the splicing fidelity of DNA damage repair proteins (Tip60/Kat5).14,16-19
PRMT5 is overexpressed in malignant cells and has been shown to drive the tumorigenesis of solid cancers and hematologic malignancies, including MCL, by supporting numerous oncogenic signaling pathways.20,21 PRMT5 activity contributes to growth and survival in multiple histologic subtypes of lymphoma by regulating tumor suppressors, BCR, and PI3K-AKT signaling.21-23 In addition, PRMT5 directly methylates and controls the activity of regulatory proteins (p53 and AKT) and transcription factors essential for the growth and survival of MCL (E2F1).22 Arginine methylation of E2F1 by PRMT5 promotes cell cycle progression, migration, and invasion by decreasing the affinity of E2F1 for retinoblastoma protein (RB), allowing for enhanced E2F1 target gene transcription.23-25 Furthermore, alternative splicing of MDM4 upon targeting PRMT5 stabilizes and activates the p53 pathway and defines patients with a functional p53-MDM4 axis as vulnerable to PRMT5 inhibition.26 The biological role of PRMT5 in supporting oncogenic pathways has led to the rational development of highly selective PRMT5 inhibitors.20,27-29
Across many cancer subtypes, chromosome 9p21 deletions of MTAP and CDKN2A create a therapeutic vulnerability to PRMT5-targeted therapies.30-32 MTAP contributes to the methionine and adenine salvage pathways by clearing methylthioadenosine, and cells with MTAP loss accumulate methylthioadenosine, a metabolite that competes with the PRMT5 substrate donor S-adenosyl methionine (SAM) and decreases PRMT5 methyltransferase activity. Loss of MTAP expression was found to be associated with poorer overall survival in MCL, which led us to explore this relationship further.33
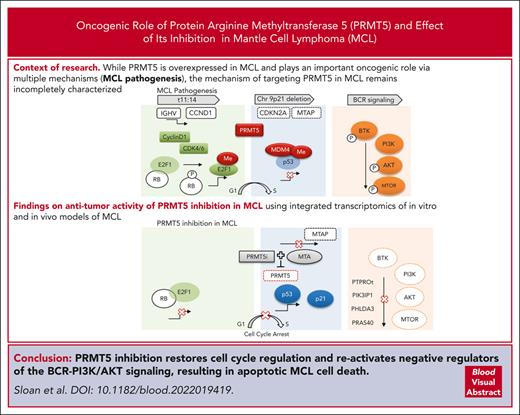
The mechanisms contributing to the antitumor activity of selective PRMT5 inhibition in MCL remain incompletely characterized. Here, we demonstrate that selective pharmacologic inhibition of PRMT5 drives potent antitumor activity in MCL and identify wild-type (WT) TP53 and MTAP deletion as biomarkers predicting sensitivity to this approach. RNA sequencing revealed a global change in the transcriptome after PRMT5 inhibition, with more than 2000 differentially expressed genes (DEGs). Gene set enrichment analysis (GSEA) of these DEGs identified many pathways crucial for the growth and survival of MCL, including p53, E2F, mechanistic target of rapamycin (mTOR), MYC, DNA replication, and cell cycle regulation. PRMT5 inhibition restored regulatory activity to the cell cycle (p-RB/E2F1), induced proapoptotic cell death (p53-dependent and p53-independent), and transcriptionally activated negative regulators of BCR-PI3K/AKT signaling (PHLDA3, PTPROt, and PIK3IP1). This work provides mechanistic insight and supports the use of PRMT5 inhibitors as a rational therapeutic option for patients with relapsed/refractory MCL, particularly with MTAP deletion and WT-TP53.
Methods
For cell culture, cell growth and viability assays, refer to the complete methods in supplemental Materials, available on the Blood website. Patient samples were procured from the Ohio State University Comprehensive Cancer Center Leukemia Tissue Bank after informed consent and approval by the Cancer Institution Review Board were obtained. All mouse studies were approved by the Ohio State University Institutional Animal Care and Use Committee, and the animals were maintained under compliance with institutional guidelines.
Mouse models
Patient derived xenografts (PDX-DA and PDX-AA) were developed in our laboratory by tail vein engraftment of human peripheral blood mononuclear cells from MCL patients into 5 to 7-week-old female NOD scid gamma (NSG) mice (NOD.Cg-Prkdcscid Il2rgtm1Wjl/SzJ, RRID:IMSR_JAX:005557) as previously described.34 Further details are in the supplemental Methods.
Immunoblot and IP
Immunoblotting and immunoprecipitation (IP) experiments were performed according to standard methods. Further details are in the supplemental Methods.
ChIP and reverse transcription quantitative polymerase chain reaction (RT-qPCR) assays
Chromatin immunoprecipitation (ChIP) was performed on crosslinked chromatin using the SimpleChIP Plus Enzymatic Chromatin IP Kit (Magnetic Beads) (Cell Signaling Technology catalog no. 9005) following the manufacturer's protocol. Further details are in the supplemental Methods.
Knockdown by short hairpin RNA (shRNA)
Refer to the supplemental Methods.
Transcriptomic and WES
Human CD19+ MCL cells were positively selected from patient peripheral blood mononuclear cells and PDX spleens (STEMCELL Technologies catalog no. 17854). Whole-exome sequencing (WES) of DNA from human CD19+ B cells from patient tumors and cells passaged in PDXs was performed at the Nationwide Children’s Hospital Genomic Core Facility. WES reads were aligned to the GRCh37 (Genome Reference Consortium Human Build 37), and data were analyzed to determine mutational variants and copy number variation (supplemental Tables 1 and 2; supplemental Figures 1 and 2). Data on genomic alterations in MCL cell lines were obtained from Cellosaurus.35
Total RNA was extracted using the Total RNA Purification Kit (Norgen catalog no. 17200) and QIAshredder Columns (Qiagen catalog no. 79654). RNA integrity was interrogated using the Agilent 2100 Bioanalyzer. For the RNA sequencing, TrueSeq stranded messenger RNA (mRNA) libraries were prepared with Poly-A selection Ribodepletion library prep and sequenced using Illumina NovaSeq 6000 on an S1 flow cell (paired end reads with 2 × 100 bp). DEGs were assessed using DESeq2 with pairwise comparisons between treatment and control (q < 0.01; |log2FC| > 0.58) (n = 3 per group). GSEA was used to identify significantly enriched gene sets.36
Statistical analysis
Statistical significance was evaluated using Student t test, two-way analysis of variance, Pearson correlation, and simple linear regression were applicable. Dose-response curves were used to generate 50% inhibitory concentration (IC50) values using least square regression with the bottom constraint set to 0. To compare changes over time, we used generalized estimating equations with autoregressive correlation structures to test the differences of slopes between groups. P values were not adjusted for potential multiple comparisons. Comparison of Kaplan-Meier survival curves was assessed with log rank (Mantel-Cox) test. Error bars indicate ± standard error of the mean. ∗P < .05; ∗∗P < .01; ∗∗∗P < .001; ∗∗∗∗P < .0001.
Results
PRMT5 inhibition drives potent anti-MCL activity in vitro
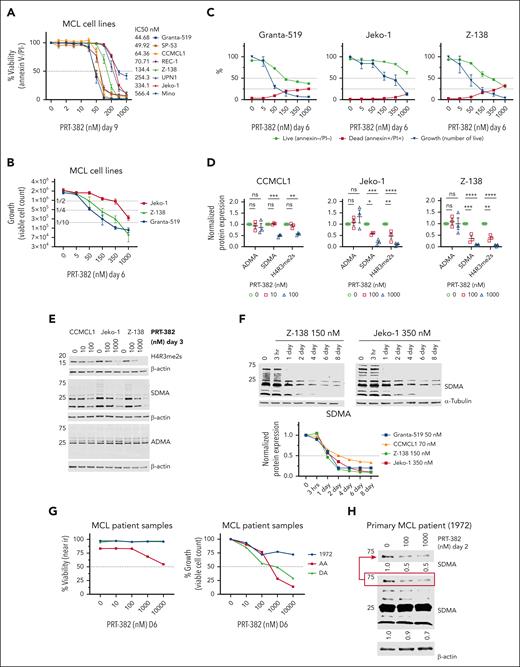
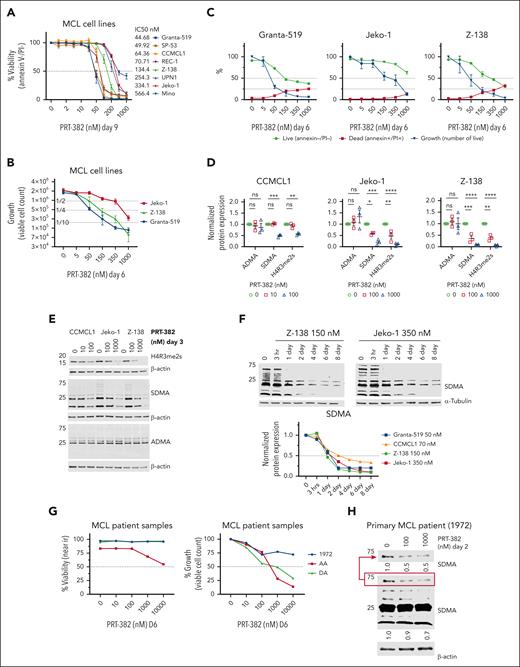
To assess the cytotoxic activity of PRMT5 inhibition, 8 MCL cell lines (supplemental Table 1) were treated with increasing concentrations of PRT-382 for 9 days, and then viability and cell growth were measured by annexin-V/propidium iodide staining. All MCL cell lines showed dose-dependent cell death with IC50s lower than 1 μM (Figure 1A). After 6 days of treatment with PRT-382, cell growth was decreased by 75% in Granta-519 (50 nM), Jeko-1 (500 nM), and Z-138 (150 nM) (Figure 1B-C). Consistent with the selective activity of PRT-382, treatment resulted in a significant dose-dependent decrease in SDMA and SDMA of histone-4 arginine-3 (H4R3me2s), with no significant change in asymmetric dimethyl-arginine (ADMA) (Figure 1D-E). Time-course analysis of MCL cell lines treated with PRT-382 showed a similar time-dependent reduction in total SDMA (Figure 1F; supplemental Figure 3A). Three primary samples from patients with MCL were stimulated with cytokines and cocultured on adherent CD40L-expressing murine fibroblasts as previously described37 (supplemental Table 2). A similar pattern of growth inhibition was observed in primary samples from patients with MCL treated with PRT-382 for 6 days (Figure 1G). A minimal change in the viability of the CD40L-expressing cells was observed only at 10 000 nM PRT-382 (supplemental Figure 3B). Consistent with the inhibition of PRMT5, the primary patient sample 1972 showed decreased marks of SDMA after 2 days of treatment with PRT-382 (Figure 1H).
PRMT5 inhibition drives potent anti-MCL activity in vitro. (A) Eight MCL cell lines were treated with increasing doses of the PRMT5 inhibitor PRT-382 for 9 days. Cell viability was measured by annexin-V/propidium iodide (PI) staining and flow cytometry. (B-C) Jeko-1, Z-138, and Granta-519 were treated for 6 days with increasing doses of PRT-382. The viable cell count was measured with count beads by gating on annexin-V/PI–negative cells. (D-E) CCMCL1, Jeko-1, and Z-138 were treated with PRT-382 for 3 days at the indicated doses. Protein lysates were obtained and immunoblotted for H4R3me2s, SDMA, and ADMA. β-Actin was used as a loading control. Protein expression densitometry values normalized to β-actin and relative to dimethyl sulfoxide (DMSO) control. Dots represent individual replicate experiments. (F) CCMCL1, Jeko-1, Granta-519, and Z-138 were treated with PRT-382 at day 9 IC50 values. Protein lysates were collected at the indicated time points and immunoblotted for total SDMA with β-actin, α-tubulin, and glyceraldehyde-3-phosphate dehydrogenase (GAPDH) used as loading controls. Protein expression densitometry values for total SDMA normalized to loading control and relative to the no treatment time point 0 in lane 1. (G) Primary patient samples were cocultured with a CD40-ligand overexpressing murine fibroblast cell line and stimulated with cytokines. Cells were treated with PRT-382 for 6 days and viability and growth was measured by near-IR live/dead stain and gating on human CD19+/CD5+ MCL with flow cytometry. (H) Primary patient sample 1972 was treated with PRT-382 for 2 days at the indicated doses. Protein lysates were immunoblotted for total SDMA with β-actin used as a loading control.
PRMT5 inhibition drives potent anti-MCL activity in vitro. (A) Eight MCL cell lines were treated with increasing doses of the PRMT5 inhibitor PRT-382 for 9 days. Cell viability was measured by annexin-V/propidium iodide (PI) staining and flow cytometry. (B-C) Jeko-1, Z-138, and Granta-519 were treated for 6 days with increasing doses of PRT-382. The viable cell count was measured with count beads by gating on annexin-V/PI–negative cells. (D-E) CCMCL1, Jeko-1, and Z-138 were treated with PRT-382 for 3 days at the indicated doses. Protein lysates were obtained and immunoblotted for H4R3me2s, SDMA, and ADMA. β-Actin was used as a loading control. Protein expression densitometry values normalized to β-actin and relative to dimethyl sulfoxide (DMSO) control. Dots represent individual replicate experiments. (F) CCMCL1, Jeko-1, Granta-519, and Z-138 were treated with PRT-382 at day 9 IC50 values. Protein lysates were collected at the indicated time points and immunoblotted for total SDMA with β-actin, α-tubulin, and glyceraldehyde-3-phosphate dehydrogenase (GAPDH) used as loading controls. Protein expression densitometry values for total SDMA normalized to loading control and relative to the no treatment time point 0 in lane 1. (G) Primary patient samples were cocultured with a CD40-ligand overexpressing murine fibroblast cell line and stimulated with cytokines. Cells were treated with PRT-382 for 6 days and viability and growth was measured by near-IR live/dead stain and gating on human CD19+/CD5+ MCL with flow cytometry. (H) Primary patient sample 1972 was treated with PRT-382 for 2 days at the indicated doses. Protein lysates were immunoblotted for total SDMA with β-actin used as a loading control.
Targeted PRMT5 therapy provides antitumor activity in xenograft models derived from patients with MCL
To evaluate the in vivo therapeutic activity of the novel PRMT5 inhibitor PRT-382, we used 2 MCL PDX mouse models developed in our laboratory (supplemental Table 2). WES was performed to evaluate the mutational profile of each PDX model. Both PDX models contained WT BTK and PLCG2. PDX-DA contained a homozygous mutation of TP53(R282G), whereas PDX-AA did not have any pathogenic mutations of TP53.38 Copy number variation analysis showed a codeletion of MTAP/CDKN2A in PDX-AA, whereas PDX-DA contained a loss of heterozygosity.
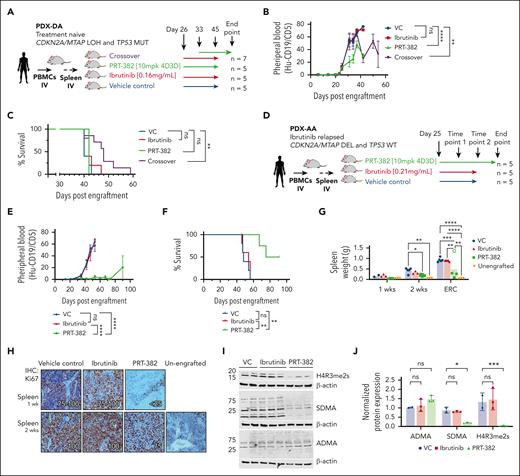
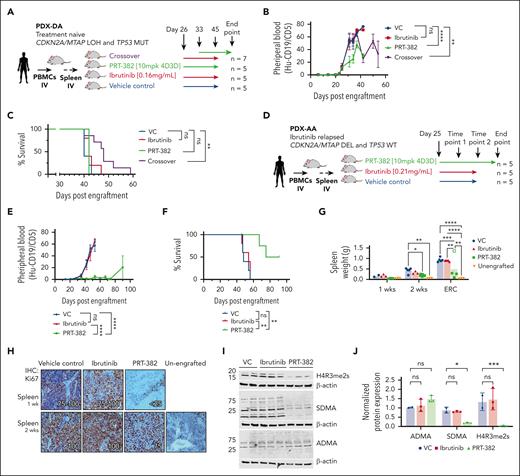
In PDX-DA, treatment with the single agent ibrutinib or PRT-382 was started 26 days after engraftment (Figure 2A). In the combination crossover treatment group, PRT-382 was added at day 33, and ibrutinib was discontinued on day 45. Mice treated with vehicle control (VC) or ibrutinib showed progressive circulating disease over time, whereas mice treated with a single agent or crossed over to PRT-382 showed significantly reduced circulating MCL cells (Figure 2B). Although single agent ibrutinib and PRT-382 did not prolong survival, the crossover treatment showed significantly prolonged median survival (VC = 40, ibrutinib = 42, PRT-382 = 42, crossover = 48) (P < .01) (Figure 2C). These data suggest that TP53-mutated, MTAP-positive MCL, may be resistant to the single agent ibrutinib and PRT-382 but could potentially benefit from a combined therapeutic strategy targeting both BTK and PRMT5.
PRMT5 inhibition is therapeutic in xenograft models derived from patients with MCL. (A-C) PDX-DA. (A) Experimental design of PDX-DA. Treatment with VC (n = 5), ibrutinib (0.16 mg/mL in drinking water; n = 5), or PRT-382 (10 mg/kg 4D3D; n = 5) was started 26 days after engraftment. In the crossover treatment group (n = 7), PRT-382 was added at day 33 and ibrutinib was discontinued on day 45. (B) Circulating disease in peripheral blood of mice was quantified by staining for the percentage of human CD19+/CD5+ cells detected by flow cytometry. (C) Survival was assessed by Kaplan-Meier survival analysis. (D-J) PDX-AA. (D) Experimental design of PDX-AA. Treatment with VC (n = 5), ibrutinib (0.21 mg/mL in drinking water; n = 5), or PRT-382 (10 mg/kg 4D3D; n = 5) was started on day 25 after engraftment. (E) Circulating disease in peripheral blood of mice was quantified by staining for the percentage of human CD19+/CD5+ cells detected by flow cytometry. (F) Survival was assessed by Kaplan-Meier survival analysis. (G) Average spleen weight in grams after 1 and 2 weeks of treatment and at ERC. (H) Cell proliferation was assessed by staining for Ki67 in spleens of mice treated in vivo for 1 and 2 weeks. (I) Spleens of mice treated in vivo were harvested after 2 weeks of treatment and human CD19+ cells were isolated and immunoblotted for H4R3me2s, SDMA, and ADMA. β-Actin was used as a loading control. (J) Protein expression densitometry values normalized to β-actin and relative to VC sample in lane 1. Each dot represents an individual mouse.
PRMT5 inhibition is therapeutic in xenograft models derived from patients with MCL. (A-C) PDX-DA. (A) Experimental design of PDX-DA. Treatment with VC (n = 5), ibrutinib (0.16 mg/mL in drinking water; n = 5), or PRT-382 (10 mg/kg 4D3D; n = 5) was started 26 days after engraftment. In the crossover treatment group (n = 7), PRT-382 was added at day 33 and ibrutinib was discontinued on day 45. (B) Circulating disease in peripheral blood of mice was quantified by staining for the percentage of human CD19+/CD5+ cells detected by flow cytometry. (C) Survival was assessed by Kaplan-Meier survival analysis. (D-J) PDX-AA. (D) Experimental design of PDX-AA. Treatment with VC (n = 5), ibrutinib (0.21 mg/mL in drinking water; n = 5), or PRT-382 (10 mg/kg 4D3D; n = 5) was started on day 25 after engraftment. (E) Circulating disease in peripheral blood of mice was quantified by staining for the percentage of human CD19+/CD5+ cells detected by flow cytometry. (F) Survival was assessed by Kaplan-Meier survival analysis. (G) Average spleen weight in grams after 1 and 2 weeks of treatment and at ERC. (H) Cell proliferation was assessed by staining for Ki67 in spleens of mice treated in vivo for 1 and 2 weeks. (I) Spleens of mice treated in vivo were harvested after 2 weeks of treatment and human CD19+ cells were isolated and immunoblotted for H4R3me2s, SDMA, and ADMA. β-Actin was used as a loading control. (J) Protein expression densitometry values normalized to β-actin and relative to VC sample in lane 1. Each dot represents an individual mouse.
In PDX-AA, treatment with ibrutinib or PRT-382 was started on day 25 after engraftment (Figure 2D). Mice treated with VC or ibrutinib showed progressive circulating disease over time, whereas mice treated with PRT-382 showed profoundly decreased circulating MCL cells (P < .0001) (Figure 2E). Mice treated with ibrutinib showed no survival advantage compared with VC, whereas mice treated with PRT-382 showed significantly prolonged median survival compared with those with VC or ibrutinib treatment (VC = 48, ibrutinib = 54, PRT-382 = 83) (P < .01) (Figure 2F). No significant weight loss (>20%) was observed in any of the groups (supplemental Figure 4A-B). The spleens of mice were harvested after 1 or 2 weeks of treatment or when ERC criteria were met, and MCL tumor burden was assessed by hematoxylin and eosin staining (Figure 2G). Mice treated with PRT-382 showed minimal evidence of MCL by hematoxylin and eosin staining (supplemental Figure 4C; supplemental Table 3). Spleens of mice treated with PRT-382 for 1 or 2 weeks show decreased MCL proliferation evaluated by Ki67 and immunohistochemistry (Figure 2H). To validate the in vivo on-target biological activity of PRT-382, we isolated human CD19+ cells from spleens of mice treated for 2 weeks and immunoblotted for H4R3me2s, SDMA, and ADMA. Compared with VC mice, treatment with PRT-382 showed decreased H4R3me2s and SDMA, with no significant change to ADMA, consistent with selective inhibition of PRMT5 (Figure 2I-J).
MTAP deletion and WT-TP53 enhance sensitivity to PRMT5 inhibition
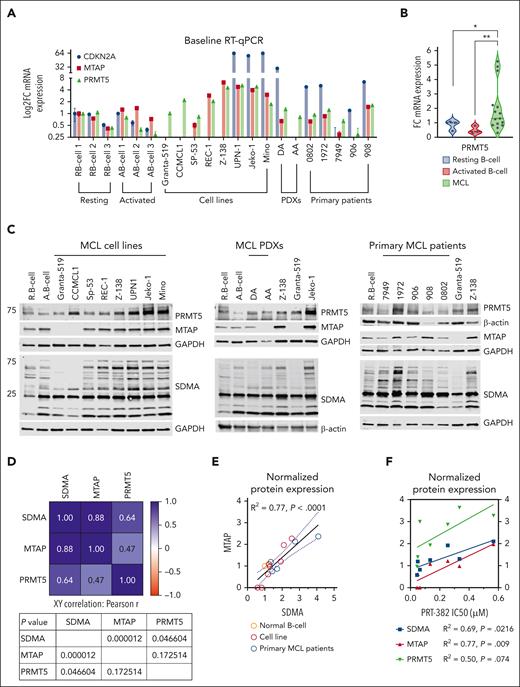
To demonstrate the therapeutic vulnerability of MTAP-deleted MCL to PRMT5 inhibition, we first evaluated the baseline transcript expression of CDKN2A, MTAP, and PRMT5 across 8 MCL cell lines, 2 PDXs, and 5 primary samples from patients with MCL compared with resting and activated normal B cells (Figure 3A). In concordance with their homozygous deletion, no transcript expression of MTAP or CDKN2A was detected in Granta-519, CCMCL1, or PDX-AA. Low transcript expression of MTAP was detected in SP-53, PDX-DA, and primary patient samples 7949 and 906. PRMT5 transcript expression was significantly increased in MCL samples (n = 15) compared with resting or activated normal B cells (Figure 3B). Next, we evaluated baseline protein expression of MTAP, PRMT5, and total SDMA (Figure 3C). MTAP protein expression showed a significant positive correlation with total marks of SDMA (MTAP: P < .0001) (Figure 3D-E). We found a significant positive correlation between response to PRT-382 (IC50) and lack of MTAP expression and total marks of SDMA across all cell lines except for REC-1 (MTAP: P < .01; SDMA: P < .05) (Figure 3F).
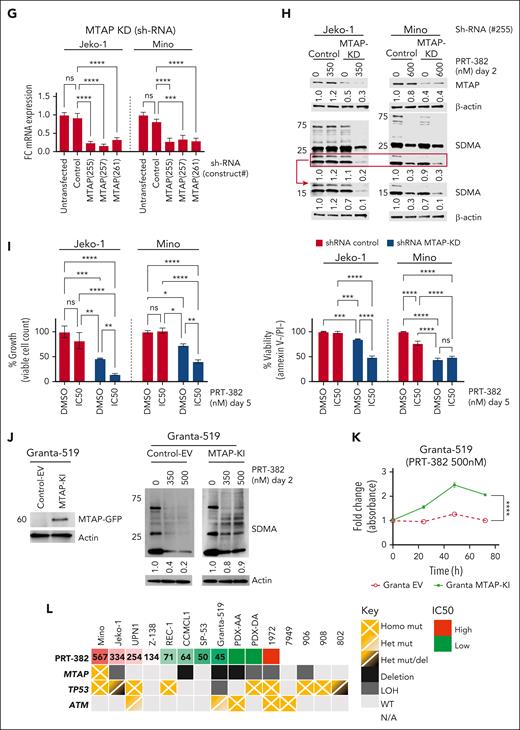
In further support of this observation, we knocked down (KD) MTAP by shRNA in the MCL cell lines with the highest PRT-382 IC50 (Jeko-1 and Mino) (Figure 3G). MTAP-KD resulted in reduced SDMA marks that were further diminished with the addition of PRT-382 (Figure 3H). Compared with shRNA control–transfected cell lines, MTAP-KD cell lines showed significantly decreased growth and viability, which was further decreased with the inhibition of PRMT5, signifying enhanced sensitivity to PRT-382 (Figure 3I). We also knocked in (KI) MTAP in the MCL cell line with the lowest PRT-382 IC50 and homozygous MTAP deletion (Granta-519) (Figure 3J). Granta-519-MTAP-KI showed a smaller decrease in SDMA compared with empty vector–transduced cells when treated with PRT-382 (350 and 500 nM), suggesting decreased inhibition of PRMT5 (Figure 3J). Granta-519-MTAP-KI cells displayed a higher proliferation rate in the presence of PRT-382 (500 nM), signifying a decreased sensitivity to PRMT5 inhibition (Figure 3K). In addition, MCL cell lines with functional TP53 had lower IC50s to PRT-382 and were therapeutically more sensitive to PRMT5 inhibition (Figure 3L). Taken together, our in vitro and in vivo data show that targeting PRMT5 provides potent antilymphoma activity, particularly in MTAP-deleted and TP53-WT MCL.
PRMT5 inhibition drives transcriptional reprogramming in MCL
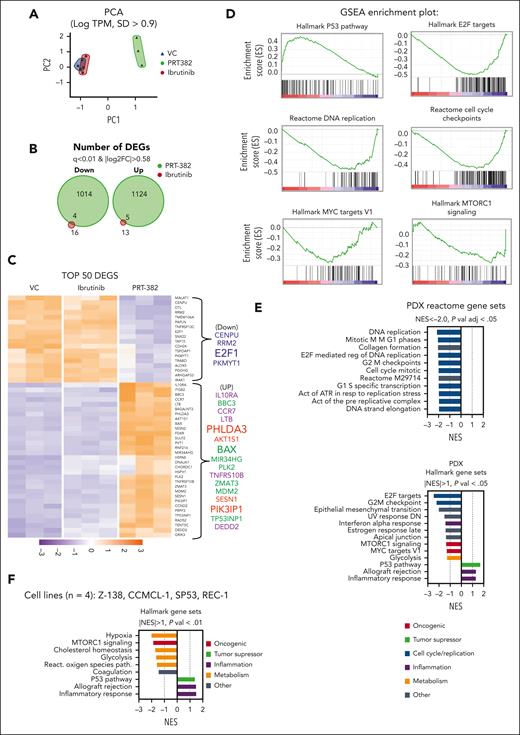
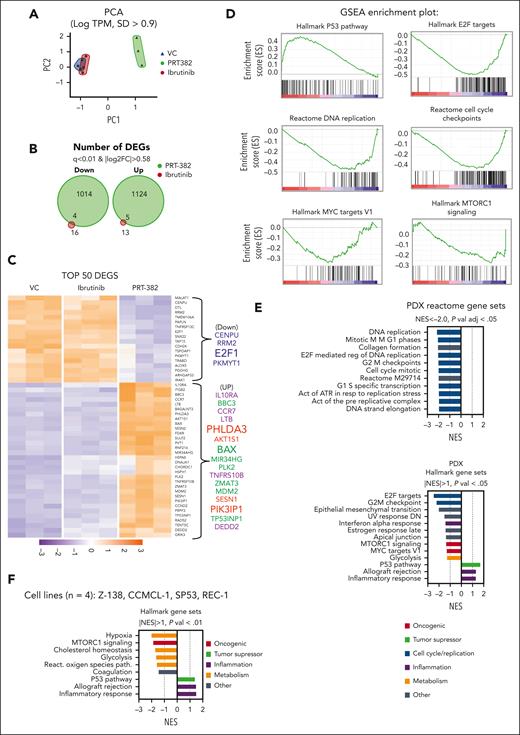
To identify the mechanistic underpinning of the antitumor activity of PRMT5 inhibition in MCL, we explored the transcriptomic profiles of PDX-AA cells treated in vivo for 2 weeks with PRT-382, ibrutinib, or VC (n = 3 per group). RNA sequencing of human CD19+ cells isolated from the spleen of ibrutinib-treated animals showed minimal changes, whereas PRT-382–treated animals showed a global shift in the transcriptome with 1014 down and 1124 up DEGs (q < 0.01; |log2FC| > 0.58) (Figure 4A-C). Comparing the DEGs between PRT-382 and VC by GSEA, we identified a significant reduction in many pathways involved in cell cycle regulation and DNA replication. Among the top gene sets with significantly reduced transcription were the HALLMARK gene sets E2F targets and G2M checkpoint, as well as the REACTOME gene sets E2F-mediated regulation of DNA replication, cell cycle mitotic, G1/S specific transcription, and DNA strand elongation (Figure 4D-E). Among the increased DEGs were negative regulators of the BCR pathway and PI3K/AKT signaling: the BCR-negative regulator (PTPRO), the PI3K inhibitor (PIK3IP1), and the negative regulator of AKT activity (PHLDA3). In addition, GSEA identified significant activation of the HALLMARK p53 pathway with increased transcriptional activation of p53 target genes that are known tumor suppressors (CDKN1A/p21 and PHLDA3) and proapoptotic genes (BBC3/Puma and BAX). Furthermore, among the top 50 DEGs with increased transcripts are the immune response proteins chemokine receptor (CCR7) and interleukin 10 receptor (IL10Rα). A similar HALLMARK gene set enrichment signature was obtained in MCL cell lines treated with PRT-382 at IC50s for 6 days (Figure 4F).
PRMT5 inhibition drives transcriptional reprogramming in MCL. In PDX-AA, spleens of mice treated in vivo for 2 weeks were harvested and human CD19+ cells were isolated and subjected to RNA sequencing. (A) Principal component analysis (PCA) of RNA sequencing data shows global differences in the transcriptome between treatment groups log tracks per million (TPM); SD > 0.9). Each dot represents and individual mouse. (B) Venn diagram depicting the number of down or up DEGs in mice treated with ibrutinib or PRT-382 in comparison to VC (q < 0.01; |log2FC| > 0.58). (C) Heatmap of the top 50 DEGs by q-value (q < 0.01; |log2FC| > 0.58). GSEA of PRT-382 in comparison with the VC, showing (D) key enrichment plots and (E) normalized enrichment scores (NES) of the top HALLMARK and REACTOME gene sets from Molecular Signatures Database (MsigDB). (F) GSEA of the top HALLMARK gene sets significantly enriched across 4 cell lines (Z-138, CCMCL1, SP53, and REC-1) treated with day 9 IC50 PRT-382 for 6 days in comparison with DMSO control.
PRMT5 inhibition drives transcriptional reprogramming in MCL. In PDX-AA, spleens of mice treated in vivo for 2 weeks were harvested and human CD19+ cells were isolated and subjected to RNA sequencing. (A) Principal component analysis (PCA) of RNA sequencing data shows global differences in the transcriptome between treatment groups log tracks per million (TPM); SD > 0.9). Each dot represents and individual mouse. (B) Venn diagram depicting the number of down or up DEGs in mice treated with ibrutinib or PRT-382 in comparison to VC (q < 0.01; |log2FC| > 0.58). (C) Heatmap of the top 50 DEGs by q-value (q < 0.01; |log2FC| > 0.58). GSEA of PRT-382 in comparison with the VC, showing (D) key enrichment plots and (E) normalized enrichment scores (NES) of the top HALLMARK and REACTOME gene sets from Molecular Signatures Database (MsigDB). (F) GSEA of the top HALLMARK gene sets significantly enriched across 4 cell lines (Z-138, CCMCL1, SP53, and REC-1) treated with day 9 IC50 PRT-382 for 6 days in comparison with DMSO control.
PRMT5 inhibition transcriptionally reprograms MCL cells to shut down essential growth and proliferative genes that contribute critical signals for the survival of MCL cells while simultaneously activating an inflammatory cytokine, cell death receptor, and p53 proapoptotic response.
Inhibition of PRMT5 attenuates E2F1 transcription factor activity and MCL cell proliferation
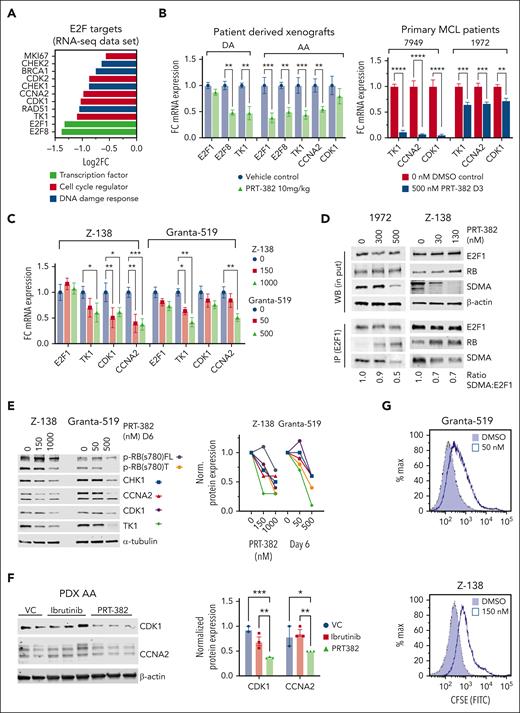
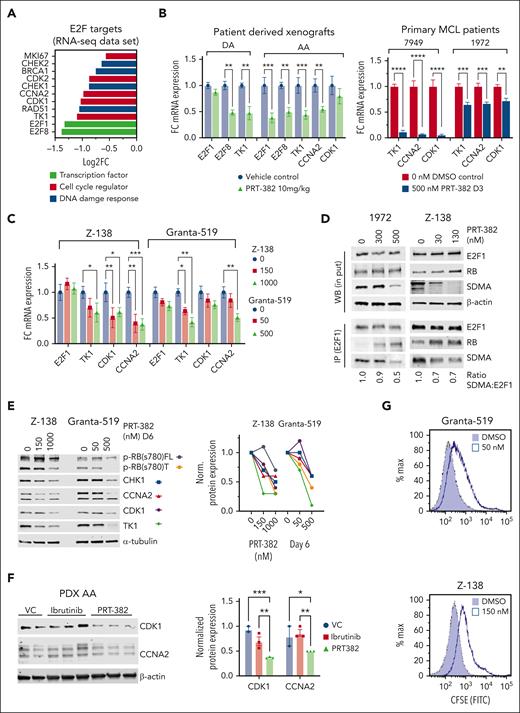
Among the E2F target genes with decreased transcripts, we identified DNA damage response genes (RAD51, CHK1, and BRAC1) and cell cycle regulators (E2F1, E2F8, CCNA2, CDK1, and TK1) (Figure 5A). In concordance with transcriptomic profiling, RT-qPCR showed decreased mRNA expression of select E2F target genes in PDX-DA and PDX-AA cells treated for 2 weeks in vivo, in primary patient samples 7947 and 1972 treated for 3 days, and in Z-138 and Granta-519 treated for 6 days (Figure 5B-C).
Inhibition of PRMT5 attenuates E2F1signaling in MCL. (A) Log2 fold change (FC) of DEGs in the RNA sequencing data set of PDX-AA cells of mice treated in vivo with PRT-382 in comparison with VC. (B) FC in mRNA expression of HALLMARK E2F targets analyzed by RT-qPCR in PDX (DA and AA) cells treated in vivo and in primary patient samples (7949 and 1972) treated for 3 days in vitro. Data are normalized to GAPDH and shown relative to control. PDX data are in biological triplicate (n = 3 per group) apart from VC in PDX-DA, which is a technical duplicate (n = 1 VC mouse). Primary patient samples are in biological duplicates. (C) FC in mRNA expression of HALLMARK E2F targets analyzed by RT-qPCR in Z-138 and Granta-519 treated for 6 days in vitro with the indicated doses of PRT-382. Data are normalized to ACTB and shown relative to DMSO control. (D) E2F1 was immunoprecipitated from protein lysates of Z-138 treated with PRT-382 for 4 days and patient 1972 treated with PRT-382 for 3 days. Lysates were immunoblotted for E2F1, RB, and SDMA. β-Actin was used as a loading control for the western blot (WB) input lysates. E2F1 was used as a loading control for eluted bound antigen IP lysates. (E) Z-138 and Granta-519 were treated with the indicated doses of PRT-382 for 6 days. Protein lysates were immunoblotted for p-RB(s780), CHK1, CCNA2, CDK1, and TK1, with α-tubulin used as a loading control. Protein densitometry values were normalized to α-tubulin and shown relative to 0 nM DMSO control. (F) Immunoblot of CDK1 and CCNA2 in protein lysates from PDX-AA treated with PRT-382 or ibrutinib for 2 weeks in vivo. Protein densitometry values normalized to β-actin and shown relative to VC in lane 1. (G) CSFE (carboxyfluorescein succinimidyl ester) staining of viable cells shows decreased cell replication in PRT-382–treated cells compared with DMSO control after 9 days.
Inhibition of PRMT5 attenuates E2F1signaling in MCL. (A) Log2 fold change (FC) of DEGs in the RNA sequencing data set of PDX-AA cells of mice treated in vivo with PRT-382 in comparison with VC. (B) FC in mRNA expression of HALLMARK E2F targets analyzed by RT-qPCR in PDX (DA and AA) cells treated in vivo and in primary patient samples (7949 and 1972) treated for 3 days in vitro. Data are normalized to GAPDH and shown relative to control. PDX data are in biological triplicate (n = 3 per group) apart from VC in PDX-DA, which is a technical duplicate (n = 1 VC mouse). Primary patient samples are in biological duplicates. (C) FC in mRNA expression of HALLMARK E2F targets analyzed by RT-qPCR in Z-138 and Granta-519 treated for 6 days in vitro with the indicated doses of PRT-382. Data are normalized to ACTB and shown relative to DMSO control. (D) E2F1 was immunoprecipitated from protein lysates of Z-138 treated with PRT-382 for 4 days and patient 1972 treated with PRT-382 for 3 days. Lysates were immunoblotted for E2F1, RB, and SDMA. β-Actin was used as a loading control for the western blot (WB) input lysates. E2F1 was used as a loading control for eluted bound antigen IP lysates. (E) Z-138 and Granta-519 were treated with the indicated doses of PRT-382 for 6 days. Protein lysates were immunoblotted for p-RB(s780), CHK1, CCNA2, CDK1, and TK1, with α-tubulin used as a loading control. Protein densitometry values were normalized to α-tubulin and shown relative to 0 nM DMSO control. (F) Immunoblot of CDK1 and CCNA2 in protein lysates from PDX-AA treated with PRT-382 or ibrutinib for 2 weeks in vivo. Protein densitometry values normalized to β-actin and shown relative to VC in lane 1. (G) CSFE (carboxyfluorescein succinimidyl ester) staining of viable cells shows decreased cell replication in PRT-382–treated cells compared with DMSO control after 9 days.
Published literature demonstrates that direct methylation of E2F1 by PRMT5 decreases its affinity for RB and promotes E2F1 target gene transcription.23 To examine the direct methylation of E2F1 by PRMT5, we immunoprecipitated E2F1 from protein lysates of MCL cell lines and primary MCL samples treated with PRT-382 and showed decreased methylation (SDMA) of E2F1 and increased association with the tumor suppressor RB (Figure 5D; supplemental Figure 5A). Z-138 and Granta-519 treated with PRT-382 for 6 days showed a dose-dependent decrease in truncated and full-length phosphorylated RB(s780) and protein expression of key E2F1 targets CHK1, CCNA2, CDK1, and TK1 (Figure 5E). Similarly, PDX-AA cells treated in vivo with PRT-382 showed decreased protein expression of both CDK1 and CCNA2 (Figure 5F). We next characterized the functional consequences of transcriptionally decreased E2F target genes on the proliferation of MCL cells treated with PRT-382.39 As shown in Figure 5G, Z-138 and Granta-519 stained with CSFE and then treated with PRT-382 for 9 days showed decreased cell growth compared with dimethyl sulfoxide-treated cells. Our data show that PRMT5 supports MCL proliferation by methylating the transcription factor and cell cycle regulator E2F1.
The inhibition of PRMT5 leads to cell cycle arrest with p53-dependent and p53-independent apoptotic cell death
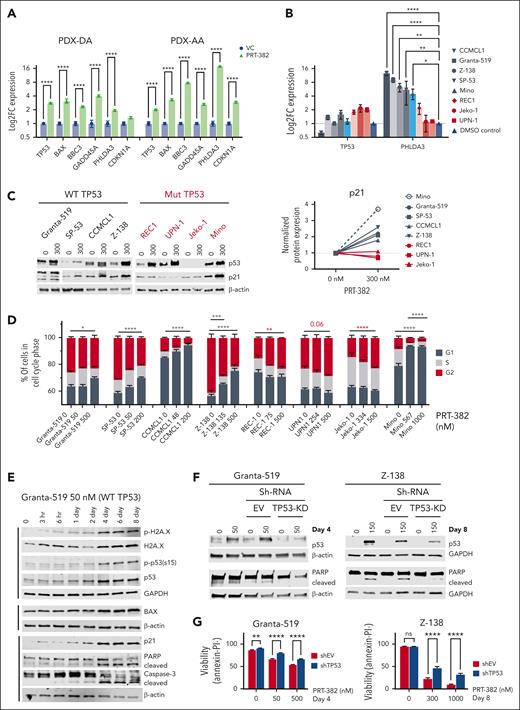
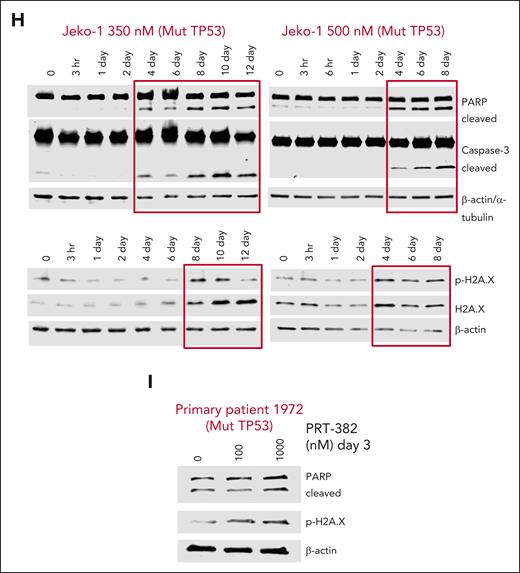
In concordance with transcriptomic profiling, we found increased mRNA expression of the p53 target genes BAX, BBC3, GADD45A, PHLDA3, and CDKN1A (Figure 6A; supplemental Figure 5B). Next, we assessed p53 transcript and protein levels across 8 MCL cell lines via RT-qPCR and immunoblot analysis, respectively. Although p53 transcript was unaffected by treatment (P = not significant), p53 protein levels were increased, suggesting that PRMT5 controls p53 stability rather than its transcription in MCL (Figure 6B-C). In further support of this data, only cell lines with WT-TP53 (Granta-519, SP-53, CCMCL1, Z-138) or mutated but functional p53 (Mino) showed increased transcription of the p53 target gene PHLDA3 (Figure 6B). Similarly, MCL with WT or functional p53 showed increased protein expression of p21, a cell cycle regulator encoded by CDKN1A (Figure 6C; supplemental Figure 5C). The increase in p21 expression coincided with G1 cell cycle arrest after a 5-day treatment with PRT-382, whereas cell lines REC-1, UPN1, and Jeko-1 with dysfunctional p53 and no increase in p21 showed evidence for G2 cell cycle arrest (Figure 6D). Using a more sensitive approach to detect changes in cell cycle via staining double-stained DNA with crystal violet and newly synthesized DNA with incorporated Edu, Granta-519 and CCMCL1 showed G1 arrest after just 3 days of treatment with PRT-382 at IC50 doses (supplemental Figure 5D). After 4 days of treatment with PRT-382, Granta-519 showed accumulation of DNA damage (phosphorylated H2AXs139 and p53s15), induced protein expression of p53 targets (BAX and p21), and indicators of apoptotic cell death (cleaved poly(ADP-ribose) polymerase [PARP] and caspase-3) (Figure 6E). In Granta-519 and Z-138, silencing the induction of p53 with shRNA rescued the cleavage of PARP and rescued cells from apoptosis, indicating p53-mediated apoptosis (Figure 6F-G). Supporting a p53-independent mechanism of apoptotic cell death, treatment with PRT-382 induced markers of DNA damage and apoptotic cell death in a MCL cell line and a primary sample from patients with MCL with mutated TP53 (Jeko-1 and patient 1972) (Figure 6H-I). Although inhibition of PRMT5 still has activity in MCL cell lines without a proficient p53 pathway, having an intact p53 pathway greatly enhances the activity of PRMT5 inhibition in MCL.
The inhibition of PRMT5 transcriptionally activates regulators of the BCR pathway
Transcriptomic data showed the induction of numerous tumor suppressors that regulate BCR signaling, including PHLDA3, PIK3IP1, and PTPRO (Figure 4). PTPROt is a truncated form of the protein tyrosine phosphatase receptor type O that is expressed in normal naïve quiescent B cells but absent or reduced in B-cell lymphomas suppresses proximal BCR activation and phosphorylation of SYK, LYN, and downstream AKT signaling.40 We have previously shown that during the transformation of normal B cells by Epstein-Barr virus infection, PTPROt is silenced by PRMT5.41 Phosphoinositide-3-kinase interacting protein 1, PIK3IP1, inhibits the ability of PI3K to activate AKT by phosphorylation.42 PHLDA3, the p53-regulated protein explored in Figure 6B, inhibits the phosphorylation and activity of AKT.43 Functionally, these proteins dampen the MCL growth and survival signals transduced through the BCR pathway and downstream AKT signaling.
MCL PDX samples, cell lines, and primary patient samples had significantly reduced or absent mRNA expression of both PTPRO and PIK3IP1 compared with normal resting and activated B cells (n = 7) (Figure 7A). ChIP of H3R8me2s showed enrichment on promoters of both PTPRO and PIK3IP1 in PDX-AA and Jeko-1. This enrichment was significantly reduced after the inhibition of PRMT5 (Figure 7B). RT-qPCR confirmed the transcriptional reactivation of PHLDA3, PIK3IP1, and PTPRO in PDX-AA and PDX-DA after in vivo treatment with PRT-382 compared with VC–treated mice (Figure 7C). Primary patient samples (7949 and 1972) treated with PRT-382 showed significant reactivation of PHLDA3 and PIK3IP1 (Figure 7D). Similarly, Granta-519, Jeko-1, and Mino treated with PRT-382 showed increased mRNA expression of these key genes (supplemental Figure 6A). Immunohistochemical staining of splenic PDX-AA MCL cells confirmed increased protein expression of PTPROt with PRT-382 treatment (Figure 7E). Similarly, immunofluorescence staining of PTPROt showed that, compared with normal B cells with 100% of cells expressing PTPROt, Jeko-1 cells showed 27.6% of cells expressing PTPROt at baseline, which nearly doubled to 51.4% of cells expressing PTPROt after 5 days of treatment with PRT-382 (Figure 7F; supplemental Figure 6B). Four MCL cell lines treated for 6 days with PRT-382 showed increased protein expression of PIK3IP1 by immunoblot analysis of protein lysates (Figure 7G). Both Jeko-1 cells and Granta-519 cells treated with PRT-382 showed a time-dependent reduction of phosphorylated AKT(s473) with increased PHLDA3 protein expression in Granta-519 (Figure 7H). These observations support the role of PRMT5 in maintaining epigenetic repressive histone methylation of tumor suppressors and promoting unrestrained BCR-PI3K/AKT signaling, driving MCL proliferation and survival.
Inhibition of PRMT5 activates negative regulators of BCR/PI3K/AKT signaling. (A) PTPRO and PIK3IP1 mRNA expression measured by RT-qPCR in MCL samples (n = 10 total samples: cell lines [n = 3], PDX [n = 2], primary patient samples [n = 5], activated normal B cells [n = 5], and resting normal B cells [n=7]). Data show normalized fold expression relative to resting normal B cells (n = 7) using ACTB as internal control. (B) ChIP assay was performed with antibody H3R8me2s crosslinked magnetic beads. Retained DNA was amplified by qPCR with PTPRO and PIK3IP1 TaqMan primers. Fold enrichment was calculated relative to the input sample (PI). (C) Log2FC mRNA expression measured by RT-qPCR in PDX-DA and PDX-AA cells treated in vivo. Data are shown relative to VC treatment with ACTB as internal control. Data are in biological triplicates (n = 3 per group) apart from VC in PDX-DA is a technical duplicate. (D) Log2FC mRNA expression measured by RT-qPCR in primary patients with MCL (7949 and 1972), treated for 3 days with 500 nM PRT-382 in vitro. Data are normalized to GAPDH and shown relative to VC. Data are biological triplicates or duplicates. (E) PTPROt protein expression evaluated by immunohistochemistry (IHC) staining in spleens obtained from PDX-AA animals treated in vivo with PRT-382 or VC. Quantification of IHC PTPROt-stained slides showing the proportion of pixels positive for staining. Each dot represents an individual mouse. (F) Jeko-1 cells were treated with DMSO control or 500 nM PRT-382 for 5 days then evaluated for protein expression of PTPROt by confocal microscopy. The total number of cells counted and the percentage of cells positive for fluorescent immunolabeling of PTPROt is shown. (G) The indicated MCL cell lines were treated with day 9 IC50 values of PRT-382, and protein lysates were collected at day 6 and immunoblotted for PIK3IP1 with β-tubulin as a loading control. Protein expression densitometry values shown normalized to loading control and relative to 0 nM DMSO control–treated cells. (H) Jeko-1 cells were treated with 500 nM PRT-382 and Granta-519 cells were treated with 50 nM PRT-382 out to 8 days. Protein lysates were immunoblotted for PHLDA3, p-AKT(s473), and AKT with α-tubulin and GAPDH as loading controls.
Inhibition of PRMT5 activates negative regulators of BCR/PI3K/AKT signaling. (A) PTPRO and PIK3IP1 mRNA expression measured by RT-qPCR in MCL samples (n = 10 total samples: cell lines [n = 3], PDX [n = 2], primary patient samples [n = 5], activated normal B cells [n = 5], and resting normal B cells [n=7]). Data show normalized fold expression relative to resting normal B cells (n = 7) using ACTB as internal control. (B) ChIP assay was performed with antibody H3R8me2s crosslinked magnetic beads. Retained DNA was amplified by qPCR with PTPRO and PIK3IP1 TaqMan primers. Fold enrichment was calculated relative to the input sample (PI). (C) Log2FC mRNA expression measured by RT-qPCR in PDX-DA and PDX-AA cells treated in vivo. Data are shown relative to VC treatment with ACTB as internal control. Data are in biological triplicates (n = 3 per group) apart from VC in PDX-DA is a technical duplicate. (D) Log2FC mRNA expression measured by RT-qPCR in primary patients with MCL (7949 and 1972), treated for 3 days with 500 nM PRT-382 in vitro. Data are normalized to GAPDH and shown relative to VC. Data are biological triplicates or duplicates. (E) PTPROt protein expression evaluated by immunohistochemistry (IHC) staining in spleens obtained from PDX-AA animals treated in vivo with PRT-382 or VC. Quantification of IHC PTPROt-stained slides showing the proportion of pixels positive for staining. Each dot represents an individual mouse. (F) Jeko-1 cells were treated with DMSO control or 500 nM PRT-382 for 5 days then evaluated for protein expression of PTPROt by confocal microscopy. The total number of cells counted and the percentage of cells positive for fluorescent immunolabeling of PTPROt is shown. (G) The indicated MCL cell lines were treated with day 9 IC50 values of PRT-382, and protein lysates were collected at day 6 and immunoblotted for PIK3IP1 with β-tubulin as a loading control. Protein expression densitometry values shown normalized to loading control and relative to 0 nM DMSO control–treated cells. (H) Jeko-1 cells were treated with 500 nM PRT-382 and Granta-519 cells were treated with 50 nM PRT-382 out to 8 days. Protein lysates were immunoblotted for PHLDA3, p-AKT(s473), and AKT with α-tubulin and GAPDH as loading controls.
Discussion
PRMT5 is a type II methyltransferase and the primary mediator of SDMA of arginine residues on histone and nonhistone proteins.22,23,44 Here, we used a SAM-competitive small-molecule inhibitor of PRMT5 to show the utility of this strategy in MCL cell lines, primary patient samples, and animal models of this disease. We mechanistically characterized the consequence of PRMT5 inhibition in promoting MCL cell death through its effects on multiple pathways regulating cell cycle (E2F/RB), apoptosis (p53), and proliferation (BCR and AKT).
Our findings support functional/WT-p53 as predicting a favorable response to PRMT5 inhibition in MCL. Previous evidence indicates that overexpressed Cyclin-D1/PRMT5 cooperates to silence WT-p53, rendering it functionally inactive. PRMT5 methylation of p53 modifies p53-dependent transcription and antagonizes p53 tumor suppressor activity.20,26,35 In addition, PRMT5 has been implicated in silencing p53 by supporting proper splicing of the p53 negative regulator MDM4.26 Here, we show that targeting PRMT5 in MCL stabilizes p53 protein levels, resulting in increased activity of the p53 target CDKN1A, which encodes the cell cycle arresting protein p21 to initiate G1 cell cycle arrest and proapoptotic cell death. In MCL cell lines with a nonfunctional or mutated p53, transcriptional activation of CDKN1A/p21 is not observed, thus cells continue through the G1/S checkpoint and ultimately arrest at the G2/M checkpoint. Apoptotic cell death was achieved in WT and mutated p53 models of MCL, suggesting that alternative prodeath mechanisms are triggered by PRMT5 inhibition in this genetic context. Patients with mutated p53 MCL may benefit from combined inhibition of PRMT5 with agents directed at inducing a mitochondrial apoptotic response, such as venetoclax or other BH3 mimetic compounds.
Although MTAP-deleted tumors are particularly vulnerable to pharmacologic inhibition of PRMT5, MTAP deletion is associated with poor outcomes in MCL.45 Our in vitro studies confirm that PRMT5 inhibition provides a favorable response in MTAP-deleted MCL cells (Figure 3). Importantly, PDX-DA, generated from a treatment-naïve patient with MCL, and PDX-AA, established from a patient with MCL with acquired ibrutinib resistance, were both found to be refractory to ibrutinib treatment. According to published data, MTAP/CDKN2A are codeleted in up to 70% of ibrutinib-resistant patients with MCL.46 The therapeutic activity provided by PRT-382 in the ibrutinib-resistant MCL cell line Granta-519 harboring codeletion of MTAP/CDKN2A and in the PDX-AA provides rationale for exploring PRMT5 as a therapeutic target to overcome ibrutinib-resistant MCL.4 Interestingly, in the PDX-DA, PRT-382 provided therapeutic benefit in mice that progressed on ibrutinib (Figure 2C); however, further work is needed to assess the ability of PRT-382 to resensitize MCL cells to ibrutinib through inhibition of AKT signaling,47,48 which is known to be upregulated in ibrutinib-resistant MCL.
We used an unbiased pharmacogenomic approach to identify transcriptional signatures contributing to PRMT5 inhibitor–mediated growth arrest and cell death in MCL (Figure 4). Our RNA sequencing study revealed global transcriptional reprogramming with PRMT5 inhibition, with more than 2000 up and down DEGs. Many of the downregulated transcripts after PRMT5 inhibition were cell cycle checkpoints required for cell cycle progression and proper DNA replication. Observed in the top 50 upregulated DEGs were many p53 target genes, negative regulators of BCR signaling, and inflammatory cytokine response genes.
Arginine methylation of the transcription factor E2F1 has been observed in solid tumors and, more recently, in MPN.25 We were able to demonstrate this in MCL by showing decreased methylation of E2F1 and phosphorylation of RB, with reduced expression of many E2F target genes involved in cell cycle progression (Figure 5). MCL is characterized by a high degree of genomic instability, which results from high levels of endogenous DNA damage and dysregulation of DNA damage repair pathways.49 For example, 40% to 75% of MCL cases carry a mutation in ATM, a kinase required for the activation of p53 in response to DNA damage.1-3 Among the E2F targets downregulated after treatment with PRT-382 are proteins controlling cell cycle checkpoints (CHK1) and DNA repair (RAD51) (Figure 5A). Our results indicate PRMT5 inhibition of MCL cells results in DNA damage as assessed by H2AX phosphorylation, followed by apoptotic cell death (cleavage of caspase-3 and PARP) (Figure 6). We hypothesize this may be the result of inhibition of DNA repair mechanisms through downregulation of RAD51 and demethylation of 53BP119 and loss of cell cycle checkpoints (CHK1), promoting cell cycle progression despite DNA damage. MCL is characterized by a high degree of genomic instability, which could be further enhanced with PRMT5 inhibition driving activation of p53 in MCL cells with functional p53.
Antigen-dependent BCR signaling contributes to the MCL phenotype, where activation within the lymphoid microenvironment promotes the aberrant growth and survival of malignant cells.3 Here, we show recruitment of the repressive histone mark H3R8me2s to the promoter region of the BCR phosphatase, PTPRO and validate the loss of this methylated arginine residue after PRMT5 inhibition (Figure 7B). Inhibiting PRMT5 re-established expression of PTPROt, supporting the notion that PRMT5 epigenetically suppresses PTPROt expression also in MCL. BCR signaling promotes PRMT5 expression in B-cell lymphoma through a PI3K-AKT-MYC positive feedback loop.50 These findings are particularly relevant to our work as we show here that treatment of MCL cells with PRT-382 leads to upregulation of the PI3K inhibitor (PIK3IP1) and the negative regulator of AKT activity (PHLDA3), indicating that targeting PRMT5 results in the inhibition of multiple steps of the BCR-PI3K/AKT signaling. Future preclinical studies may consider the combined treatment of BTK-targeted therapies with PRMT5 inhibitors to achieve synergistic inhibition of the BCR pathway and may consider upfront combinatory treatment strategies to mitigate the potential compensatory hyperactivation of PI3K-AKT BTK-bypass mechanisms.
Our studies demonstrate that PRMT5 promotes MCL cell survival by regulating DNA damage repair/replication (E2F1), the tumor suppressor functions of p53, and epigenetically silencing negative regulators of the BCR pathway (PHLDA3, PTPROt, and PIK3IP1) and provide a strong rationale for targeting PRMT5 in this disease.
Acknowledgments
The authors are grateful to the patients and healthy volunteers who provided tissue samples for these studies.
This work was supported by the Ohio State University (OSU) Genomics Shared Resource, the OSU Leukemia Tissue Bank Shared Resource, the OSU Comparative Pathology and Digital Imaging Shared Resource (P30 CA016058), and the Nationwide Children’s Hospital Genomics Core Facility. The OSU Leukemia Tissue Bank is supported by grant NCIP30CA016058. This work was supported by the National Institutes of Health (NIH), National Cancer Institute (NCI) Cancer Center Support grant P01 CA214274-01A1 and a Mantle Cell Lymphoma Research Initiative grant from the Leukemia Lymphoma Society (MCL7001-18 [R.A.B.]). S.P. is supported by NIH/NCI grants R01 CA252222 and CA244899 and Tisch Cancer Institute grant P30 CA196521.
Authorship
Contribution: S.L.S., L.A., and R.A.B. designed this project and wrote the manuscript; S.L.S., F.B., M.L., B.P., J.-H.C., J.H.-M., L.V., S.K., C.H., C.W., A.S., A.P., E.B., Y.Y., and W.K.C. conducted experiments, analyzed results, and generated figures; M.L. and B.P. performed and analyzed histopathology; O.E., D.B., J.F., C.M., and C.E.M. completed bioinformatic analysis; Z.C. completed statistical analysis; K.V. and P.S. provided PRMT5 inhibitors; L.S., W.H., S.P., R.L., S.C.-K., and M.D.L. provided guidance on the design of this project and reviewed the manuscript; and all authors approved the final manuscript.
Conflict-of-interest disclosure: R.A.B. receives research funding from Prelude Therapeutics. K.V. and P.S. are employed by Prelude Therapeutics and provided research funding. The remaining authors declare no competing financial interests.
Correspondence: Robert A. Baiocchi, Division of Hematology, Department of Internal Medicine, 400 W 12th Ave, 481B Wiseman CCC, Columbus, OH 43210; e-mail: robert.baiocchi@osumc.edu; and Lapo Alinari, Division of Hematology, Department of Internal Medicine, 400 W 12th Ave, 481D Wiseman CCC, Columbus, OH 43210; e-mail: lapo.alinari@osumc.edu.
References
Author notes
∗R.A.B. and L.A. contributed equally to this work.
RNA-seq data are available at Gene Expression Omnibus under accession number GSE220936.
WES data of PDXs and primary samples from patients with MCL are available upon request.
The online version of this article contains a data supplement.
The publication costs of this article were defrayed in part by page charge payment. Therefore, and solely to indicate this fact, this article is hereby marked “advertisement” in accordance with 18 USC section 1734.

![Inhibition of PRMT5 activates negative regulators of BCR/PI3K/AKT signaling. (A) PTPRO and PIK3IP1 mRNA expression measured by RT-qPCR in MCL samples (n = 10 total samples: cell lines [n = 3], PDX [n = 2], primary patient samples [n = 5], activated normal B cells [n = 5], and resting normal B cells [n=7]). Data show normalized fold expression relative to resting normal B cells (n = 7) using ACTB as internal control. (B) ChIP assay was performed with antibody H3R8me2s crosslinked magnetic beads. Retained DNA was amplified by qPCR with PTPRO and PIK3IP1 TaqMan primers. Fold enrichment was calculated relative to the input sample (PI). (C) Log2FC mRNA expression measured by RT-qPCR in PDX-DA and PDX-AA cells treated in vivo. Data are shown relative to VC treatment with ACTB as internal control. Data are in biological triplicates (n = 3 per group) apart from VC in PDX-DA is a technical duplicate. (D) Log2FC mRNA expression measured by RT-qPCR in primary patients with MCL (7949 and 1972), treated for 3 days with 500 nM PRT-382 in vitro. Data are normalized to GAPDH and shown relative to VC. Data are biological triplicates or duplicates. (E) PTPROt protein expression evaluated by immunohistochemistry (IHC) staining in spleens obtained from PDX-AA animals treated in vivo with PRT-382 or VC. Quantification of IHC PTPROt-stained slides showing the proportion of pixels positive for staining. Each dot represents an individual mouse. (F) Jeko-1 cells were treated with DMSO control or 500 nM PRT-382 for 5 days then evaluated for protein expression of PTPROt by confocal microscopy. The total number of cells counted and the percentage of cells positive for fluorescent immunolabeling of PTPROt is shown. (G) The indicated MCL cell lines were treated with day 9 IC50 values of PRT-382, and protein lysates were collected at day 6 and immunoblotted for PIK3IP1 with β-tubulin as a loading control. Protein expression densitometry values shown normalized to loading control and relative to 0 nM DMSO control–treated cells. (H) Jeko-1 cells were treated with 500 nM PRT-382 and Granta-519 cells were treated with 50 nM PRT-382 out to 8 days. Protein lysates were immunoblotted for PHLDA3, p-AKT(s473), and AKT with α-tubulin and GAPDH as loading controls.](https://ash.silverchair-cdn.com/ash/content_public/journal/blood/142/10/10.1182_blood.2022019419/2/m_blood_bld-2022-019419-gr7.jpeg?Expires=1769063771&Signature=sdK5pBg1c0Ezs2F~1s0FXsdtBd7Xqpveht2Gl62MmQ2Ly8YMfXMTG7qV2sL44IWfV0rK77WodSEONTXlG9Ry76FBXyVuZ4FsKBf9S~6ocSX77PMMmlExH3sn8n12fVw9Cw83R0z6VyE-PNz6PaFHfjXAf1LC3TCFLAJnWHIZ5zlCun5lH2abhyCZgtmTR8s~e4qPGiVNTZW3LS6IOFplLSmnNiqknUmMqf-aH2-BuhwfKDlp-qRYaGL6QFIr586IwX9orIFSLEbeleS58pPqcuFcfhEb8OqIMZQwBj5TT3Bt1FADhX6dmi-L8Z7-oXUU0DQ3DM52sD0kiB~enaFy2A__&Key-Pair-Id=APKAIE5G5CRDK6RD3PGA)

![Inhibition of PRMT5 activates negative regulators of BCR/PI3K/AKT signaling. (A) PTPRO and PIK3IP1 mRNA expression measured by RT-qPCR in MCL samples (n = 10 total samples: cell lines [n = 3], PDX [n = 2], primary patient samples [n = 5], activated normal B cells [n = 5], and resting normal B cells [n=7]). Data show normalized fold expression relative to resting normal B cells (n = 7) using ACTB as internal control. (B) ChIP assay was performed with antibody H3R8me2s crosslinked magnetic beads. Retained DNA was amplified by qPCR with PTPRO and PIK3IP1 TaqMan primers. Fold enrichment was calculated relative to the input sample (PI). (C) Log2FC mRNA expression measured by RT-qPCR in PDX-DA and PDX-AA cells treated in vivo. Data are shown relative to VC treatment with ACTB as internal control. Data are in biological triplicates (n = 3 per group) apart from VC in PDX-DA is a technical duplicate. (D) Log2FC mRNA expression measured by RT-qPCR in primary patients with MCL (7949 and 1972), treated for 3 days with 500 nM PRT-382 in vitro. Data are normalized to GAPDH and shown relative to VC. Data are biological triplicates or duplicates. (E) PTPROt protein expression evaluated by immunohistochemistry (IHC) staining in spleens obtained from PDX-AA animals treated in vivo with PRT-382 or VC. Quantification of IHC PTPROt-stained slides showing the proportion of pixels positive for staining. Each dot represents an individual mouse. (F) Jeko-1 cells were treated with DMSO control or 500 nM PRT-382 for 5 days then evaluated for protein expression of PTPROt by confocal microscopy. The total number of cells counted and the percentage of cells positive for fluorescent immunolabeling of PTPROt is shown. (G) The indicated MCL cell lines were treated with day 9 IC50 values of PRT-382, and protein lysates were collected at day 6 and immunoblotted for PIK3IP1 with β-tubulin as a loading control. Protein expression densitometry values shown normalized to loading control and relative to 0 nM DMSO control–treated cells. (H) Jeko-1 cells were treated with 500 nM PRT-382 and Granta-519 cells were treated with 50 nM PRT-382 out to 8 days. Protein lysates were immunoblotted for PHLDA3, p-AKT(s473), and AKT with α-tubulin and GAPDH as loading controls.](https://ash.silverchair-cdn.com/ash/content_public/journal/blood/142/10/10.1182_blood.2022019419/2/m_blood_bld-2022-019419-gr7.jpeg?Expires=1769063772&Signature=tnWGcDztWEHGYa3VnQ50Oz20pH-mLd9muDa4DELK1E4azqqt4H8FkcYodadZrsUKpyVuy6KRUyX5h6igDwvSWTne7aZxiolrhVWtJLQnpBjUhHSX27evBBLCi0rVQhEv6DenX2DXOW5SuZd~NxoEnjx0-7EVIUCicXAslT7~NSkAtITquH43T2L0O-1qnXWkH8ga0vC5V3RcFaBiFWcrJAfeOmSgTa6PVrOd2QJAM~jCljgL5ZCTean8STWi6Is4wmySewihj7iwNJDCzj-wmDeir1yLAhuVhpPM7OJ663AHVFFYQV~PoeM0bB3wuJ83GgL-c-46fcAh5BRspK3-sw__&Key-Pair-Id=APKAIE5G5CRDK6RD3PGA)