Key Points
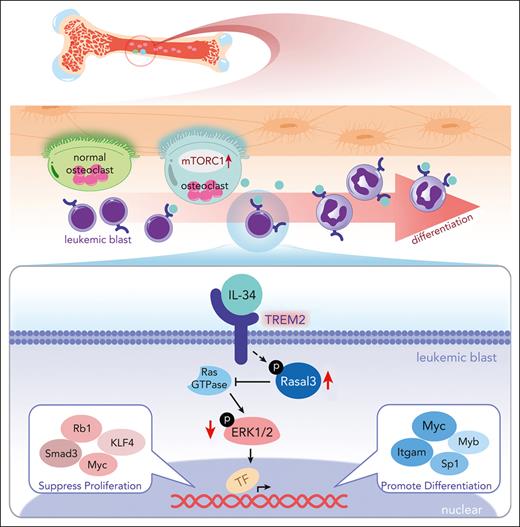
IL-34 is produced by mechanistic target of rapamycin complex 1-overactivated osteoclasts and suppresses AML in various preclinical models.
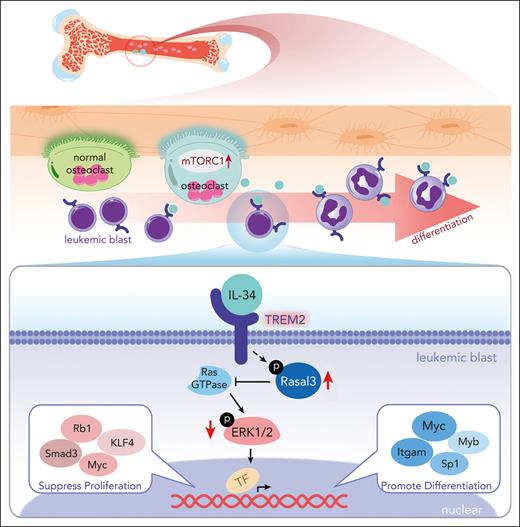
TREM2 is a novel receptor for IL-34 to induce myeloid differentiation by inhibiting ERK1/2/Rasal3 signaling.
Abstract
The bone marrow microenvironment supports leukocyte mobilization and differentiation and controls the development of leukemias, including acute myeloid leukemia (AML). Here, we found that the development of AML xenotransplants was suppressed in mice with osteoclasts tuberous sclerosis 1 (Tsc1) deletion. Tsc1-deficient osteoclasts released a high level of interleukin-34 (IL-34), which efficiently induced AML cell differentiation and prevented AML progression in various preclinical models. Conversely, AML development was accelerated in mice deficient in IL-34. Interestingly, IL-34 inhibited AML independent of its known receptors but bound directly to triggering receptor expressed on myeloid cells 2 (TREM2), a key hub of immune signals. TREM2-deficient AML cells and normal myeloid cells were resistant to IL-34 treatment. Mechanistically, IL-34–TREM2 binding rapidly phosphorylated Ras protein activator like 3 and inactivated extracellular signal-regulated protein kinase 1/2 signaling to prevent AML cell proliferation and stimulate differentiation. Furthermore, TREM2 was downregulated in patients with AML and associated with a poor prognosis. This study identified TREM2 as a novel receptor for IL-34, indicating a promising strategy for overcoming AML differentiation blockade in patients with AML.
Introduction
Acute myeloid leukemia (AML) is a stem cell disease caused by the massive mobilization and differentiation arrest in primordial granulocytes and is characterized by a low survival rate and high recurrence.1,2 Although AML comprises many disparate genetic subtypes, they share the characteristic of differentiation failure.3 Differentiation-induction therapy thus represents a breakthrough treatment strategy for AML.4-6 However, many problems still exist, including irreversible resistance, toxic effects, and limitations of the available targeted inhibitors because of the genetic heterogeneity of AML among individual patients.7 There is an urgent need for the development of safe and effective therapeutic strategies to induce AML cell differentiation.
AML has a hierarchical structure similar to that of normal hematopoiesis,8 and understanding the regulatory complexities of normal and disordered hematopoiesis may aid the discovery of novel therapeutic targets. Bone marrow (BM) niches are local microenvironments partly created by accessory cell types, including skeletal cells, which support leukocyte mobilization and differentiation.9 Bone-forming osteoblastic and bone-resorbing osteoclastic lineages are key niche components in the bone, and blockage or ablation of either osteoblast or osteoclast function could impair hematopoiesis.10,11 We recently showed that the constitutive activation of the mechanistic target of rapamycin complex 1 via the deletion of its upstream inhibitor, tuberous sclerosis 1 (Tsc1), leads to the release of interleukin-19 (IL-19) to promote granulopoiesis and neutrophil formation in mice.12 The cellular and molecular accessory components in the niches may alter their stem cell differentiation potential. These microenvironments thus provide a valuable resource for exploring intrinsic prodifferentiation determinants.
Triggering receptor expressed on myeloid cells 2 (TREM2) is a cell surface receptor that functions as a major pathology-induced immune signaling hub.13,14 Physiologically, TREM2 expression is restricted to myeloid cells in a small number of niches.15 In the context of tissue damage or disease, TREM2 signaling becomes central in sensing signals or cytokines released by the injured tissues, triggering myeloid immune reactions to restrict its spread.16-18 Genetic variants of TREM2 significantly increase the risk of Alzheimer disease, in line with its essential role in microglia viability and activities to remove amyloid plaques. Microglial TREM2 was recently identified as a potential therapeutic target for treating Alzheimer disease.13,19 However, the role of TREM2 in leukemic malignancies, including in AML, has not been reported.
In this study, we found that Tsc1-deficient osteoclasts can release IL-34, a cytokine that is important in innate immunity,20 which in turn induced myeloid differentiation. IL-34 bound directly to TREM2 and rapidly phosphorylated Ras protein activator like 3 (Rasal3) and inhibited extracellular signal-regulated protein kinase (ERK) 1/2 signaling, consequently stimulating differentiation in AML cells. Importantly, TREM2 expression was exceedingly low in patients with AML and was associated with a poor prognosis. We therefore identified TREM2 as a novel receptor for IL-34 and highlight IL-34 as a promising differentiation therapy for myeloid malignancies.
Methods
Detailed information about mouse strains, cell lines, cell analysis, RNA sequencing, mouse analysis, surface plasmon resonance (SPR), protein measurements, phosphoproteomics analysis, reagents, antibodies, primers, and short hairpin RNAs are provided in the supplemental Materials, available on the Blood website.
Mice study
All animal studies were approved by the Ethical Committee for Animal Research of Southern Medical University and were conducted in accordance with the state guidelines from the Ministry of Science and Technology of China. For xenograft models derived from patients with AML, 2 × 10⁵ primary human CD34+ AML cells were transplanted into mice. Mice underwent irradiation with 250 cGy, 24 hours before intravenous transplantation. Mice were subjected to bleeding weekly, and the peripheral blood (PB) was assessed via flow cytometry with antihuman CD45 antibody (BioLegend, San Diego, CA). When human CD45 chimerism reached >1%, NCG mice were treated by administering an intraperitoneal injection of recombinant human IL-34 (R&D Systems, Minneapolis, MN, 50 or 100 μg/kg), 60 mg/kg cytarabine (Ara-C), or vehicle (phosphate-buffered saline) every other day for 2 weeks. For AML cell line models, mice were treated as described, 7 days after receiving transplantation. PB chimerism and blood counts were analyzed weekly. The mice were euthanized on day 28 after inoculation, and tissues were collected for pathological analysis. Survival rates and body weight changes in the mice were recorded continuously.
Clinical samples preparation
Diagnostic BM aspirates, heparinized PB samples, and healthy adult human PB and BM samples were provided by the Department of Hematology, Zhujiang Hospital (Southern Medical University, Guangzhou, China), after obtaining informed consent, in accordance with the Declaration of Helsinki (ethics number: 2022-KY-046). Mutation profiles of patients are shown in supplemental Tables 1 and 2.
Public database analysis
An RNA sequencing data set for a cohort with 417 AML cases (GSE37642) was used for survival analysis in accordance with TREM2 expression. Data from GSE33223 and GSE90062 were used to evaluate TREM2 gene expression levels in patients with AML and healthy controls.
Results
IL-34 suppressed AML progression and stimulated AML cell differentiation in vitro and in vivo
We previously showed that the constitutive activation of mechanistic target of rapamycin complex 1 in osteoclasts (Ctsk-cre) by Tsc1 ablation increased the number of osteoclasts in mice, indicating an enhanced myeloid (osteoclast precursors) mobilization potential in the BM microenvironment.21 By analyzing the hematopoietic marrow composition in Tsc1Ctsk mice, we found that granulocyte differentiation was promoted, but no significant difference was observed in the proportions of other myeloid subpopulations (supplemental Figure 1A). To determine the influence of the Tsc1Ctsk mice BM microenvironment on AML, we used a green fluorescent protein (GFP) reporter C1498 murine leukemia cell line (C1498-GFP+) to model AML in Tsc1Ctsk and their littermate controls (supplemental Figure 1B). We found that the overall survival rate was improved (supplemental Figure 1C), and leukemia cell invasion was reduced in AML-Tsc1Ctsk mice (supplemental Figure 1D-E), accompanied by a significant increase in the percentage of mature granulocytes compared with that in the control mice (supplemental Figure 1F-G). These findings suggested that Tsc1-deficient osteoclasts may create a niche to suppress leukemic development in the BM. Accordingly, we performed messenger RNA profile analysis and found that IL-3422,23 (supplemental Figure 1H) was markedly increased in Tsc1-deficient osteoclasts (supplemental Figure 1I-K).
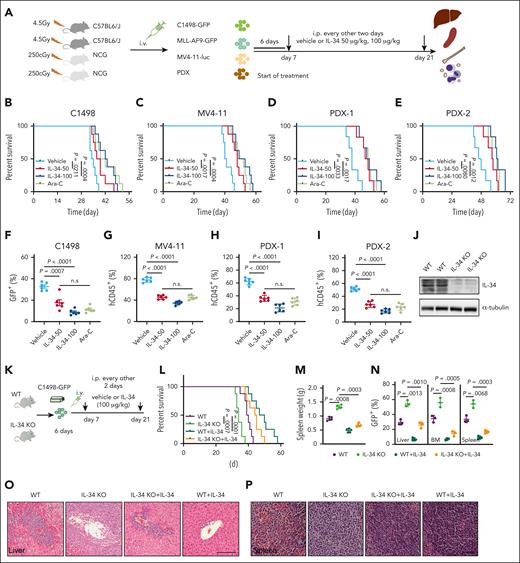
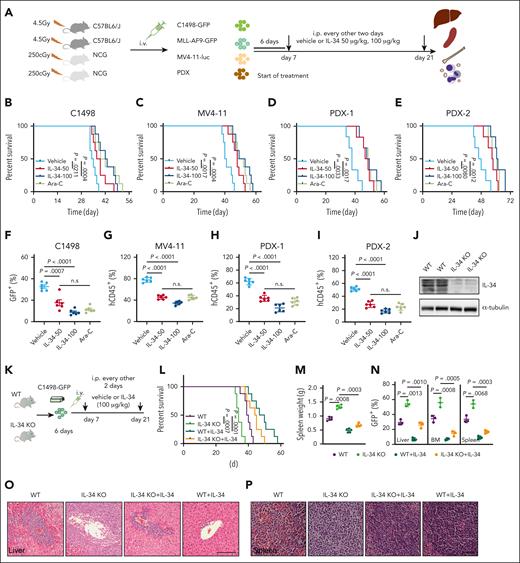
To define the anti-AML potential of IL-34, we generated a variety of AML mouse models, including C1498-GFP–driven, MLL-AF9-GFP–driven, MV4-11-luciferase–driven leukemia, and patient-derived xenograft (PDX) models (Figure 1A). IL-34 prolonged the survival (Figure 1B-E; supplemental Figure 2H), reduced the expansion of leukemic blasts (Figure 1F-I; supplemental Figure 2A-F), and suppressed splenomegaly (supplemental Figure 2G) and invasion into organs (supplemental Figure 2I-L) in all these mice with AML compared with mice treated with the vehicle control. The effect of IL-34 on AML was similar to that of Ara-C, which is widely used for the clinical treatment of AML. We further confirmed the anti-AML function of IL-34 by generating IL-34 knockout (KO) mice (Figure 1J). IL-34 KO mice and wild-type (WT) littermate controls received transplantation with C1498-GFP+ cells and were treated with or without IL-34 (Figure 1K). Mice deficient in IL-34 exhibited increased mortality (Figure 1L), more severe splenomegaly (Figure 1M), and elevated leukemic cell propagation in organs (Figure 1N-P) compared with WT mice. Notably, these phenotypes were rescued by the administration of IL-34 (Figure 1L-P). These results demonstrate the therapeutic potential of IL-34 in AML.
IL-34 suppressed AML progression and improved survival in vivo. (A) Experimental strategy of C1498-GFP, MLL-AF9-GFP, and MV4-11–luciferase and mice with PDXs. (B-E) Kaplan-Meier survival curves of mice with C1498-GFP xenotransplants (B; n = 8), mice with MV4-11 xenotransplants (C; n = 8), and mice with PDXs (D-E; n = 6) after treatment with vehicle, IL-34 (50 or 100 μg/kg), or Ara-C. P values determined using log-rank test. (F) Fluorescence-activated cell sorting analysis of the percentage of GFP+ AML cells in the BM of mice with C1498-GFP xenotransplants at day 28 (n = 6). (G) NCG mice received implantation with luciferase-expressing MV4-11 cells and were treated with IL-34 as indicated (n = 6). Flow cytometry analysis of the percentage of human CD45 cells obtained from the BM of mice with leukemia. (H) Percentage of human CD45+ cells in the BM of NCG mice with xenografts derived from patients with AML (PDX-1) and that were treated with the indicated doses of IL-34 or Ara-C (n = 6). (I) Percentage of human CD45+ cells in the BM of NCG mice that received transplantation with xenografts derived from patients with AML (PDX-2) and were treated with the indicated doses of IL-34 or Ara-C (n = 6). (J) Representative western blots of spleen samples from WT or IL-34 KO mice. (K) In vivo AML model in IL-34 KO and WT mice treated with vehicle or IL-34. (L) Kaplan-Meier survival analysis of IL-34 KO or WT mice with leukemia with or without treatment with IL-34. Statistical analysis using the log-rank (Mantel-Cox) test (n = 6). (M) Spleen weights of mice in panel K (n = 5). (N) Fluorescence-activated cell sorting analysis of the percentage of GFP+ AML cells in the liver, BM, and spleen from mice in panel K at day 28 (n = 3). (O-P) Hematoxylin and eosin–stained liver (O) and spleen (P) from mice in panel K. Scale bars, 100 μm. Statistical significance was calculated using one-way analysis of variance (ANOVA) with Tukey multiple comparison test. Data are representative of at least 3 independent experiments, with cohorts of the indicated number of mice per group.
IL-34 suppressed AML progression and improved survival in vivo. (A) Experimental strategy of C1498-GFP, MLL-AF9-GFP, and MV4-11–luciferase and mice with PDXs. (B-E) Kaplan-Meier survival curves of mice with C1498-GFP xenotransplants (B; n = 8), mice with MV4-11 xenotransplants (C; n = 8), and mice with PDXs (D-E; n = 6) after treatment with vehicle, IL-34 (50 or 100 μg/kg), or Ara-C. P values determined using log-rank test. (F) Fluorescence-activated cell sorting analysis of the percentage of GFP+ AML cells in the BM of mice with C1498-GFP xenotransplants at day 28 (n = 6). (G) NCG mice received implantation with luciferase-expressing MV4-11 cells and were treated with IL-34 as indicated (n = 6). Flow cytometry analysis of the percentage of human CD45 cells obtained from the BM of mice with leukemia. (H) Percentage of human CD45+ cells in the BM of NCG mice with xenografts derived from patients with AML (PDX-1) and that were treated with the indicated doses of IL-34 or Ara-C (n = 6). (I) Percentage of human CD45+ cells in the BM of NCG mice that received transplantation with xenografts derived from patients with AML (PDX-2) and were treated with the indicated doses of IL-34 or Ara-C (n = 6). (J) Representative western blots of spleen samples from WT or IL-34 KO mice. (K) In vivo AML model in IL-34 KO and WT mice treated with vehicle or IL-34. (L) Kaplan-Meier survival analysis of IL-34 KO or WT mice with leukemia with or without treatment with IL-34. Statistical analysis using the log-rank (Mantel-Cox) test (n = 6). (M) Spleen weights of mice in panel K (n = 5). (N) Fluorescence-activated cell sorting analysis of the percentage of GFP+ AML cells in the liver, BM, and spleen from mice in panel K at day 28 (n = 3). (O-P) Hematoxylin and eosin–stained liver (O) and spleen (P) from mice in panel K. Scale bars, 100 μm. Statistical significance was calculated using one-way analysis of variance (ANOVA) with Tukey multiple comparison test. Data are representative of at least 3 independent experiments, with cohorts of the indicated number of mice per group.
Next, we explored the effects of IL-34 on the gene expression profiles in C1498 murine AML cells to determine its impact on growth properties. Gene ontology enrichment analysis revealed that IL-34 induced differential expression of multiple genes that are associated with the regulation of leukocyte differentiation (Figure 2A-B), suggesting that IL-34 might trigger leukemic cell differentiation to delay AML. Expectedly, IL-34 treatment had a beneficial effect on leukemic cell differentiation, with an observed increase in the proportion of mature myeloid type in the BM (Figure 2C-G; supplemental Figure 3A-D). The increase of apoptotic GFP+ cells in vivo indicated the end point of these differentiated AML cells (supplemental Figure 3E). Notably, leukemia cell differentiation was blocked in IL-34 KO mice and was restored via IL-34 treatment (Figure 2H-J). Consistently, IL-34 strongly stimulated the differentiation of different AML cell lines and primary AML cells (Figure 2K-L), and IL-34–treated cells were characterized by the indented or segmented nucleus (Figure 2M). In addition, IL-34 reduced the number of viable leukemia cells in a dose-dependent manner (supplemental Figure 4A-B), resulting in smaller colonies (supplemental Figure 4C). Quantification of viable CD45dim blasts and colonies of CD34+ AML blasts showed a significant reduction in viable AML cells in most of the tested cases after incubation with recombinant human IL-34, whereas that of CD34+ cells from healthy donors showed no such results (supplemental Figure 4D-E). These results suggest that IL-34 could alter the destiny of leukemic cells by forcing their leukemic differentiation.
The therapeutic doses of many AML agents, including Ara-C, may have toxic effects. It is advantageous that IL-34 promotes the differentiation of murine BM myeloid cells into macrophages (supplemental Figure 4F) with no impact on cell survival (supplemental Figure 4G-H). Moreover, IL-34 administration did not cause osteoporosis (supplemental Figure 5) or tissue damage in healthy adult mice (supplemental Figure 4I-K), nor other adverse reactions in terms of blood cell numbers (supplemental Figure 4L), indicating low toxic side effects of IL-34 as a therapeutic agent.
IL-34 induced leukemia cell differentiation independently of its known receptors CSF1R, PTPRZ1, and SDC1, and bound directly to TREM2
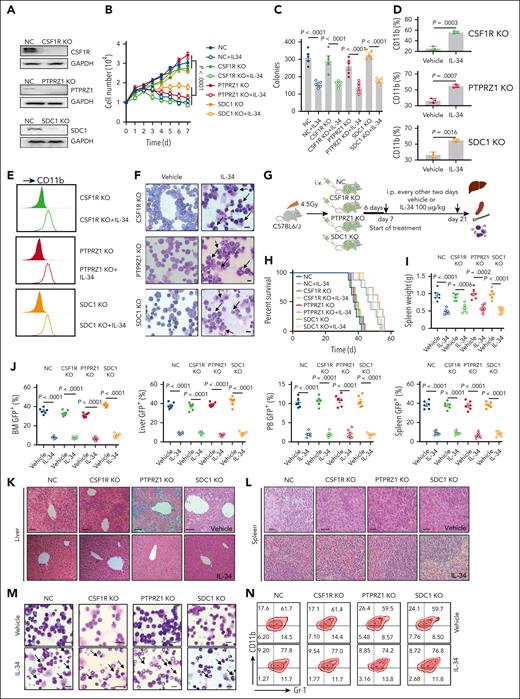
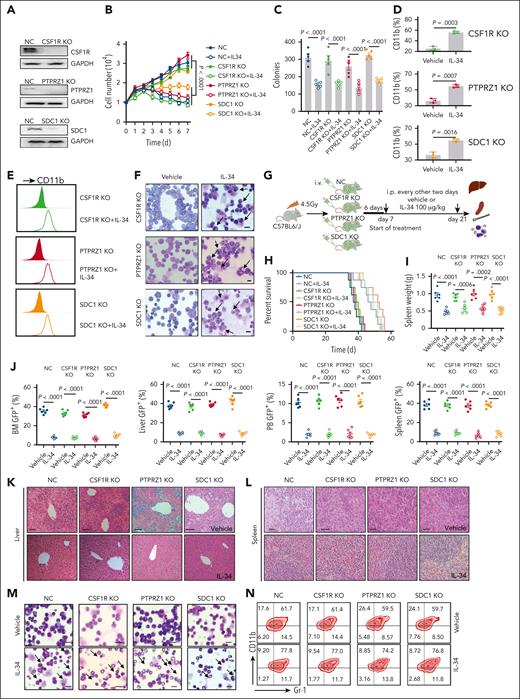
Colony-stimulating factor 1 receptor (CSF1R) has been reported to have a high affinity for IL-34,24 whereas the cell surface chondroitin sulfate proteoglycans receptor-type tyrosine-protein phosphatase zeta (PTPRZ1) and syndecan-1 (SDC1) were also found to be functional receptors for IL-34.25,26 To investigate whether the functions of IL-34 in leukemia depended on these receptors, we established C1498-GFP cell lines with the disruption of CSF1R, PTPRZ1, or SDC1 using CRISPR/CRISPR-associated protein 9 technology. Unexpectedly, the deletion of CSF1R, PTPRZ1, or SDC1 (Figure 3A) did not prevent the inhibitory effect of IL-34 on C1498 cell growth (Figure 3B-C). IL-34 increased CD11b+ myeloid cells (Figure 3D-E) and granulocytic maturation (Figure 3F), regardless of the absence of these receptors. Importantly, deletion of any of these 3 receptors had no effect on the antileukemic function of IL-34 in the C1498-transplanted model (Figure 3G). IL-34 treatment consistently prolonged survival (Figure 3H), reduced splenomegaly (Figure 3I), prevented leukemia invasion (Figure 3J-L), caused morphological changes (Figure 3M), and increased the proportion of mature myeloid cells (Figure 3N) in mice that had received transplantation with CSF1R-, PTPRZ1-, SDC1-deleted cells, or control C1498 cells. These results indicate that IL-34 can induce C1498 cell differentiation and suppress leukemia development independently of CSF1R, PTPRZ1, and SDC1.
IL-34 induced myeloid differentiation and displayed anti-AML activity, independent of CSF1R, PTPRZ1, and SDC1. (A) Western blot analysis showing CSF1R, PTPRZ1, and SDC1 KO efficiency in C1498 cells. Glyceraldehyde 3-phosphate dehydrogenase (GAPDH) was the loading control. (B) Growth curves of C1498 cells transfected with CSF1R, PTPRZ1, or SDC1 KO lentiviruses with or without IL-34 treatment (n = 3). (C) Colony-forming ability of C1498 cells after CSF1R, PTPRZ1, and SDC1 KO, with or without IL-34 treatment (n = 5). (D) Percentage of CD11b in C1498 cells after indicated KO, with or without IL-34 treatment in grafts (n = 3). (E) Flow cytometry analysis of CD11b expression in panel D. (F) Representative Giemsa staining images showing morphology of C1498 cells after CSF1R, PTPRZ1, and SDC1 KO, with or without IL-34 treatment. (G) Schematic of generation of mouse models of AML by engrafting C57BL/6J mice with GFP-labeled C1498 cells infected with indicated KO lentiviruses (5 × 10⁶ cells per mouse), followed by in vivo treatment with vehicle vs IL-34 (100 μg/kg, intraperitoneally every 2 days). (H) Kaplan-Meier survival curves of mice that underwent engraftment with C1498-KO cells and dosed with IL-34 as indicated (n = 10). Statistical analysis using the log-rank (Mantel-Cox) test. (I) Spleen weights from mice with AML dosed as described in panel G (n = 6). (J) Percentage of GFP+ leukemia blasts in the BM, liver, PB, and spleen from mice with AML treated with IL-34 or vehicle (n = 6). (K-L) Representative images of hematoxylin and eosin–stained liver (K) and spleen (L) sections from mice with AML treated with IL-34 or vehicle. Scale bars, 20 μm. (M) Wright-Giemsa–stained BM in mice that underwent engraftment with indicated C1498-KO cells and dosed with IL-34. Scale bars, 10 μm. (N) Flow cytometry plots depicting the percentage of CD11b+Gr-1+ cells in the BM of mice from panel M. Statistical significance was calculated using one-way ANOVA with Tukey multiple comparison test. Data are representative of at least 3 independent experiments, with cohorts of the indicated number of mice per group.
IL-34 induced myeloid differentiation and displayed anti-AML activity, independent of CSF1R, PTPRZ1, and SDC1. (A) Western blot analysis showing CSF1R, PTPRZ1, and SDC1 KO efficiency in C1498 cells. Glyceraldehyde 3-phosphate dehydrogenase (GAPDH) was the loading control. (B) Growth curves of C1498 cells transfected with CSF1R, PTPRZ1, or SDC1 KO lentiviruses with or without IL-34 treatment (n = 3). (C) Colony-forming ability of C1498 cells after CSF1R, PTPRZ1, and SDC1 KO, with or without IL-34 treatment (n = 5). (D) Percentage of CD11b in C1498 cells after indicated KO, with or without IL-34 treatment in grafts (n = 3). (E) Flow cytometry analysis of CD11b expression in panel D. (F) Representative Giemsa staining images showing morphology of C1498 cells after CSF1R, PTPRZ1, and SDC1 KO, with or without IL-34 treatment. (G) Schematic of generation of mouse models of AML by engrafting C57BL/6J mice with GFP-labeled C1498 cells infected with indicated KO lentiviruses (5 × 10⁶ cells per mouse), followed by in vivo treatment with vehicle vs IL-34 (100 μg/kg, intraperitoneally every 2 days). (H) Kaplan-Meier survival curves of mice that underwent engraftment with C1498-KO cells and dosed with IL-34 as indicated (n = 10). Statistical analysis using the log-rank (Mantel-Cox) test. (I) Spleen weights from mice with AML dosed as described in panel G (n = 6). (J) Percentage of GFP+ leukemia blasts in the BM, liver, PB, and spleen from mice with AML treated with IL-34 or vehicle (n = 6). (K-L) Representative images of hematoxylin and eosin–stained liver (K) and spleen (L) sections from mice with AML treated with IL-34 or vehicle. Scale bars, 20 μm. (M) Wright-Giemsa–stained BM in mice that underwent engraftment with indicated C1498-KO cells and dosed with IL-34. Scale bars, 10 μm. (N) Flow cytometry plots depicting the percentage of CD11b+Gr-1+ cells in the BM of mice from panel M. Statistical significance was calculated using one-way ANOVA with Tukey multiple comparison test. Data are representative of at least 3 independent experiments, with cohorts of the indicated number of mice per group.
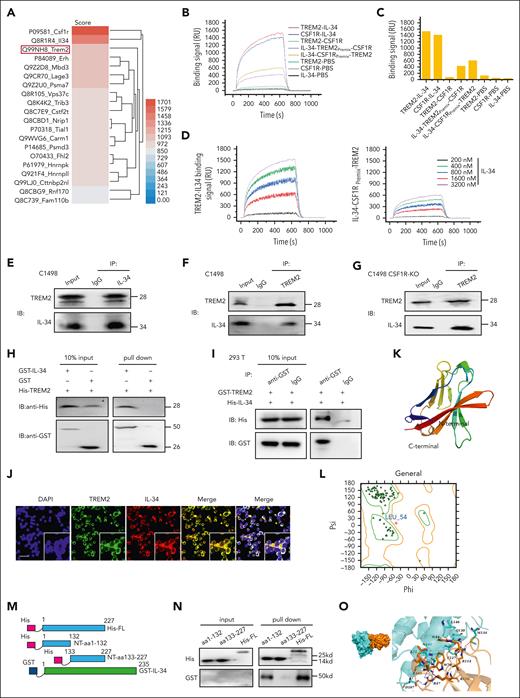
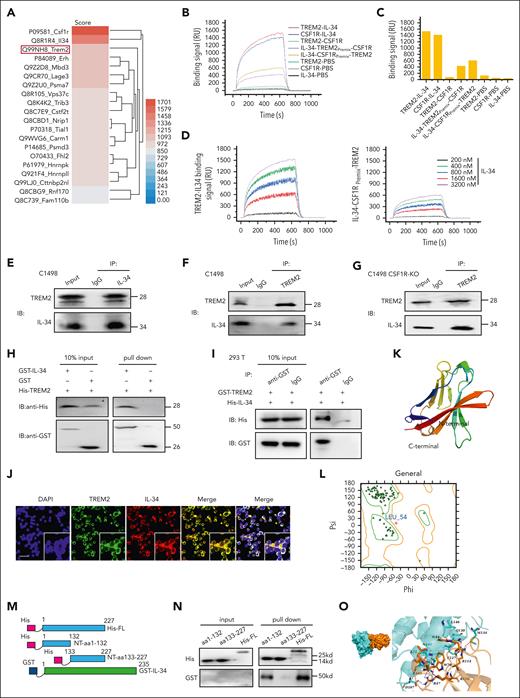
We, therefore, screened for alternative IL-34 receptors in C1498 cells via SPR analysis combined with high-performance liquid chromatography–tandem mass spectrometry. The top 20 proteins identified as potential targets of IL-34 were listed, and TREM2 was unexpectedly included with a high score (Figure 4A). We further performed an SPR binding-affinity measurement of IL-34 and TREM2 or CSF1R and found that IL-34 required a much lower concentration of TREM2 than that of CSF1R, indicating that TREM2 bound more tightly to IL-34 than CSF1R in leukemic C1498 cells. Consistently, IL-34 premixed with CSF1R still showed a high affinity toward TREM2, whereas IL-34 binding to TREM2 reduced its affinity toward CSF1R (Figure 4B-C). Furthermore, SPR imaging assay showed that IL-34 bound to TREM2 in a dose-dependent manner, even when IL-34 was already bound to CSF1R (Figure 4D; supplemental Table 3).
IL-34 induced leukemia cell differentiation independent of known receptors CSF1R, PTPRZ1, and SDC1, but bound directly to TREM2. (A) Heat map of IL-34 target proteins in C1498 cells. (B) Binding response curves of IL-34–TREM2, IL-34–CSF1R, and TREM2–CSF1R, validated by SPR analysis. (C) Binding affinity described in panel B. (D) (Left) SPR imaging (SPRi) assay involving TREM2 and IL-34. (Right) SPRi assay detecting TREM2 and IL-34 premixed with CFS1R. (E-F) Coimmunoprecipitation assay of endogenous TREM2 and IL-34 in C1498 cells. (G) Coimmunoprecipitation assay of endogenous TREM2 and IL-34 in CSF1R KO cells. (H) Direct binding of GST–IL-34 to His-TREM2 using GST pulldown assay. (I) Coimmunoprecipitation assay of exogenous GST-tagged TREM2 and His-tagged IL-34. (J) Representative immunofluorescence images revealing co-localization of exogenous IL-34 (red) and TREM2 (green) in C1498 cells. Scale bar, 100 μm. (K) The homology model of TREM2. (L) Ramachandran plot for TREM2. Dark green dots represent residues in favored regions; yellow dots represent residues in allowed regions; red cross represents residues in irrational regions. (M) Schematic diagram of TREM2 constructs: His-tagged NT-aa1-132, His-tagged NT-aa133 to 227, and full-length TREM2 His-FL-aa1-227. (N) GST pulldown assay examining interactions between GST-fused IL-34 and various His-TREM2 protein fragments. (O) Molecular docking model of interaction between IL-34 and TREM2. (Left) surface binding model of IL-34 with TREM2. (Right) detailed interaction between IL-34 and TREM2. IL-34, colored cyan; TREM2, colored orange; residues in IL-34, colored cyan; residues in TREM2, colored orange; red dashes represent hydrogen bond interactions; and blue dashes represent salt bridges.
IL-34 induced leukemia cell differentiation independent of known receptors CSF1R, PTPRZ1, and SDC1, but bound directly to TREM2. (A) Heat map of IL-34 target proteins in C1498 cells. (B) Binding response curves of IL-34–TREM2, IL-34–CSF1R, and TREM2–CSF1R, validated by SPR analysis. (C) Binding affinity described in panel B. (D) (Left) SPR imaging (SPRi) assay involving TREM2 and IL-34. (Right) SPRi assay detecting TREM2 and IL-34 premixed with CFS1R. (E-F) Coimmunoprecipitation assay of endogenous TREM2 and IL-34 in C1498 cells. (G) Coimmunoprecipitation assay of endogenous TREM2 and IL-34 in CSF1R KO cells. (H) Direct binding of GST–IL-34 to His-TREM2 using GST pulldown assay. (I) Coimmunoprecipitation assay of exogenous GST-tagged TREM2 and His-tagged IL-34. (J) Representative immunofluorescence images revealing co-localization of exogenous IL-34 (red) and TREM2 (green) in C1498 cells. Scale bar, 100 μm. (K) The homology model of TREM2. (L) Ramachandran plot for TREM2. Dark green dots represent residues in favored regions; yellow dots represent residues in allowed regions; red cross represents residues in irrational regions. (M) Schematic diagram of TREM2 constructs: His-tagged NT-aa1-132, His-tagged NT-aa133 to 227, and full-length TREM2 His-FL-aa1-227. (N) GST pulldown assay examining interactions between GST-fused IL-34 and various His-TREM2 protein fragments. (O) Molecular docking model of interaction between IL-34 and TREM2. (Left) surface binding model of IL-34 with TREM2. (Right) detailed interaction between IL-34 and TREM2. IL-34, colored cyan; TREM2, colored orange; residues in IL-34, colored cyan; residues in TREM2, colored orange; red dashes represent hydrogen bond interactions; and blue dashes represent salt bridges.
Subsequently, we investigated the endogenous interaction between IL-34 and TREM2 via coprecipitation analysis. Data have shown that IL-34 can interact with TREM2 in C1498 cells (Figure 4E-F), and similar data were obtained for C1498-CSF1R KO cells (Figure 4G), confirming that IL-34 binding to TREM2 is independent of CSF1R. We further constructed plasmids expressing the full-length mouse TREM2 or IL-34 and purified the TREM2 protein with an N-terminal (NT) His tag and glutathione S-transferase (GST)–IL-34. GST pulldown assay showed that His-TREM2 bound to GST–IL-34 (Figure 4H). We then transfected human embryonic kidney (HEK) cells to express GST-tagged TREM2 (GST-TREM2) or tag-His IL–34 (His IL-34), and confirmed an interaction between exogenous His IL-34 and GST-TREM2 (Figure 4I). After incubation with culture supernatant from IL-34-HEK cells, immunofluorescence examination showed that TREM2 colocated with IL-34 on C1498 cell surface (Figure 4J).
Using the structure of phosphatidylserine bound to a WT immunoglobulin domain (protein database code: 6B8O), we developed a homology model of TREM2 (supplemental Figure 6). Ramachandran plot analysis showed that >90% of residues had allowed conformations (Figure 4K-L). To further determine the region of TREM2 responsible for the interaction with IL-34, we made His-tagged NT aa1-aa132 of TREM2 (NT–aa1-132), His-tagged NT aa133-227 of TREM2 (NT–aa133-227), and His-tagged full-length TREM2 constructs (Figure 4M), and expressed these proteins in HEK cells. GST-tagged IL-34 was associated with the full-length or NT–aa1-132 fragment of TREM2 but not with the NT–aa133-227 fragment (Figure 4N). Computational molecular docking modeling indicated that the predicted binding-site residues in TREM2 bound to IL-34 contained Trp70, Leu71, Arg116, Arg114, Trp44, and Arg47, consistent with our coprecipitation data (Figure 4O; supplemental Table 4). Overall, these results indicate that IL-34 is recognized by leukemic cells via TREM2.
TREM2 mediated the effects of IL-34 on cell differentiation
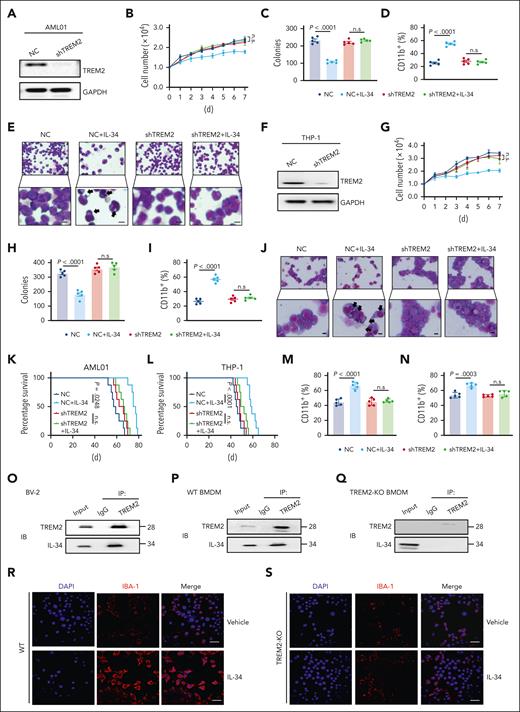
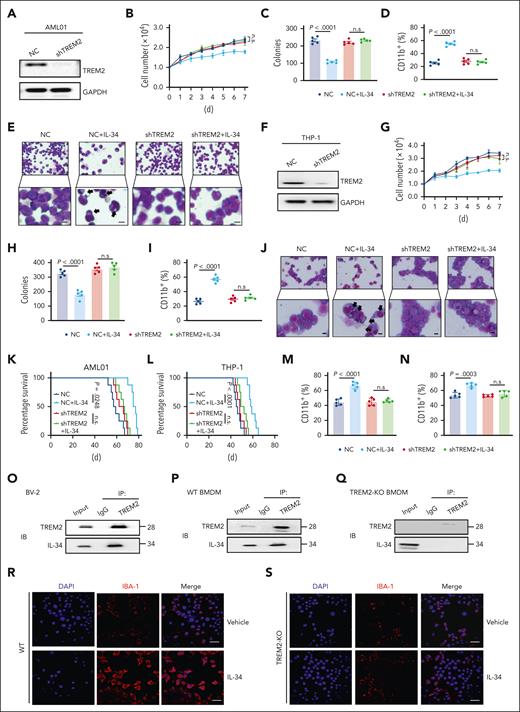
To demonstrate the functional involvement of TREM2 in leukemic cell differentiation and AML progression, we established TREM2 knockdown AML primary blasts (AML01-shTREM2) and THP-1 cells (THP-1-shTREM2), and TREM2 KO C1498 cells (C1498-TREM2-KO; Figure 5AF; supplemental Figure 7A). Notably, the influences of IL-34 on cell proliferation and colony formation (Figure 5B-C,G-H; supplemental Figure 7B), the biochemical characteristics of differentiation (Figure 5D,I; supplemental Figure 7C), and morphological changes (Figure 5E,J; supplemental Figure 7D) were absent in TREM2-null cells. IL-34 administration also lost its beneficial effect in mice that had received transplantation with AML01-shTREM2, THP-1-shTREM2, and C1498-TREM2-KO, which exhibited higher mortality (Figure 5K-L; supplemental Figure 7E) and accelerated organ invasion (supplemental Figure 7F-K) compared with placebo therapeutic controls. In addition, mature myeloid phenotypes were not detected in the context of TREM2 deficiency (Figure 5M-N; supplemental Figure 7L). These results confirm that IL-34 induces AML cell differentiation and prevents AML progression via TREM2, rather than CSF1R, PTPRZ1, or SDC1.
TREM2 was identified as a functional receptor mediating the effects of IL-34 on myeloid differentiation and AML progression. (A) Western blots confirming the KO of TREM2 expression in primary AML cells (AML01). (B) Growth curves of AML01-shTREM2, and AML01-NC cells after treatment with IL-34 (100 ng/mL) at the indicated time points (n = 3). (C) Colony-forming ability of primary AML cells after short hairpin RNA (shRNA)-mediated KO of TREM2, with or without treatment with IL-34 (n = 5). (D) Flow cytometry analysis of CD11b expression in AML01-shTREM2, and AML01-NC cells after IL-34 treatment (n = 5). (E) Representative Giemsa staining images showing the morphology of AML01-shTREM2, and AML01-NC cells after IL-34 treatment. Arrows highlight distinct morphology indicative of differentiation. Scale bars, 10 μm. (F) Western blots showing the KO efficiency of shTREM2 in THP-1 cells. (G) Growth curves of THP-1-shTREM2, and THP-1-NC cells after treatment with IL-34 (100 ng/mL) at the indicated time points (n = 3). (H) Colony-forming ability of THP-1 cells after shRNA-mediated knockdown of TREM2 with or without treatment with IL-34 (n = 5). (I) Flow cytometry analysis of CD11b expression in THP-1-shTREM2, and THP-1-NC cells after IL-34 treatment (n = 5). (J) Representative Giemsa staining images showing the morphology of THP-1-shTREM2, and THP-1-NC cells after IL-34 treatment. Arrows highlight distinct morphology indicative of differentiation. Scale bars, 10 μm. (K) Kaplan-Meier survival curves of mice that received transplantation with AML01-shTREM2, and AML01-NC cells treated with IL-34. Statistical assessment using log-rank test (n = 8). (L) Kaplan-Meier survival curves of mice that received transplantation with with THP-1-shTREM2, and THP-1-NC cells treated with IL-34. Statistical assessment by log-rank test (n = 8). (M) Percentage of CD11b+Gr-1+ cells in the BM of mice with AML01-shTREM2 grafts or AML01-NC grafts (n = 5). (N) Percentage of CD11b+Gr-1+ cells in the BM of mice with THP-1-shTREM2 grafts or THP-1-NC grafts (n = 5). (O) Coimmunoprecipitation assay of endogenous TREM2 and IL-34 in BV-2 microglial cells. (P) Coimmunoprecipitation assay of endogenous TREM2 and IL-34 in WT bone marrow–derived macrophages (BMDMs). (Q) The interaction between endogenous TREM2 and IL-34 in TREM2-deficiency BMDMs. (R-S) Representative immunostaining for IBA-1 (red) in primary BMDMs from WT (R) or TREM2-KO mice (S), after 3 days treatment with 10 ng/mL M-CSF (vehicle) or 100 ng/mL IL-34. Scale bars, 10 μm. Statistical significance was calculated using one-way ANOVA with Tukey multiple comparison test. Western blot images were representative of at least 3 independent experiments.
TREM2 was identified as a functional receptor mediating the effects of IL-34 on myeloid differentiation and AML progression. (A) Western blots confirming the KO of TREM2 expression in primary AML cells (AML01). (B) Growth curves of AML01-shTREM2, and AML01-NC cells after treatment with IL-34 (100 ng/mL) at the indicated time points (n = 3). (C) Colony-forming ability of primary AML cells after short hairpin RNA (shRNA)-mediated KO of TREM2, with or without treatment with IL-34 (n = 5). (D) Flow cytometry analysis of CD11b expression in AML01-shTREM2, and AML01-NC cells after IL-34 treatment (n = 5). (E) Representative Giemsa staining images showing the morphology of AML01-shTREM2, and AML01-NC cells after IL-34 treatment. Arrows highlight distinct morphology indicative of differentiation. Scale bars, 10 μm. (F) Western blots showing the KO efficiency of shTREM2 in THP-1 cells. (G) Growth curves of THP-1-shTREM2, and THP-1-NC cells after treatment with IL-34 (100 ng/mL) at the indicated time points (n = 3). (H) Colony-forming ability of THP-1 cells after shRNA-mediated knockdown of TREM2 with or without treatment with IL-34 (n = 5). (I) Flow cytometry analysis of CD11b expression in THP-1-shTREM2, and THP-1-NC cells after IL-34 treatment (n = 5). (J) Representative Giemsa staining images showing the morphology of THP-1-shTREM2, and THP-1-NC cells after IL-34 treatment. Arrows highlight distinct morphology indicative of differentiation. Scale bars, 10 μm. (K) Kaplan-Meier survival curves of mice that received transplantation with AML01-shTREM2, and AML01-NC cells treated with IL-34. Statistical assessment using log-rank test (n = 8). (L) Kaplan-Meier survival curves of mice that received transplantation with with THP-1-shTREM2, and THP-1-NC cells treated with IL-34. Statistical assessment by log-rank test (n = 8). (M) Percentage of CD11b+Gr-1+ cells in the BM of mice with AML01-shTREM2 grafts or AML01-NC grafts (n = 5). (N) Percentage of CD11b+Gr-1+ cells in the BM of mice with THP-1-shTREM2 grafts or THP-1-NC grafts (n = 5). (O) Coimmunoprecipitation assay of endogenous TREM2 and IL-34 in BV-2 microglial cells. (P) Coimmunoprecipitation assay of endogenous TREM2 and IL-34 in WT bone marrow–derived macrophages (BMDMs). (Q) The interaction between endogenous TREM2 and IL-34 in TREM2-deficiency BMDMs. (R-S) Representative immunostaining for IBA-1 (red) in primary BMDMs from WT (R) or TREM2-KO mice (S), after 3 days treatment with 10 ng/mL M-CSF (vehicle) or 100 ng/mL IL-34. Scale bars, 10 μm. Statistical significance was calculated using one-way ANOVA with Tukey multiple comparison test. Western blot images were representative of at least 3 independent experiments.
Notably, IL-34–TREM2 binding stimulates differentiation not only in leukemic blasts but also in healthy myeloid cells. We first performed immunoprecipitation analysis and found that IL-34 interacted with TREM2 in the BV-2 microglial cell line (Figure 5O) and mice primary BM macrophages (Figure 5P), with undetectable interaction in TREM2-KO cells (Figure 5Q). Furthermore, we found that IL-34 administration also enhanced the expression of IBA-1, a microglial maturation marker in BM progenitors–derived microglia-like cells, which was partially reversed by TREM2 KO (Figure 5R-S). These data indicate that IL-34 functions dependently of TREM2 to stimulate the differentiation, or to maintain the maturation state, of myeloid cells.
IL-34–TREM2 rapidly inactivated ERK1/2 through phosphorylation of Rasal3 to induce AML cell differentiation
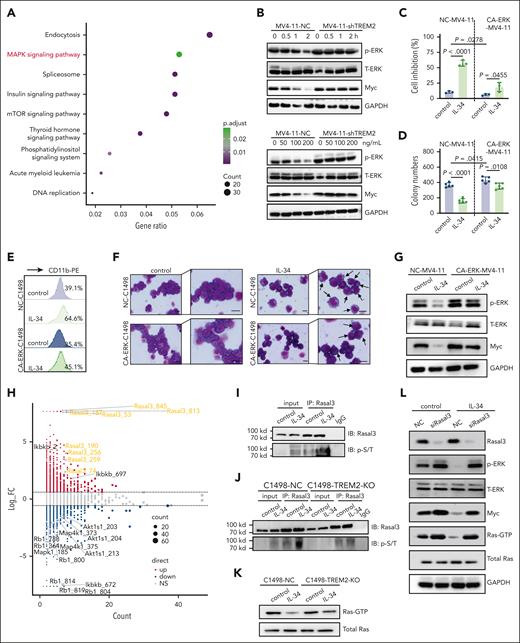
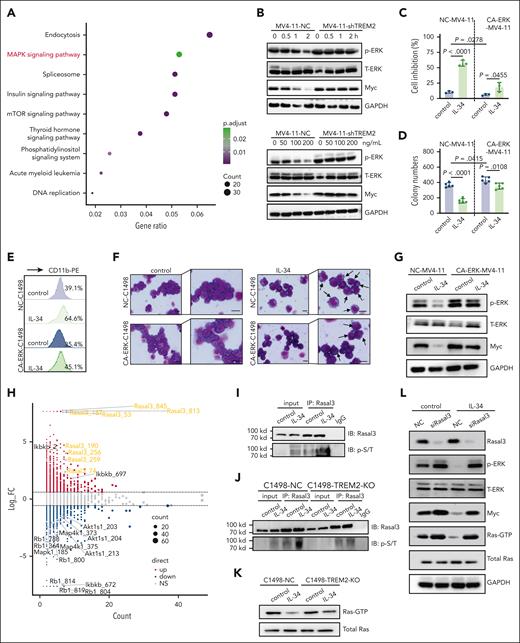
Next, we performed quantitative phosphoproteomics analysis to obtain information on the signaling cascades of the IL-34–TREM2 interaction in AML cells and the quantitative differences induced by IL-34. Kyoto Encyclopedia of Genes and Genomes results showed that mitogen-activated protein kinase (MAPK) signaling pathways were mainly enriched after IL-34 stimulation (Figure 6A). The degree of MAPK activation is reportedly related to AML malignancy. ERK1/2 signaling, a key component of MAPK family, is a master regulator of cell proliferation and differentiation.27,28 We confirmed that IL-34 rapidly dephosphorylated ERK1/2 in various AML cell lines and AML blasts and reduced the expression level of the transcription factor Myc, an essential ERK1/2 downstream target, in a dose- and time-dependent manner, whereas TREM2 deletion eliminated the inhibition of ERK1/2 by IL-34 (Figure 6B; supplemental Figure 8A-F). Moreover, AML cells with constitutively active ERK1/2 were resistant to the inhibitory effects of IL-34 on cell viability and colony formation (Figure 6C-D; supplemental Figure 9A-D). Furthermore, IL-34 reduced Myc protein level and induced mature myeloid cell formation in control C1498 cells (NC-C1498), MV4-11, THP-1, and primary human AML cells, whereas the effects were significantly attenuated in cells with constitutively activated ERK1/2 (Figure 6E-G; supplemental Figure 9E-G). These results suggest that the therapeutic effect of IL-34 on AML occurs via the inhibition of ERK1/2 signaling.
IL-34–TREM2 rapidly inactivated ERK1/2 partly via the phosphorylation of Rasal3 to induce AML cell differentiation. (A) Kyoto Encyclopedia of Genes and Genomes pathway enrichment analysis of C1498 cells treated with IL-34 or phosphate-buffered saline. (B) Western blot analysis of ERK1/2 protein/phosphorylation and Myc protein in MV4-11-NC and MV4-11-shTREM2 cells treated with IL-34 at the indicated concentrations (0, 50, 100, and 200 ng/mL) and time points (0, 0.5, 1, and 2 hours). (C-D) Overexpression of phosphorylated-ERK1/2 reversed the effects of IL-34 on MV4-11 cell growth (C) and colonies (D). Mean ± standard deviation (n = 3). Unpaired t test. (E-F) Overexpression of phosphorylated-ERK1/2 reversed the effects of IL-34 on C1498 cell differentiation. Scale bars, 10 μm. (G) Western blots demonstrating overexpression of phosphorylated-ERK1/2 in MV4-11 cells and resultant changes in Myc protein level in response to IL-34 treatment. (H) Scatter plot and statistics of IL-34-regulated (100 ng/mL, 30 minutes) phosphorylations in C1498 cells. (I) Coimmunoprecipitation analysis using the antibody against Rasal3 followed by western blot analysis using antibodies against phosphorylated Thr/Ser in C1498 cells treated with IL-34. (J) Western blots indicating comparable levels between phosphorylated Thr/Ser in C1498-NC and C1498-TREM2-KO cells. (K) Western blot analysis of GTP-binding Ras activity in C1498-NC and C1498-TREM2-KO cells, treated with or without IL-34. (L) Western blots demonstrating the KO of Rasal3 expression in MV4-11 cells with activated Ras GTPase in response to IL-34 treatment. Western blot images were representative of at least 3 independent experiments.
IL-34–TREM2 rapidly inactivated ERK1/2 partly via the phosphorylation of Rasal3 to induce AML cell differentiation. (A) Kyoto Encyclopedia of Genes and Genomes pathway enrichment analysis of C1498 cells treated with IL-34 or phosphate-buffered saline. (B) Western blot analysis of ERK1/2 protein/phosphorylation and Myc protein in MV4-11-NC and MV4-11-shTREM2 cells treated with IL-34 at the indicated concentrations (0, 50, 100, and 200 ng/mL) and time points (0, 0.5, 1, and 2 hours). (C-D) Overexpression of phosphorylated-ERK1/2 reversed the effects of IL-34 on MV4-11 cell growth (C) and colonies (D). Mean ± standard deviation (n = 3). Unpaired t test. (E-F) Overexpression of phosphorylated-ERK1/2 reversed the effects of IL-34 on C1498 cell differentiation. Scale bars, 10 μm. (G) Western blots demonstrating overexpression of phosphorylated-ERK1/2 in MV4-11 cells and resultant changes in Myc protein level in response to IL-34 treatment. (H) Scatter plot and statistics of IL-34-regulated (100 ng/mL, 30 minutes) phosphorylations in C1498 cells. (I) Coimmunoprecipitation analysis using the antibody against Rasal3 followed by western blot analysis using antibodies against phosphorylated Thr/Ser in C1498 cells treated with IL-34. (J) Western blots indicating comparable levels between phosphorylated Thr/Ser in C1498-NC and C1498-TREM2-KO cells. (K) Western blot analysis of GTP-binding Ras activity in C1498-NC and C1498-TREM2-KO cells, treated with or without IL-34. (L) Western blots demonstrating the KO of Rasal3 expression in MV4-11 cells with activated Ras GTPase in response to IL-34 treatment. Western blot images were representative of at least 3 independent experiments.
ERK1/2 was previously shown to be inhibited by TREM2, but the underlying mechanism was not clear.29-31 Among the diverse signals based on the screened data, Rasal3, a negative regulator of Ras guanosine triphosphate hydrolase (GTPase) activity,32,33 was highly phosphorylated at multiple sites (Figure 6H). Here, we confirmed that IL-34 enhanced the serine/threonine phosphorylation of Rasal3 (Figure 6I). Notably, in IL-34–treated TREM2-null cells, phosphorylated-Rasal3 could be upregulated (Figure 6J), and the inhibition of Ras GTPase activity was relieved (Figure 6K). Transient KO of Rasal3 expression in AML cells or HEK293 cells enhanced Ras GTPase activity and significantly mitigated the inhibition of Ras GTPase and ERK1/2 by IL-34 (Figure 6L; supplemental Figure 10A-C), confirming the role of Rasal3 in regulating TREM2-mediated Ras/MAPK inhibition. It is worth noting that despite the level of TYRO protein tyrosine kinase–binding protein (DAP12), a well-known TREM2 signaling adapter, with a slight increase upon stimulation with IL-34 (supplemental Figure 11A), there is no significant site-specific change in phosphorylation shown in phosphoproteomic profiling, suggesting that DAP12 is not the primary participant in IL-34–induced pathways. Collectively, we revealed that Rasal3 might mediate IL-34–TREM2 cascades to inhibit ERK1/2 via alterations in Ras GTPase activity.
We have explored several other IL-34–regulated signaling pathways critical to AML development by phosphoproteomics analysis (supplemental Figure 11B) and confirmed that MAP4K1, a newly reported therapeutic target in AML,34 was markedly dephosphorylated by IL-34 in a TREM2-dependent manner (supplemental Figure 11C-F). In addition, leukemic proliferation signals, such as phosphorylated AKT35,36 and retinoblastoma protein37,38 were inhibited, whereas leukemic inhibitory signal-like inhibitor of IκB kinase39 was activated in IL-34–treated C1498 cells (supplemental Figure 11G). These data indicate that IL-34 cooperates with TREM2 to suppress AML, mainly through the inhibition of the MAPK pathway and may also simultaneously influence other kinase signals.
Downregulation of IL-34/TREM2 correlated with AML occurrence and an inferior prognosis
Next, we investigated the clinical relevance of IL-34 and TREM2 signaling in patients with AML. Analysis of integrated data sets revealed a decreased TREM2 level in the BM of patients with AML compared with that in the BM of healthy individuals (Figure 7A-B). Integrated analysis of the data given in GSE37642 also indicated that 208 patients with AML with high TREM2 levels showed prolonged survival, compared with 209 patients with AML and low TREM2 levels (Figure 7C), suggesting a clinical correlation between TREM2 expression and AML prognosis. These results are in line with the higher malignancy of TREM2-deficient AML cells, supporting the potential involvement of TREM2 in leukemia progression. Despite that the expression levels of TREM2 varied in different AML cells, we found that IL-34 did not alter TREM2 expression (supplemental Figure 12A-B), suggesting that IL-34 may induce differentiation by binding to TREM2, rather than altering its expression.
Downregulation of TREM2 correlated with AML occurrence and inferior prognosis. (A) TREM2 profiles in peripheral blood mononuclear cells (PBMCs) from patients with AML (n = 20) and healthy individuals (n = 10; GSE33223). (B) TREM2 profiles in CD34+ blasts from patients with newly diagnosed AML (n = 3) and CD34+ cells from healthy donors (n = 3; GSE90062). (C) Overall survival in patients from the data given in GSE37642. Patient samples in the data sets of GSE37642 were from mononuclear cells (MNCs) isolated from BM aspirates from patients with AML. Log-rank analysis comparing different groups of patients (separated into tertiles) based on relative TREM2 expression (low TREM2 expression [n = 208] and high TREM2 expression [n = 209]). (D) The quantitative reverse transcription polymerase chain reaction analysis of TREM2 expression in bone marrow mononuclear cells (BMMCs) of patients with AML (n = 30) and CD34+ cells from healthy volunteers (n = 9). GAPDH was used as an internal reference gene. (E) Western blot analysis showing TREM2 expression in bulk BMMCs from healthy donors (n = 3) and patients with AML (n = 9) using GAPDH as an internal loading control. (F) Representative flow cytometry analysis of TREM2 expression in BMMCs from patients with AML (n = 18) and healthy individuals (n = 7). (G) Percentage of TREM2-positive cells in CD34+ cells from healthy donors (n = 7) and patients with AML (n = 18). (H) Mean fluorescence intensity (MFI) of TREM2 in CD34+ cells from healthy donors (n = 7) and patients with AML (n = 18). (I) Serum levels of IL-34 from patients with AML (n = 52) and healthy controls (n = 10). (J) Microarray data analysis of samples from patients with AML samples showing a significant positive correlation between the expressions of TREM2 and IL-34.
Downregulation of TREM2 correlated with AML occurrence and inferior prognosis. (A) TREM2 profiles in peripheral blood mononuclear cells (PBMCs) from patients with AML (n = 20) and healthy individuals (n = 10; GSE33223). (B) TREM2 profiles in CD34+ blasts from patients with newly diagnosed AML (n = 3) and CD34+ cells from healthy donors (n = 3; GSE90062). (C) Overall survival in patients from the data given in GSE37642. Patient samples in the data sets of GSE37642 were from mononuclear cells (MNCs) isolated from BM aspirates from patients with AML. Log-rank analysis comparing different groups of patients (separated into tertiles) based on relative TREM2 expression (low TREM2 expression [n = 208] and high TREM2 expression [n = 209]). (D) The quantitative reverse transcription polymerase chain reaction analysis of TREM2 expression in bone marrow mononuclear cells (BMMCs) of patients with AML (n = 30) and CD34+ cells from healthy volunteers (n = 9). GAPDH was used as an internal reference gene. (E) Western blot analysis showing TREM2 expression in bulk BMMCs from healthy donors (n = 3) and patients with AML (n = 9) using GAPDH as an internal loading control. (F) Representative flow cytometry analysis of TREM2 expression in BMMCs from patients with AML (n = 18) and healthy individuals (n = 7). (G) Percentage of TREM2-positive cells in CD34+ cells from healthy donors (n = 7) and patients with AML (n = 18). (H) Mean fluorescence intensity (MFI) of TREM2 in CD34+ cells from healthy donors (n = 7) and patients with AML (n = 18). (I) Serum levels of IL-34 from patients with AML (n = 52) and healthy controls (n = 10). (J) Microarray data analysis of samples from patients with AML samples showing a significant positive correlation between the expressions of TREM2 and IL-34.
We analyzed PB samples to confirm the decreased messenger RNA and protein expression levels of TREM2 in patients with AML compared with expression in CD34+ normal cells from healthy controls (Figure 7D-E). There were fewer TREM2+ cells in grafts from patients with AML compared with grafts from healthy volunteers (Figure 7F-H). Moreover, serum IL-34 levels in healthy individuals were higher than those in patients with AML (Figure 7I), suggesting that insufficient myeloid differentiation-induction factor is relevant to AML progression. By comparing AML cases with different clinical characteristics, higher IL-34 level was found in samples from patients in the more differentiated, mature French-American-British classification subgroups M2 to M5 than in samples from thin immature subgroups M0 and M1 (supplemental Figure 13A). However, no clear link between serum IL-34 level and molecular aberrancies and cytogenetics profile was found (supplemental Figure 13B-C). We also observed a positive correlation between the expression of TREM2 and IL-34 in samples from patients with AML (Figure 7J), emphasizing that TREM2 and IL-34 both correlate with AML occurrence and are important prognostic factors for AML.
Discussion
Being the major reservoir of leukemic blasts, the BM niche is proposed to provide a protective microenvironment for leukemic mobilization. However, the agents and mechanisms responsible for modulating the cross talk between the BM niche and leukemic blasts remain unknown. IL-34 is a pleiotropic cytokine that can function as an autocrine or paracrine growth factor such as CSF-1.40 However, its function in diseases is poorly understood. In this study, we found that cytokine IL-34 can overcome leukemic differentiation blockage. Importantly, we identified TREM2 as a novel receptor for IL-34, which mediated myeloid differentiation by suppressing Ras-ERK1/2 signaling. The interaction between IL-34 and TREM2 not only contributes to normal myeloid differentiation but also reshapes the properties of AML and limits AML propagation, thus demonstrating its role as a potential target for AML therapy.
In 2008, IL-34 was identified as an additional ligand of CSF1R.24 Although recent studies have provided insights into IL-34 biology and its roles in diseases, many questions remain unanswered. Physiologically, IL-34 is specifically expressed in the skin and central nervous system in which it is required for the development of Langerhans cells and microglia, respectively.22,23,41 However, IL-34 can be induced and widely expressed in various tissues under pathological conditions.20 Several studies have shown that IL-34 induced monomacrophage differentiation42 and promoted osteoclastogenesis in vitro,43 but its role in granulocyte differentiation and leukemia is still unknown. The promoted granulocyte differentiation in Tsc1Ctsk mice provided evidence that Tsc1-null osteoclasts probably facilitate differentiation progression to compensate for functional defects by elevating IL-34 level. Notably, although IL-34 can compete with CSF1 for CSF1R binding, it has a lower affinity and correspondingly lower activity than CSF1 in mice.40,44 CSF1R deficiency was thus associated with a pronounced osteopetrosis phenotype and severe systemic depletion of myeloid lineages,45 whereas mice deficient in IL-34 showed relatively normal osteoclasts and other myeloid subpopulations,46 except for microglia and Langerhans cells. Furthermore, a high level of IL-34 expression was observed in samples collected from patients with multinuclear osteoclastoma, a skeletal disease that tends to accelerate osteoclastogenesis,47 suggesting that IL-34 might be functional in myeloid differentiation under pathological conditions. Previously published evidence suggests that IL-34 is not the primary growth factor for myeloid development in the BM under physiological conditions22; this, combined with our results, suggests that IL-34 may act as a pathogenic biomarker and therapeutic target in disease.20
IL-34 interacts with multiple receptors to perform diverse and context-dependent functions. Although IL-34 stimulated CSF1R-expressing leukemia cell lines to differentiate into monocyte-like type in vitro,48 CSF1R was not expressed in most leukemic blasts in vivo,49 suggesting that the functions of IL-34 in leukemic blasts were probably not mediated via CSF1R, PTPRZ,25 and SDC126; however, PTPRZ is primarily expressed on neuronal progenitors and glial cells, whereas SDC1 binds IL-34 with low affinity.50 Using receptor-deficient AML transplantation models, we demonstrated that IL-34–promoted differentiation of leukemic blasts was not mediated by these known receptors. In contrast, we identified TREM2 as a novel receptor that bound to IL-34 with higher affinity than CSF1R in AML cells, implicating a potential role for TREM2 in AML.
TREM2 can sense tissue damage and interact with a wide array of anionic molecules, both free and bound to the plasma membrane, to restrict the spread of damage in pathological conditions.14 Different signal affinity interactions can differentially modulate TREM2 activation, and the cell-type specificity of the functions and modes of TREM2 signaling is closely related to various injury and pathological processes.14 TREM2 deficiency or the R47H variant is considered as a genetic risk factor and an effective therapeutic target for neurodegeneration.17,51,52 Unlike the brain, the mechanism through which TREM2 dysfunction or deficiency53 affect hemopoiesis is poorly defined. Notably, TREM2 expression had significantly reduced in patients with AML and was associated with poor prognosis, emphasizing its essential role in AML development. Our data showed that IL-34 induced differentiation in AML cells with varying levels of TREM2 expression but had no effect on cells with TREM2 deficiency, suggesting that insufficient myeloid differentiation inducers may be an important cause.
The molecular mechanisms by which the TREM2-ligand interaction and signaling control the tissue microenvironment are poorly understood. Interactions with different ligands can differentially modulate the strength and direction of TREM2 signaling.54 As indicated earlier, the inhibitory signaling in immune cells might result from low-avidity interactions between DAP12–TREM2 and its ligand, whereas high-avidity ligands can induce full activation of DAP12 to initiate the subsequent activating signals.55 However, although the SPR assay indicated a high affinity of IL-34 for TREM2, we found a weak phosphorylation change of DAP12 in response to IL-34. These results suggest that the IL-34–TREM2 complex may not signal via engaging DAP12. Moreover, we found that IL-34 rapidly inhibited ERK1/2 cascades in leukemic lineages, the essential pathway to stimulate cell proliferation and to prevent differentiation,27 and phosphorylated Rasal3, which contributes to ERK1/2 suppression in the context of IL-34 binding to TREM2. Previous studies showed that ERK1/2 was activated in AML and was a potent target for AML therapy.56 Our results verified that the blockage of ERK1/2 signaling was essential for the anti-AML effect of IL-34. However, further studies are needed to clarify how IL-34–TREM2 phosphorylates Rasal3 and suppresses ERK1/2, and to establish whether other TREM2-associated factors are involved in this process. Given the low cytotoxicity, significant efficacy in AML, and recognition specificity for myeloid differentiation receptor TREM2, IL-34 holds promise as a therapeutic option for the treatment of AML.
Acknowledgments
This work was supported by the National Natural Science Foundation of China (grants 81991510, 81991511, 82100155, 81871745, and 82070906).
Authorship
Contribution: X.B., Y.Z., G.X., X.X., and W.Z. conceived and designed the analysis; X.X., W.Z., M.X., J.Q., and H.W. collected the data; S.Z., L.M., S.H., Y.P., W.Y., B.G., Y.G., and J.Y. contributed data and data analysis; Z.Q. and T.W. performed the bioinformatics analysis; Y.Q., Y.H., and Y.L. collected clinical samples; X.B., Y.Z., and X.X. wrote the paper; and all authors approved the final version of the manuscript.
Conflict-of-interest disclosure: The authors declare no competing financial interests.
Correspondence: Xiaochun Bai, Department of Cell Biology, School of Basic Medical Sciences, Guangdong Provincial Key Laboratory of Bone and Joint Degenerative Diseases, Southern Medical University, Guangzhou, 510515, China; e-mail: baixc15@smu.edu.cn; Yue Zhang, Department of Cell Biology, School of Basic Medical Sciences, Guangdong Provincial Key Laboratory of Bone and Joint Degenerative Diseases, Southern Medical University, Guangzhou, 510515, China; e-mail: yugi@smu.edu.cn; and Guozhi Xiao, Guangdong Provincial Key Laboratory of Cell Microenvironment and Disease Research, Shenzhen Key Laboratory of Cell Microenvironment and School of Medicine, Southern University of Science and Technology, Shenzhen, 518055, China; e-mail: xiaogz@sustech.edu.cn.
References
Author notes
∗X.X., W.Z., and M.X. contributed equally to this study.
RNA sequencing data reported in this paper are available at NCBI Sequence Read Archive (accession numbers PRJNA803147 and PRJNA801857).
Data are available on request from the corresponding author Xiaochun Bai (baixc15@smu.edu.cn).
The online version of this article contains a data supplement.
There is a Blood Commentary on this article in this issue.
The publication costs of this article were defrayed in part by page charge payment. Therefore, and solely to indicate this fact, this article is hereby marked “advertisement” in accordance with 18 USC section 1734.

![Downregulation of TREM2 correlated with AML occurrence and inferior prognosis. (A) TREM2 profiles in peripheral blood mononuclear cells (PBMCs) from patients with AML (n = 20) and healthy individuals (n = 10; GSE33223). (B) TREM2 profiles in CD34+ blasts from patients with newly diagnosed AML (n = 3) and CD34+ cells from healthy donors (n = 3; GSE90062). (C) Overall survival in patients from the data given in GSE37642. Patient samples in the data sets of GSE37642 were from mononuclear cells (MNCs) isolated from BM aspirates from patients with AML. Log-rank analysis comparing different groups of patients (separated into tertiles) based on relative TREM2 expression (low TREM2 expression [n = 208] and high TREM2 expression [n = 209]). (D) The quantitative reverse transcription polymerase chain reaction analysis of TREM2 expression in bone marrow mononuclear cells (BMMCs) of patients with AML (n = 30) and CD34+ cells from healthy volunteers (n = 9). GAPDH was used as an internal reference gene. (E) Western blot analysis showing TREM2 expression in bulk BMMCs from healthy donors (n = 3) and patients with AML (n = 9) using GAPDH as an internal loading control. (F) Representative flow cytometry analysis of TREM2 expression in BMMCs from patients with AML (n = 18) and healthy individuals (n = 7). (G) Percentage of TREM2-positive cells in CD34+ cells from healthy donors (n = 7) and patients with AML (n = 18). (H) Mean fluorescence intensity (MFI) of TREM2 in CD34+ cells from healthy donors (n = 7) and patients with AML (n = 18). (I) Serum levels of IL-34 from patients with AML (n = 52) and healthy controls (n = 10). (J) Microarray data analysis of samples from patients with AML samples showing a significant positive correlation between the expressions of TREM2 and IL-34.](https://ash.silverchair-cdn.com/ash/content_public/journal/blood/141/26/10.1182_blood.2022018619/2/m_blood_bld-2022-018619-gr7.jpeg?Expires=1770251373&Signature=Zxvaw8CDVh431psJUWDCSIEZVq7CZxEVs8sjV2KilYiD~1UrSEmdd96XG6DxXAVkVnKc-Xi3sJokt8~YTXyUc5XBkFfqUtKnDAINkksFHIykL4YVBx-nopEHLuPAar27excTUykfZV-17vIVCyAAHRNkmOCBVPRLz-GZtTHKF4Q8lDtU-V7S~1yvkWxMyBMFtrsA2rr7MN92ovcTjg5qdXIhSeboNUObRxNDl5oMZNWIGt~voJTZz0RVt092rPtySA8qJVgxKzIrNJe-DiB3oPLbBj7jGXmXkaMj54o6fR-ECpiJgHLA14KcMqpOnI8mT1T2Xb68xljziX0p~nALnQ__&Key-Pair-Id=APKAIE5G5CRDK6RD3PGA)

![Downregulation of TREM2 correlated with AML occurrence and inferior prognosis. (A) TREM2 profiles in peripheral blood mononuclear cells (PBMCs) from patients with AML (n = 20) and healthy individuals (n = 10; GSE33223). (B) TREM2 profiles in CD34+ blasts from patients with newly diagnosed AML (n = 3) and CD34+ cells from healthy donors (n = 3; GSE90062). (C) Overall survival in patients from the data given in GSE37642. Patient samples in the data sets of GSE37642 were from mononuclear cells (MNCs) isolated from BM aspirates from patients with AML. Log-rank analysis comparing different groups of patients (separated into tertiles) based on relative TREM2 expression (low TREM2 expression [n = 208] and high TREM2 expression [n = 209]). (D) The quantitative reverse transcription polymerase chain reaction analysis of TREM2 expression in bone marrow mononuclear cells (BMMCs) of patients with AML (n = 30) and CD34+ cells from healthy volunteers (n = 9). GAPDH was used as an internal reference gene. (E) Western blot analysis showing TREM2 expression in bulk BMMCs from healthy donors (n = 3) and patients with AML (n = 9) using GAPDH as an internal loading control. (F) Representative flow cytometry analysis of TREM2 expression in BMMCs from patients with AML (n = 18) and healthy individuals (n = 7). (G) Percentage of TREM2-positive cells in CD34+ cells from healthy donors (n = 7) and patients with AML (n = 18). (H) Mean fluorescence intensity (MFI) of TREM2 in CD34+ cells from healthy donors (n = 7) and patients with AML (n = 18). (I) Serum levels of IL-34 from patients with AML (n = 52) and healthy controls (n = 10). (J) Microarray data analysis of samples from patients with AML samples showing a significant positive correlation between the expressions of TREM2 and IL-34.](https://ash.silverchair-cdn.com/ash/content_public/journal/blood/141/26/10.1182_blood.2022018619/2/m_blood_bld-2022-018619-gr7.jpeg?Expires=1770820006&Signature=PIRIJZds9Sj7G2TB3QJoWQD222i5HHGrGRAX25eb~L-KtA19h1tquTcEUm7IhlRk2uuulP3IulQoIRjnmHoqJzvOXyrgEO~MMSQ1A0DOmX6ZN5pyvCs0j3ZarIx147ww00ej6seBxxzsx4ZYYYEfcDymbcTjwn39I3fwd6wPE~u1vzo~rOAaK77yGn6yLR52xpdQLSFKyxEcagoglpqEoY2RCgx~BEkkPh1BHPU7myInZWeztVLGUZ~rKsl81n1idVyUXu8~0YJ4g2ZFTECDF1DCY7MtlPY2mpofYu4G7JYmo~KQZJWXA1gRf8SNMlKttdEVNNeF1yGmXG1lAHSi6w__&Key-Pair-Id=APKAIE5G5CRDK6RD3PGA)