Key Points
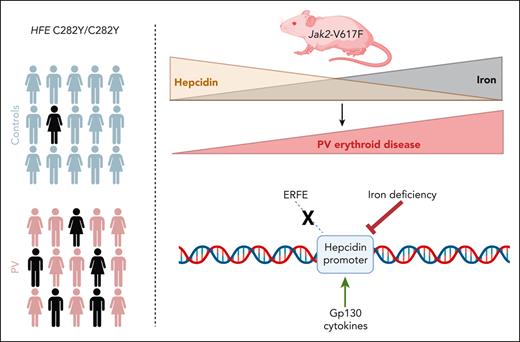
Homozygous HFE mutations are overrepresented in patients with PV.
Hepcidin levels govern severity of, and can be manipulated to modify, the erythroid phenotype in PV.
Abstract
Polycythemia vera (PV) is a myeloproliferative neoplasm driven by activating mutations in JAK2 that result in unrestrained erythrocyte production, increasing patients’ hematocrit and hemoglobin concentrations, placing them at risk of life-threatening thrombotic events. Our genome-wide association study of 440 PV cases and 403 351 controls using UK Biobank data showed that single nucleotide polymorphisms in HFE known to cause hemochromatosis are highly associated with PV diagnosis, linking iron regulation to PV. Analysis of the FinnGen dataset independently confirmed overrepresentation of homozygous HFE variants in patients with PV. HFE influences the expression of hepcidin, the master regulator of systemic iron homeostasis. Through genetic dissection of mouse models of PV, we show that the PV erythroid phenotype is directly linked to hepcidin expression: endogenous hepcidin upregulation alleviates erythroid disease whereas hepcidin ablation worsens it. Furthermore, we demonstrate that in PV, hepcidin is not regulated by expanded erythropoiesis but is likely governed by inflammatory cytokines signaling via GP130-coupled receptors. These findings have important implications for understanding the pathophysiology of PV and offer new therapeutic strategies for this disease.
Introduction
Polycythemia vera (PV) is a Philadelphia chromosome–negative myeloproliferative neoplasm (MPN) driven by activating mutations in JAK21-4 that cause unrestrained erythrocyte production, increasing patients’ hematocrit and hemoglobin concentrations. In PV, >95% of cases harbor the JAK2 V617F mutation, with the remainder of cases usually exhibiting a mutation in JAK2 exon 12.5,6 Complications of elevated hematocrit include venous and arterial thrombosis, and systemic symptoms including headache, visual disturbances, and pruritis.7 Therapy typically includes regular venesection to maintain hematocrit below 45%.6,8 This phase of the disease may continue for years before some patients develop fibrotic or leukemic transformation.
Iron availability for erythropoiesis (and other tissues) is governed by hepcidin, the master regulator of systemic iron homeostasis. Hepcidin is produced by the liver and occludes and internalizes the sole cellular iron exporter, ferroportin,9,10 preventing recycled iron in macrophages and dietary iron absorbed in the intestine from reaching the plasma and, hence, the bone marrow (BM).11 Elevated hepcidin thus reduces iron availability, whereas suppressed hepcidin enhances it.12 Systemic iron homeostasis is maintained via the transcriptional regulation of hepcidin, through which iron loading upregulates transcription via the canonical bone morphogenic protein (BMP)-Suppressor of Mothers against Decapentaplegic (SMAD) signaling pathway.13 Hepcidin transcription is suppressed by iron deficiency, partly via matriptase-2 (encoded by TMPRSS6) mediated downregulation of hemojuvelin, a coreceptor for BMP signaling. Increased erythropoiesis also suppresses hepcidin via the erythroid-secreted hormone erythroferrone (ERFE),14 which acts to inhibit BMP signaling.15 Hepcidin is also upregulated by inflammation16 (via interleukin-6 [IL-6]-driven JAK-STAT signaling17).
Systemic iron metabolism and PV may be closely intertwined.18 Most patients with PV present with iron deficiency at diagnosis.19 Overt iron deficiency may mask the elevated hemoglobin associated with PV.20 Venesection induces iron deficiency to limit further erythropoiesis. Recent reports have indicated that treatment of patients with PV with hepcidin analogues21 or pharmaceutical upregulation of hepcidin in preclinical models of PV22,23 may ameliorate disease phenotype. Given emerging interest in the manipulation of iron homeostasis in PV, comprehensive characterization of hepcidin regulation and its role in PV disease is imperative.
Here, we establish and validate an association between disordered systemic iron homeostasis and the risk of PV diagnosis through unbiased genome-wide association studies (GWASs) and evaluate the iron phenotype in a large cohort of patients with PV. We then show that hepcidin levels are critical for governing the severity of the erythroid phenotype using preclinical models of Jak2-V617F–driven PV. Furthermore, we demonstrate that in PV, hepcidin is not downregulated by erythroferrone. We also demonstrate an inflammatory phenotype in PV that may influence hepcidin through GP130-coupled receptors. These findings provide novel insights into understanding the pathophysiology of PV and have important implications for new therapeutic interventions.
Methods
Complete details are available in the supplemental Materials, available on the Blood website.
Ethics
Patient samples were collected in accordance with Walter and Eliza Hall Institute ethics 18/10LR or were derived from the Cambridge Blood and Stem Cell Biobank under ethics approval 18/EE/0199 (East of England, Cambridge East Research Ethics Committee). All participants provided written informed consent. The UK Biobank has approval from the UK North West Multi-centre Research Ethics Committee as a Research Tissue Bank (approval 21/NW/0157). Use of mice was in accordance with requirements set out by Walter and Eliza Hall Institute Animal Ethics Committee (approvals 2017.031 and 2020.034).
UK biobank GWAS
We undertook a GWAS of PV cases vs controls. Associations with single nucleotide polymorphisms (SNPs) and small indels were tested genome-wide, using regenie,24 per an additive genetic model. Associations included adjustment for sex, age, genotyping array, 10 ancestry principal components, and relatedness. GWAS results were filtered to include only variants with a minor allele frequency of ≥1.2%. For variants within the HFE locus, associations with PV were also tested assuming a recessive model, with covariate adjustment as described earlier. Associations at this locus and the 4 blood cell traits were tested separately in PV cases and controls, using regenie, as described earlier, under both the additive and recessive models.
FinnGen GWAS analysis
We used the FinnGen resource, data release 6.25,26 PV cases were identified as having a relevant International Classification of Diseases-8, -9, or -10 code in the hospital discharge register, cause of death register, or cancer register; controls were individuals without PV without a record of cancer. Genome-wide associations with PV were carried out with adjustment for sex, age, 10 ancestry principal components, and genotyping batch, assuming the use of an additive genetic model. The difference in the proportion of individuals with a homozygous AA genotype in PV cases vs controls was tested using the Fisher exact test.
Patient samples
We analyzed blood from patients with PV who fulfilled the World Health Organization criteria for PV at the time of diagnosis (n = 30) whose treatment either included a history of therapeutic venesection (n = 16) or not (n = 14); and from healthy controls (n = 30). Demographics are presented in supplemental Table 1.
Animals
Erythroferrone knockout (Erfe-KO)14,15,27 and inducible hepcidin knockout (iHamp-KO)28 mice have been described previously. Transgenic mice with a single copy Cre recombinase-dependent Jak2-V617F transgene located downstream of the Col1a1 locus (LSL-Jak2-V617F; CreERT2T/+) were generated (full methodology in supplemental Materials). Age- and sex-matched control animals were used in all experiments.
BM transplant model of PV
LSL-Jak2-V617F; CreERT2T/+ (PV) or LSL-Jak2-V617F lacking CreERT2 (control) BM cells were injected IV into lethally irradiated Ly5.1/J (B6.SJL-Ptprca Pepcb/BoyJ) recipient mice. Seven weeks after BM transplantation, mice were given tamoxifen (Sigma; 4.2 mg in 90% corn oil or 10% ethanol) via oral gavage on 2 consecutive days to induce expression of the mutant Jak2 allele. Complete details are given in supplemental Materials.
Administration of drugs, antibodies, and siRNA
TMPRSS6 small interfering RNA (siRNA; Silence Therapeutics GmbH, Berlin, Germany) comprised a double-stranded 19-mer RNA oligonucleotide targeting human TMPRSS6, linked to a GalNAc unit at the 5´ end of the sense strand enabling hepatic targeting.29 Nontargeting control (NTC) siRNA complimentary to luciferase RNA was used as the control. TMPRSS6 and NTC siRNA were diluted in sterile phosphate-buffered saline, and 5 mg/kg was administered via subcutaneous injection every 3 weeks for a total of 3 doses.
Antimouse IL-6 (clone MPF-20F3) or rat immunoglobulin G1κ control antibodies (both made in-house) were administered via intraperitoneal injection every 3 days for a total of 7 doses (500 μg per injection) or daily for 5 consecutive days (200 μg per injection).
Statistical analysis
Sample sizes and statistical tests for each experiment are denoted in the figure legends. Data represents mean ± standard deviation. Statistical testing was performed using Prism version 9.3.1 (GraphPad Software).
Results
GWAS links PV diagnosis with HFE variants
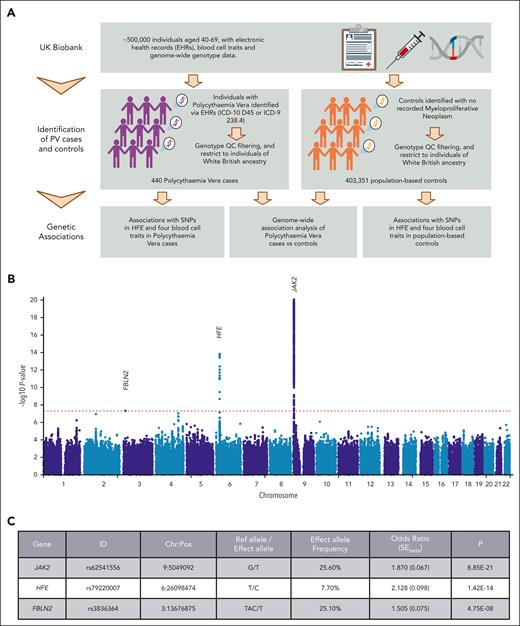
We undertook a GWAS of 440 PV cases and 403 351 controls in the UK Biobank (Figure 1A). We tested 9 191 064 variants genome wide (Figure 1B). Three genetic loci had SNPs with genome-wide significant (P < 5E-8) associations. Figure 1C details the top SNP at each locus. The most significant association was with rs62541556 (P = 8.85E-21), a germ line SNP in JAK2 that tags the 46/1 haplotype implicated in MPNs and is associated with increased susceptibility to V617F-mutant clonal hematopoiesis.30,31 The other genome-wide significant associations were with rs79220007 in HFE (P = 1.42E-14) and rs3836364 in FBLN2 (P = 4.75E-8).
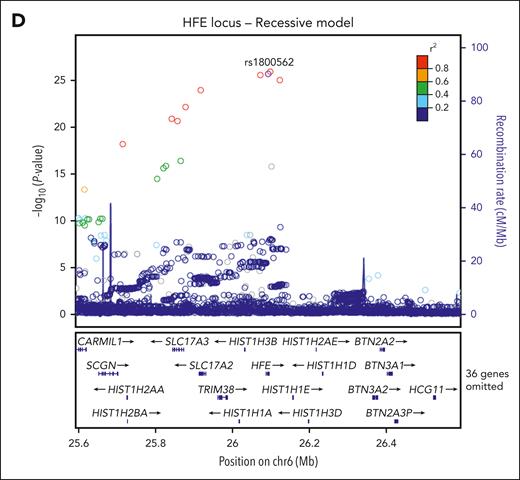
GWAS of PV. (A) Schematic of GWAS. Created with BioRender.com. (B) Manhattan plot showing results of GWAS of 440 PV cases vs 403 351 controls, assuming an additive genetic model. The red dashed line shows genome-wide significance level (P < 5E-8). Three loci with associations exceeding this threshold are labeled with the nearest gene. (C) Top SNP at each genetic loci that reached genome-wide significance. (D) LocusZoom plot of associations at the HFE locus, assuming a recessive genetic model. Rs1800562 (C282Y) highlighted, with the other SNPs colored per linkage disequilibrium (r2) to that SNP.
GWAS of PV. (A) Schematic of GWAS. Created with BioRender.com. (B) Manhattan plot showing results of GWAS of 440 PV cases vs 403 351 controls, assuming an additive genetic model. The red dashed line shows genome-wide significance level (P < 5E-8). Three loci with associations exceeding this threshold are labeled with the nearest gene. (C) Top SNP at each genetic loci that reached genome-wide significance. (D) LocusZoom plot of associations at the HFE locus, assuming a recessive genetic model. Rs1800562 (C282Y) highlighted, with the other SNPs colored per linkage disequilibrium (r2) to that SNP.
Interestingly, the top SNP in HFE, rs79220007, is in very high linkage disequilibrium (r2 = 1.0) with rs1800562, a SNP known to cause C282Y, the most common mutation causing HFE-related hemochromatosis, an autosomal recessive disorder producing iron overload.32,33 Among PV cases, there was an excess of individuals with the AA homozygous (C282Y) genotype, compared with the number that would be expected under Hardy-Weinberg equilibrium (2.7 expected vs 35 observed). Given the overrepresentation of AA genotypes in PV cases and the established role of homozygous C282Y variants in disease, we reexamined the HFE locus for associations with PV under a recessive model. The association with rs1800562 was more statistically significant under the recessive model than under the additive model (P = 2.63E-26 vs P = 2.91E-14; supplemental Table 2; Figure 1D), with the homozygous AA genotype associated with a 12.58-times increased odds of PV, compared with G/G or G/A genotypes. Commensurately, there was more than 10-fold increase in the number of individuals with a PV diagnosis for individuals homozygous for C282Y (AA) (n = 35, 1.35%, supplemental Table 3), compared with those with GA or GG genotypes (n = 69, 0.12%; and n = 336, 0.1%, respectively).
Next, we sought confirmation of the association of rs1800562 with PV through a look-up of rs1800562 in a GWAS of PV in the independent FinnGen study (394 PV cases vs 217 902 controls).25,26 Again, there was an overrepresentation of the AA genotype among PV cases (0.6 expected vs 4 observed). The crude odds ratio comparing the frequency of the AA homozygous genotype in PV cases vs controls in FinnGen was 5.19 (P = 8.29E-3; supplemental Table 4). The FinnGen GWAS assumed an additive genetic model and did not demonstrate an association between rs1800562 and PV (P = .68). However, the C282Y variant is less frequent in Finnish than in British populations (minor allele frequency of 3.7% vs 7.8%), therefore, there may have been limited power to capture the recessive association when an additive effect is assumed.
Using the UK Biobank, we then examined associations between rs1800562 and blood cell traits in PV cases and control individuals separately under both additive and recessive models. In line with a previous GWAS,34 in control individuals, the A allele of rs1800562 was highly associated with higher hemoglobin concentrations, hematocrits, and mean corpuscular volume but lower erythrocyte count (supplemental Table 5) compared with those with PV; this latter association was larger and more statistically significant under a recessive model (supplemental Table 5).
HFE regulates iron homeostasis by influencing transcription of hepcidin.35HFE knockout mice exhibit marked reductions in liver Hamp1 messenger RNA (mRNA) expression.36 The C282Y HFE variant dysregulates the iron-hepcidin axis, causing lower hepcidin concentrations relative to iron stores.37 We therefore sought to further investigate how iron homeostasis may affect PV disease.
Patients with PV exhibit iron deficiency with appropriate reductions in hepcidin expression
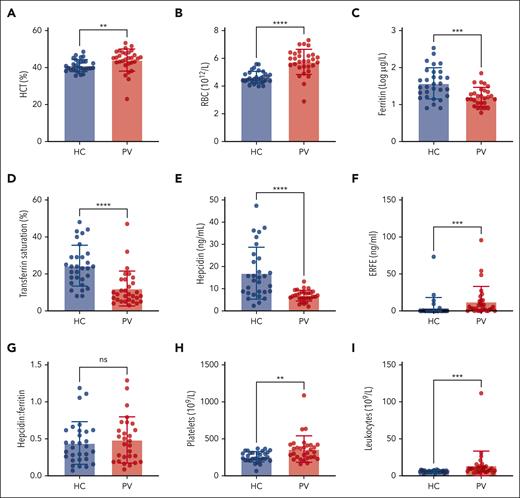
We compared hematology and iron markers in 30 patients with PV with 30 healthy controls (Figure 2). Patients with PV exhibited increased hematocrit and red cell count, and reduced ferritin (log ferritin: PV, 1.211 vs control, 1.572; P = .0002) and transferrin saturation (PV, 12.1% vs control, 24.43%; P < .0001); hepcidin levels were reduced (PV, 6.89 ng/mL vs control, 17.01 ng/mL; P < .0001), and erythroferrone levels increased (PV, 12.41 ng/mL vs control, 4.26 ng/mL; P = .0004). The ratio of hepcidin-to-ferritin was similar between groups (PV, 0.485 vs control, 0.443; P = .6048). As expected, patients with PV had elevated platelet and leukocyte counts. Interestingly, we did not observe significant differences between patients whose treatment included a history of therapeutic venesection and those whose did not (supplemental Figure 1).
Iron and erythroid parameters in patients with PV and healthy controls. HCT (A), red blood cells (RBCs) (B), ferritin (C), transferrin saturation (D), serum hepcidin (E), serum ERFE (F), hepcidin-to-ferritin ratio (G), platelet count (H), and leukocyte count (I) of healthy controls (HC; blue) and patients with PV (red) (PV and HC, n = 30 each). Mann-Whitney test for panels A,D-I or unpaired 2-tailed t test with Welch correction for panels B-C. ∗∗P < .01; ∗∗∗P < .001; ∗∗∗∗P < .0001. HCT, hematocrit; ns, nonsignificant.
Iron and erythroid parameters in patients with PV and healthy controls. HCT (A), red blood cells (RBCs) (B), ferritin (C), transferrin saturation (D), serum hepcidin (E), serum ERFE (F), hepcidin-to-ferritin ratio (G), platelet count (H), and leukocyte count (I) of healthy controls (HC; blue) and patients with PV (red) (PV and HC, n = 30 each). Mann-Whitney test for panels A,D-I or unpaired 2-tailed t test with Welch correction for panels B-C. ∗∗P < .01; ∗∗∗P < .001; ∗∗∗∗P < .0001. HCT, hematocrit; ns, nonsignificant.
Hepcidin regulation in a murine inducible knockin BM transplant model of PV
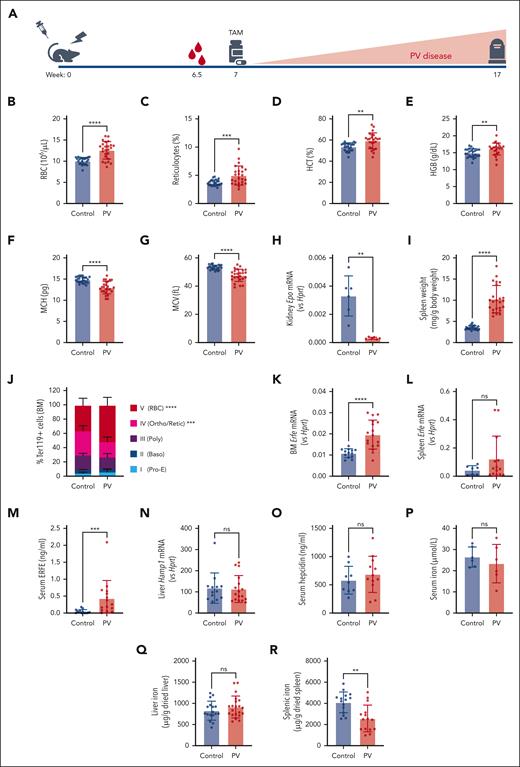
To define hepcidin regulation in PV, we developed a BM transplant model of PV (Figure 3A). Importantly, this model allows inducible mutant Jak2-V617F expression in the hematopoietic lineage while preserving wildtype JAK2-STAT signaling in hepatocytes. Reconstitution of the BM by donor cells was highly efficient (supplemental Figure 2). Ten weeks after tamoxifen induction, recipient mice that received transplantation with LSL-Jak2-V617F; CreERT2T/+ BM (hereafter, termed as mice with PV) exhibited a classic PV phenotype with elevated red cell count, reticulocytes, hematocrit and hemoglobin levels; decreased mean corpuscular hemoglobin (MCH) and mean cell volume (MCV); suppressed renal erythropoietin (Epo) expression; and splenomegaly (Figure 3B-I); the severity of the phenotype was not inconsistent with human disease. Unlike other murine models of PV,38,39 mice with PV did not have thrombocytosis and exhibited only an approximate twofold increase in leukocytes (supplemental Figure 3). Compared with controls, mice with PV had a skewed distribution of BM-resident erythropoietic progenitor cells, with increased levels of the most-mature (stage V) erythroid cells (Figure 3J; supplemental Figure 4). However, in the spleen, erythropoiesis was skewed toward increased intermediate progenitors and reduced stage V cells (supplemental Figure 4). In this PV model, despite increased erythropoiesis and higher Erfe mRNA in the BM (but not the spleen) and serum ERFE protein levels (Figure 3K-M), hepcidin mRNA (gene: Hamp1) and serum protein levels were not reduced (Figure 3N-O). Serum and liver iron concentrations were similar between mice with PV and controls (Figure 3P-Q), but spleen iron was reduced (Figure 3R).
Novel mouse model of PV. (A) Schematic of BM transplant PV mouse model. (B-G) RBCs (B), reticulocytes (C), HCT (D), HGB (E), MCH (F), and MCV (G); control, n = 24 control and PV, n = 25. (H) Kidney Epo mRNA expression relative to Hprt; n = 6. (I) Spleen weight normalized to total body weight; n = 24. (J) Terminal erythropoiesis in the BM determined by flow cytometry. Based on CD44 expression and FSC-A, Ter119+ cells were gated into 5 distinct populations: I, proerythroblast (Pro-E); II, basophilic erythroblasts (Baso); III, polychromatic erythroblasts (Poly); IV, orthochromatic erythroblasts and reticulocytes (Ortho/Retic); and V, RBCs. Control, n = 24 control and PV, n = 25. Erfe mRNA expression relative to Hprt in (K) the BM, n = 13 control; PV, n = 17, and (L) the spleen; control, n = 7; PV, n = 14. (M) Serum ERFE; control, n = 14; PV, n = 15. (N) Liver Hamp1 mRNA expression relative to Hprt; control, n = 13; PV, n = 17. (O) Serum hepcidin; control, n = 9 and PV, n = 12. (P) Serum iron; n = 6. (Q) Liver; control, n = 17 and PV, n = 21. (R) Spleen (n = 15) nonheme iron content. Mann-Whitney test for panels B,D,I,L,M,N, unpaired 2-tailed t test with Welch correction for panels C,E-H,K,O-R, or two-way analysis of variance (ANOVA) with Šídák correction for multiple comparisons for panel J. ∗∗P < .01; ∗∗∗P < .001; and ∗∗∗∗P<.0001.
Novel mouse model of PV. (A) Schematic of BM transplant PV mouse model. (B-G) RBCs (B), reticulocytes (C), HCT (D), HGB (E), MCH (F), and MCV (G); control, n = 24 control and PV, n = 25. (H) Kidney Epo mRNA expression relative to Hprt; n = 6. (I) Spleen weight normalized to total body weight; n = 24. (J) Terminal erythropoiesis in the BM determined by flow cytometry. Based on CD44 expression and FSC-A, Ter119+ cells were gated into 5 distinct populations: I, proerythroblast (Pro-E); II, basophilic erythroblasts (Baso); III, polychromatic erythroblasts (Poly); IV, orthochromatic erythroblasts and reticulocytes (Ortho/Retic); and V, RBCs. Control, n = 24 control and PV, n = 25. Erfe mRNA expression relative to Hprt in (K) the BM, n = 13 control; PV, n = 17, and (L) the spleen; control, n = 7; PV, n = 14. (M) Serum ERFE; control, n = 14; PV, n = 15. (N) Liver Hamp1 mRNA expression relative to Hprt; control, n = 13; PV, n = 17. (O) Serum hepcidin; control, n = 9 and PV, n = 12. (P) Serum iron; n = 6. (Q) Liver; control, n = 17 and PV, n = 21. (R) Spleen (n = 15) nonheme iron content. Mann-Whitney test for panels B,D,I,L,M,N, unpaired 2-tailed t test with Welch correction for panels C,E-H,K,O-R, or two-way analysis of variance (ANOVA) with Šídák correction for multiple comparisons for panel J. ∗∗P < .01; ∗∗∗P < .001; and ∗∗∗∗P<.0001.
ERFE does not regulate hepcidin expression in PV
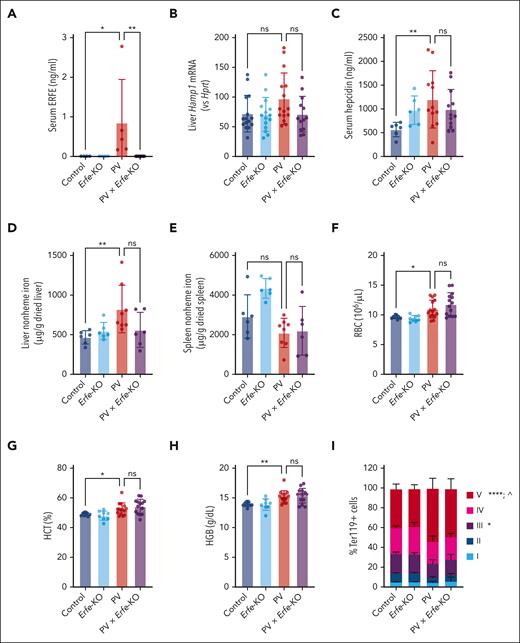
ERFE levels were modestly increased in our PV model (Figure 3M), a magnitude of increase not dissimilar to the clinical cohort (Figure 2F). To determine the effect of ERFE on hepcidin levels and disease severity in PV, we crossbred the LSL-Jak2-V617F; CreERT2T/+ mice with a previously generated Erfe-KO mouse15,27,40 (PV × Erfe-KO mice). The intercrossed mice were used as donors for BM transplants, allowing for Jak2-V617F expression along with Erfe deletion in hematopoietic cells of recipient mice. Although mice with PV have increased ERFE (Figure 3M), ERFE is undetectable in PV × Erfe-KO mice (Figure 4A); however, deletion of Erfe in mice with PV did not alter hepatic Hamp1 expression (Figure 4B) or hepcidin protein (Figure 4C) or alter systemic iron levels (Figure 4D-E), erythroid parameters (red cell count, hematocrit, or hemoglobin; Figure 4F-H), terminal erythropoiesis in the BM (Figure 4I), splenomegaly, or other nonerythroid hematologic lineages (supplemental Figure 5).
ERFE does not affect hepcidin in PV. (A) Serum ERFE; control, n = 4; Erfe-KO, n = 4; PV, n = 5; and PV × Erfe-KO, n = 11. (B) Liver Hamp1 mRNA expression relative to Hprt; control, n = 15; Erfe-KO, n = 15; PV, n = 15; and PV × Erfe-KO, n = 13. (C) Serum hepcidin; control, n = 4; Erfe-KO, n = 4; PV, n = 12; and PV × Erfe-KO, n = 12. (D) Liver and (E) spleen nonheme iron content; control, n = 6; Erfe-KO, n = 6; PV × Erfe-KO, n = 6; and PV, n = 8. (F-H) RBCs (F), HCT (G), and HGB (H); control, n = 9; Erfe-KO, n = 8; PV, n = 15; and PV × Erfe-KO, n = 14. (I) Terminal erythropoiesis in the BM determined by flow cytometry. Based on CD44 expression and FSC-A, Ter119+ cells were gated into 5 distinct populations: I, proerythroblast (Pro-E); II, basophilic erythroblasts (Baso); III, polychromatic erythroblasts (Poly); IV, orthochromatic erythroblasts and reticulocytes (Ortho/Retic); and V, RBCs; control, n = 9; Erfe-KO, n = 8; PV, n = 13; and PV × Erfe-KO, n = 12. One-way ANOVA for panels A,C,E-H, Kruskal-Wallis test for panels B,D, or two-way ANOVA with Dunnett correction for multiple comparisons for panel I. ∗P < .05; ∗∗P < .01; In panel I, “∗” represents control vs PV, and “^” represents PV vs PV × Erfe-KO.
ERFE does not affect hepcidin in PV. (A) Serum ERFE; control, n = 4; Erfe-KO, n = 4; PV, n = 5; and PV × Erfe-KO, n = 11. (B) Liver Hamp1 mRNA expression relative to Hprt; control, n = 15; Erfe-KO, n = 15; PV, n = 15; and PV × Erfe-KO, n = 13. (C) Serum hepcidin; control, n = 4; Erfe-KO, n = 4; PV, n = 12; and PV × Erfe-KO, n = 12. (D) Liver and (E) spleen nonheme iron content; control, n = 6; Erfe-KO, n = 6; PV × Erfe-KO, n = 6; and PV, n = 8. (F-H) RBCs (F), HCT (G), and HGB (H); control, n = 9; Erfe-KO, n = 8; PV, n = 15; and PV × Erfe-KO, n = 14. (I) Terminal erythropoiesis in the BM determined by flow cytometry. Based on CD44 expression and FSC-A, Ter119+ cells were gated into 5 distinct populations: I, proerythroblast (Pro-E); II, basophilic erythroblasts (Baso); III, polychromatic erythroblasts (Poly); IV, orthochromatic erythroblasts and reticulocytes (Ortho/Retic); and V, RBCs; control, n = 9; Erfe-KO, n = 8; PV, n = 13; and PV × Erfe-KO, n = 12. One-way ANOVA for panels A,C,E-H, Kruskal-Wallis test for panels B,D, or two-way ANOVA with Dunnett correction for multiple comparisons for panel I. ∗P < .05; ∗∗P < .01; In panel I, “∗” represents control vs PV, and “^” represents PV vs PV × Erfe-KO.
Hepcidin determines PV erythroid disease severity
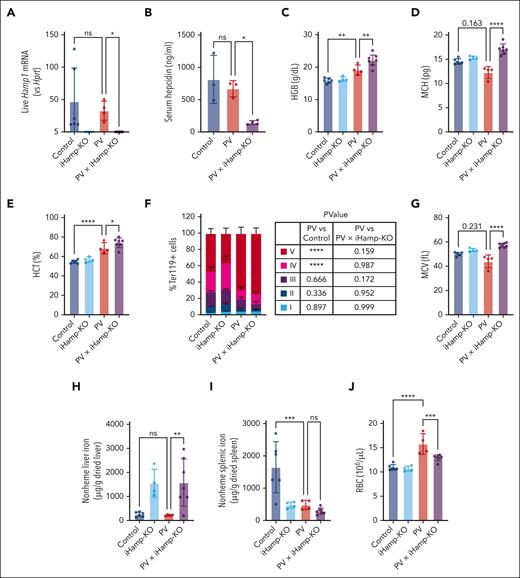
We hypothesized that hepcidin regulates erythroid disease in PV. To test this hypothesis, we first deleted hepcidin in mice with PV using a previously generated iHamp-KO mouse model.28 Because mutant Jak2-V617F expression in hepatocytes was not a concern in mice unable to express hepcidin, we crossbred LSL-Jak2-V617F; CreERT2T/+ mice with iHamp-KO mice, creating mice with simultaneously inducible systemic mutant Jak2-V617F expression and hepcidin deletion (PV × iHamp-KO). As expected, PV × iHamp-KO mice showed no hepatic Hamp1 expression (Figure 5A) and greatly reduced serum hepcidin protein (Figure 5B). Deletion of hepcidin in mice with PV worsened the erythroid phenotype in PV × iHamp-KO animals, compared with mice with PV that express hepcidin (PV animals), having increased the hemoglobin concentration (19.20 vs 22.70 g/dL; P = .0021; Figure 5C), MCH (12.28 vs 17.07 pg; P < .0001; Figure 5D), and hematocrit (68.70% vs 75.85%; P = .0065; Figure 5E) but did not affect non-erythroid lineages (supplemental Figure 6). Interestingly, hepcidin deletion did not significantly alter the distribution of erythropoietic cells in the BM (Figure 5F). However, the worsened erythroid phenotype may reflect increased iron availability for red cell production as evidenced by increased MCV (43.98 vs 57.62 fL; P = .0012; Figure 5G) and increased liver iron (Figure 5H) but did not change the spleen iron content (Figure 5I). PV × iHamp-KO mice had lower red cell counts than the hepcidin-expressing controls (15.78 × 10⁶/μL vs 13.16 × 10⁶/μL; P = .0052; Figure 5J), which, interestingly, recapitulates blood cell traits among controls with the HFE rs1800562 A allele (supplemental Table 5). Hepcidin deletion did not affect splenomegaly of mice with PV (supplemental Figure 6).
Hepcidin deletion worsens PV erythroid disease severity. (A) Liver Hamp1 mRNA expression relative to Hprt. (B) Serum hepcidin. (C-E) HGB (C), MCH (D), and HCT (E). (F) Terminal erythropoiesis in the BM determined by flow cytometry. Based on CD44 expression and FSC-A, Ter119+ cells were gated into 5 distinct populations: I , proerythroblasts; II, basophilic erythroblasts; III, polychromatic erythroblasts; IV, orthochromatic erythroblasts and reticulocytes; and V, RBCs. (G) MCV. (H) Liver and (I) spleen nonheme liver iron. (J) RBCs. Control, n = 6; iHamp-KO, n = 4; PV, n = 4; and PV × iHamp-KO, n = 7, except for panel B in which control, n = 3; PV, n = 3; and PV × iHamp-KO, n = 4. Kruskal-Wallis test for panels A,D,G, ordinary one-way ANOVA for panels B-C,E,H-J, or two-way ANOVA with Dunnett correction for multiple comparisons for panel F. ∗P < .05; ∗∗P < .01; ∗∗∗P < .001; ∗∗∗∗P < .0001.
Hepcidin deletion worsens PV erythroid disease severity. (A) Liver Hamp1 mRNA expression relative to Hprt. (B) Serum hepcidin. (C-E) HGB (C), MCH (D), and HCT (E). (F) Terminal erythropoiesis in the BM determined by flow cytometry. Based on CD44 expression and FSC-A, Ter119+ cells were gated into 5 distinct populations: I , proerythroblasts; II, basophilic erythroblasts; III, polychromatic erythroblasts; IV, orthochromatic erythroblasts and reticulocytes; and V, RBCs. (G) MCV. (H) Liver and (I) spleen nonheme liver iron. (J) RBCs. Control, n = 6; iHamp-KO, n = 4; PV, n = 4; and PV × iHamp-KO, n = 7, except for panel B in which control, n = 3; PV, n = 3; and PV × iHamp-KO, n = 4. Kruskal-Wallis test for panels A,D,G, ordinary one-way ANOVA for panels B-C,E,H-J, or two-way ANOVA with Dunnett correction for multiple comparisons for panel F. ∗P < .05; ∗∗P < .01; ∗∗∗P < .001; ∗∗∗∗P < .0001.
TMPRSS6 inhibition increases endogenous hepcidin and improves PV disease
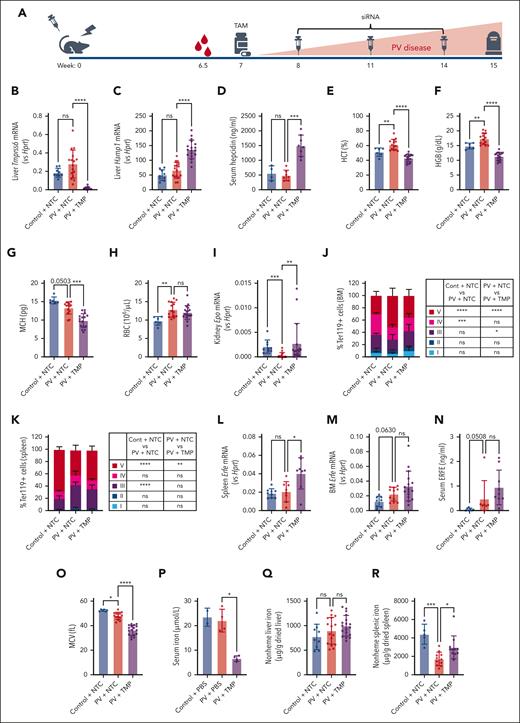
Because hepcidin ablation worsened the PV erythroid phenotype, we hypothesized that increasing hepcidin levels would impair erythroid iron availability and reduce erythroid disease. Mice were injected with TMPRSS6 siRNA (which has been shown to cause sustained knockdown of murine Tmprss629) or NTC siRNA every 3 weeks for a total of 3 injections starting 1 week after tamoxifen induction of the mutant Jak2-V617F (Figure 6A), at which time mice with PV had a MPN phenotype (supplemental Figure 7). TMPRSS6 siRNA treatment resulted in efficient knockdown of hepatic Tmprss6 (Figure 6B). In mice with PV, compared with NTC siRNA treatment, TMPRSS6 siRNA increased hepatic Hamp1 2.07-fold (Figure 6C) and hepcidin protein 3.10-fold (Figure 6D).
TMPRSS6 inhibition increases endogenous hepcidin and improves PV disease severity. (A) Schematic of experimental design. (B-C) Liver Tmprss6 (B) and Hamp1 (C) mRNA expression relative to Hprt; control + NTC, n = 9; PV + NTC, n = 16; PV + TMP, n = 18. (D) Serum hepcidin; control + NTC, n = 4; PV + NTC, n = 7; PV + TMP, n = 8. (E-H) HCT (E), HGB (F), MCH (G), and RBCs (H); control + NTC, n = 6; PV + NTC, n = 14; PV + TMP, n = 17. (I) Kidney Epo mRNA expression relative to Hprt; control + NTC, n = 9; PV + NTC, n = 16; PV + TMP, n = 17. (J-K) Terminal erythropoiesis in the BM (J) and the spleen (K) determined by flow cytometry. Based on CD44 expression and FSC-A, Ter119+ cells were gated into 5 distinct populations: I, proerythroblasts; II, basophilic erythroblasts; III, polychromatic erythroblasts; IV, orthochromatic erythroblasts and reticulocytes; and V, RBCs; BM: control + NTC, n = 7; PV + NTC, n = 13; and PV + TMP, n = 19; and spleen: control + NTC, n = 7; PV + NTC, n = 5; and PV + TMP, n = 7. (L-M) Spleen (L) and BM (M) Erfe mRNA expression relative to Hprt; spleen: control + NTC, n = 9; PV + NTC, n = 8; and PV + TMP, n = 8; BM: control + NTC, n = 8; PV + NTC, n = 11; PV + TMP, n = 16. (N) Serum ERFE; control + NTC, n = 7; PV + NTC, n = 7; and PV + TMP, n = 8. (O) MCV; control + NTC, n = 6; PV + NTC, n = 14; and PV + TMP, n = 17. (P) Serum iron; control group, n = 2; PV groups, n = 4. (Q-R) Liver (Q) and spleen (R) nonheme iron content; liver: control + NTC, n = 9; PV + NTC, n = 16; PV + TMP, n = 18; spleen: control + NTC, n = 5 and PV groups, n = 11. Kruskal-Wallis test for panels B,D,G,I,L-N,P,R, ordinary one-way ANOVA for panels C,E-F,H,O,Q, or two-way ANOVA with Tukey correction for multiple comparisons for panels J-K. ∗P < .05; ∗∗P < .01; ∗∗∗P < .001; ∗∗∗∗P < .0001. NTC, nontargeting control siRNA; TMP, TMPRSS6 siRNA.
TMPRSS6 inhibition increases endogenous hepcidin and improves PV disease severity. (A) Schematic of experimental design. (B-C) Liver Tmprss6 (B) and Hamp1 (C) mRNA expression relative to Hprt; control + NTC, n = 9; PV + NTC, n = 16; PV + TMP, n = 18. (D) Serum hepcidin; control + NTC, n = 4; PV + NTC, n = 7; PV + TMP, n = 8. (E-H) HCT (E), HGB (F), MCH (G), and RBCs (H); control + NTC, n = 6; PV + NTC, n = 14; PV + TMP, n = 17. (I) Kidney Epo mRNA expression relative to Hprt; control + NTC, n = 9; PV + NTC, n = 16; PV + TMP, n = 17. (J-K) Terminal erythropoiesis in the BM (J) and the spleen (K) determined by flow cytometry. Based on CD44 expression and FSC-A, Ter119+ cells were gated into 5 distinct populations: I, proerythroblasts; II, basophilic erythroblasts; III, polychromatic erythroblasts; IV, orthochromatic erythroblasts and reticulocytes; and V, RBCs; BM: control + NTC, n = 7; PV + NTC, n = 13; and PV + TMP, n = 19; and spleen: control + NTC, n = 7; PV + NTC, n = 5; and PV + TMP, n = 7. (L-M) Spleen (L) and BM (M) Erfe mRNA expression relative to Hprt; spleen: control + NTC, n = 9; PV + NTC, n = 8; and PV + TMP, n = 8; BM: control + NTC, n = 8; PV + NTC, n = 11; PV + TMP, n = 16. (N) Serum ERFE; control + NTC, n = 7; PV + NTC, n = 7; and PV + TMP, n = 8. (O) MCV; control + NTC, n = 6; PV + NTC, n = 14; and PV + TMP, n = 17. (P) Serum iron; control group, n = 2; PV groups, n = 4. (Q-R) Liver (Q) and spleen (R) nonheme iron content; liver: control + NTC, n = 9; PV + NTC, n = 16; PV + TMP, n = 18; spleen: control + NTC, n = 5 and PV groups, n = 11. Kruskal-Wallis test for panels B,D,G,I,L-N,P,R, ordinary one-way ANOVA for panels C,E-F,H,O,Q, or two-way ANOVA with Tukey correction for multiple comparisons for panels J-K. ∗P < .05; ∗∗P < .01; ∗∗∗P < .001; ∗∗∗∗P < .0001. NTC, nontargeting control siRNA; TMP, TMPRSS6 siRNA.
Hepcidin upregulation by TMPRSS6 siRNA significantly reduced the hematocrit (61.24% vs 43.24%; P < .0001; Figure 6E), hemoglobin (17.34 vs 11.35 g/dL; P < .0001; Figure 6F), and MCH (13.29 vs 9.84 pg; P = .0010; Figure 6G) levels in mice with PV but did not reduce red blood cells (12.83 × 10⁶/μL vs 11.81 × 10⁶/μL; P = .1458; Figure 6H) and had no effect on non-erythroid lineages (supplemental Figure 8). TMPRSS6 siRNA treatment corrected renal Epo suppression (Figure 6I) and the distribution of BM (but not splenic) resident erythropoietic progenitor cells in mice with PV (Figure 6J-K) but had no effect on splenomegaly (supplemental Figure 8). TMPRSS6 siRNA treatment elevated Erfe mRNA expression in the spleen of mice with PV but had no effect on Erfe mRNA in the BM or ERFE protein levels in the serum (Figure 6L-N). MCV was reduced in mice with PV treated with TMPRSS6 siRNA (Figure 6O), indicative of iron-restricted erythropoiesis. TMPRSS6 siRNA significantly reduced serum iron in mice with PV (Figure 6P) but did not reduce nonheme liver iron (Figure 6Q) and the treatment raised nonheme splenic iron levels (Figure 6R).
Inflammatory cytokines may upregulate hepcidin in PV
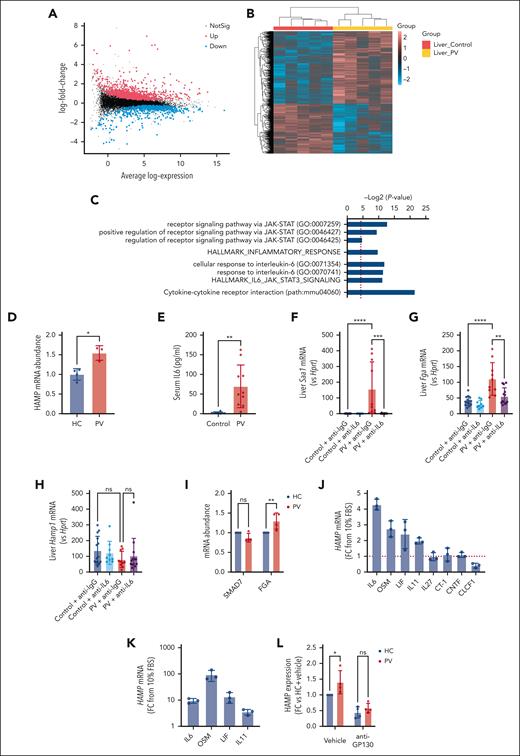
Inflammatory cytokines (including IL-6) are elevated in PV.41,42 Hepcidin transcription is directly regulated via inflammation, via IL-6–mediated JAK-STAT signaling.17 Thus, we examined whether JAK-STAT signaling was increased in the hepatocytes of mice with PV. RNA-sequencing analysis of livers from animal with PV that received BM transplantation and control animals revealed 1466 differentially expressed genes (DEGs) (598 downregulated; 868 upregulated) (Figure 7A; supplemental Table 6) in mice with PV compared with controls. The transcriptional profile of livers from mice with PV was different from controls (Figure 7B). Gene Ontology pathway analysis of DEGs revealed the upregulation of biological processes related to JAK-STAT signaling in mice with PV compared with control animals (Figure 7C, top 3 bars). Consistent with this analysis, gene set enrichment analysis using the MSigDB hallmark gene sets revealed upregulation of the inflammatory response pathway in the liver of mice with PV (Figure 7C, fourth bar).
Inflammatory cytokines may upregulate hepcidin in PV. (A) Mean-difference plot showing the average log expression of each gene (x-axis) and their log-fold change between PV and control liver samples (y-axis). The DEGs are highlighted with points in red and blue indicating upregulated and downregulated genes, respectively (adjusted P value <.05). (B) Heatmap of the expression of all DEGs with hierarchical clustering in which expression values are standardized to have mean of 0 and standard deviation of 1 for each gene. (C) Bar chart depicting GO biological processes, MSigDB hallmark gene sets, or KEGG pathways relating to JAK-STAT signaling, inflammatory response, IL-6 responses, or cytokine-cytokine receptor interactions that are associated with upregulated genes in PV liver samples vs control. x-axis represents statistical significance of the enrichment, increasing from left to right. The red dotted line represents P = .05. (D) HAMP mRNA expression of HepG2 cells cultured in media supplemented with 2% plasma from HC donors or patients with PV; HC, n = 4; PV, n = 3. (E) Mouse serum IL-6; control, n = 8; PV, n = 10. (F-H) Liver Saa1 (F), Fga (G), and Hamp1 (H) relative to Hprt; control + anti–immunoglobulin G (IgG), n = 14; control + anti–IL-6, n = 9; PV + anti-IgG, n = 10; and PV + anti–IL-6, n = 13. (I) SMAD7 and FGA mRNA expression of HepG2 cells cultured in media supplemented with 2% plasma from HC donors or patients with PV; n = 4. (J-K) HAMP mRNA expression of HepG2 (J) or Huh7 (K) cells cultured in media supplemented with 10 ng/mL recombinant human IL-6–family cytokines; n = 3. The red line in panel J indicates HAMP expression in the absence of additional cytokines. (L) HAMP mRNA expression of HepG2 cells cultured in media supplemented with 2% plasma from HC donors or patients with PV with the addition of anti-GP130 antibodies or vehicle control (phosphate-buffered saline); n = 4. Unpaired 2-tailed t test with Welch correction for panels D-E, Kruskal-Wallis test for panels F-H, or two-way ANOVA with Šídák correction for multiple comparisons for panels I,L. ∗P < .05; ∗∗P < .01; ∗∗∗P < .001; ∗∗∗∗P < .0001. GO, gene ontology; OSM, oncostatin M; LIF, leukemia inhibitory factor; CT-1, cardiotrophin 1; CNTF, ciliary neurotrophic factor; CLCF1, cardiotrophin-like cytokine factor.
Inflammatory cytokines may upregulate hepcidin in PV. (A) Mean-difference plot showing the average log expression of each gene (x-axis) and their log-fold change between PV and control liver samples (y-axis). The DEGs are highlighted with points in red and blue indicating upregulated and downregulated genes, respectively (adjusted P value <.05). (B) Heatmap of the expression of all DEGs with hierarchical clustering in which expression values are standardized to have mean of 0 and standard deviation of 1 for each gene. (C) Bar chart depicting GO biological processes, MSigDB hallmark gene sets, or KEGG pathways relating to JAK-STAT signaling, inflammatory response, IL-6 responses, or cytokine-cytokine receptor interactions that are associated with upregulated genes in PV liver samples vs control. x-axis represents statistical significance of the enrichment, increasing from left to right. The red dotted line represents P = .05. (D) HAMP mRNA expression of HepG2 cells cultured in media supplemented with 2% plasma from HC donors or patients with PV; HC, n = 4; PV, n = 3. (E) Mouse serum IL-6; control, n = 8; PV, n = 10. (F-H) Liver Saa1 (F), Fga (G), and Hamp1 (H) relative to Hprt; control + anti–immunoglobulin G (IgG), n = 14; control + anti–IL-6, n = 9; PV + anti-IgG, n = 10; and PV + anti–IL-6, n = 13. (I) SMAD7 and FGA mRNA expression of HepG2 cells cultured in media supplemented with 2% plasma from HC donors or patients with PV; n = 4. (J-K) HAMP mRNA expression of HepG2 (J) or Huh7 (K) cells cultured in media supplemented with 10 ng/mL recombinant human IL-6–family cytokines; n = 3. The red line in panel J indicates HAMP expression in the absence of additional cytokines. (L) HAMP mRNA expression of HepG2 cells cultured in media supplemented with 2% plasma from HC donors or patients with PV with the addition of anti-GP130 antibodies or vehicle control (phosphate-buffered saline); n = 4. Unpaired 2-tailed t test with Welch correction for panels D-E, Kruskal-Wallis test for panels F-H, or two-way ANOVA with Šídák correction for multiple comparisons for panels I,L. ∗P < .05; ∗∗P < .01; ∗∗∗P < .001; ∗∗∗∗P < .0001. GO, gene ontology; OSM, oncostatin M; LIF, leukemia inhibitory factor; CT-1, cardiotrophin 1; CNTF, ciliary neurotrophic factor; CLCF1, cardiotrophin-like cytokine factor.
Thus, using a human in vitro hepatocyte model, we explored the hypothesis that soluble factors (including cytokines) may upregulate hepcidin in patients with PV. Liver-derived HepG2 cells grown in media supplemented with plasma from patients with PV exhibited increased hepcidin (HAMP) mRNA expression compared with cells grown in media supplemented with healthy donor plasma (Figure 7D), indicating that patients with PV produce soluble factors that upregulate hepcidin. We reasoned that IL-6 may be driving this upregulation because mice with PV exhibited increased serum IL-6 (Figure 7E). In addition, RNA-sequencing Gene Ontology pathway analysis as well as gene set enrichment analysis using the MSigDB hallmark gene sets revealed increased IL-6–driven responses in the livers of mice with PV (Figure 7C, fifth to seventh bars). To determine whether IL-6 alone is responsible for hepcidin upregulation in PV, mice that received BM transplantation were treated with anti–IL-6 or control (anti–immunoglobulin G) antibodies. Mice treated with anti–IL-6 antibodies every 3 days for 3 weeks showed normalization of IL6-JAK-STAT (eg, Saa1) transcripts and reduced expression of hepatic JAK-STAT transcripts (eg, Fga) (Figure 7F-G), confirming neutralization of IL-6 signaling. However, IL-6 neutralization did not alter hepcidin expression (Figure 7H). These results were replicated in mice treated with anti–IL-6 daily for 1 week (supplemental Figure 9). In keeping with unaltered hepcidin expression, anti–IL-6 treatment had a minimal effect on erythropoiesis or iron distribution in mice with PV (supplemental Figure 10).
We therefore hypothesized that other cytokines may upregulate hepcidin in PV. In keeping with this, Kyoto Encylopedia of Genes and Genomes (KEGG) pathway analysis of DEGs revealed upregulation of genes involved in cytokine-cytokine receptor interaction in the liver of mice with PV compared with controls (Figure 7C, bottom bar). HepG2 cells cultured in media supplemented with plasma from patients with PV exhibited increased JAK-STAT target gene expression (FGA) but no change in BMP-SMAD target gene expression (SMAD7) when compared with cells cultured in media supplemented with plasma from healthy donors (Figure 7I). Notably, levels of other IL-6–family cytokines (IL11,43,44 oncostatin M [OSM]45) are known to be elevated in PV. Thus, we screened other IL-6–family cytokines for a role in hepcidin regulation because these cytokines induce JAK-STAT signaling via a common GP130 receptor subunit (except IL-31). Addition of individual IL-6–family cytokines to HepG2 cells revealed that in addition to IL-6, IL-11, OSM, and leukemia inhibitory factor (LIF) increase HAMP mRNA levels; whereas IL-27, cardiotrophin 1 (CT-1), and ciliary neurotrophic factor (CNTF) have no effect, and cardiotrophin-like cytokine factor 1 (CLCF1) decreases hepcidin expression (Figure 7J). The increase in hepcidin expression by IL-11, OSM, and LIF (as well as IL-6) was confirmed in a second hepatocyte cell line, Huh7 (Figure 7K). We then determined whether inhibition of GP130 could normalize hepcidin expression in HepG2 cells treated with PV plasma. HepG2 cells grown in media supplemented with PV plasma and anti-GP130 antibodies no longer exhibited increased HAMP expression, rather HAMP expression decreased, reaching levels indistinguishable from that of cells cultured in media supplemented with control plasma and anti-GP130 antibodies (Figure 7L).
Discussion
Here, we provide population genetic and experimental evidence that diagnosis and clinical features of PV are influenced by systemic iron homeostasis. This work establishes a central role for iron homeostasis in influencing the erythroid phenotype in PV and provides a rationale for the use of therapies that modify iron metabolism to treat this disease.
Our GWAS implicates the HFE locus as a key region associated with PV diagnosis, formally linking systemic iron regulation and PV. The top SNP in HFE associated with PV is in very high linkage disequilibrium with the pathogenic HFE C282Y variant (which causes hemochromatosis). Interestingly, this disease-causing SNP is not associated with diagnosis of other MPNs (essential thrombocythemia and primary myelofibrosis; supplemental Table 7), indicating that iron metabolism is linked to PV exclusively. Provision of iron to PV may worsen hematocrit.46 Conversely, as we show, iron deficiency is common among patients with PV19 and may conceal diagnosis.47 Previous small studies have examined the prevalence and effects of HFE C282Y variants in PV and have not observed associations.48,49 However, here, the use of large data sets enabled an unbiased approach to discover and validate the role of HFE in PV diagnosis. Cases of PV were defined per the International Classification of Diseases system and subject to contemporaneous criteria at the time of disease diagnosis.
HFE is an upstream regulator of hepcidin, perhaps via stabilization of BMP-type I receptors (ALK3) to facilitate BMP signaling.50,51 C282Y variants prevent HFE from reaching the cell surface, limiting its function, reducing hepcidin expression, and causing excess iron absorption.37,52HFE variants may thus enhance iron availability for erythropoiesis, increasing the likelihood of presentation and diagnosis of PV.
Given the established role of HFE in hepcidin regulation, we reasoned that the ultimate mechanism for the genetic association with disease phenotype was via changes in hepcidin, and, hence, we dissected the role of hepcidin in PV using preclinical models. Genetic deletion of hepcidin in our PV model increased erythroid parameters, indicating that in PV, unrestricted erythroid iron access results in unfettered increased hematocrit and hemoglobin production. Conversely, physiologic upregulation of hepcidin expression through RNA interference of Tmprss6 induced reductions in serum iron, depriving the BM of iron and causing reduced hematocrit and hemoglobin concentrations. Hepcidin is thus critical in determining the erythroid phenotype in PV.
The dependence of the PV erythroid phenotype on systemic iron homeostasis provides the mechanistic rationale for the suite of emerging treatments that target iron metabolism for PV. The mainstay of current treatment for PV is venesection to decrease hematocrit below 45%, at which point serious thrombotic events become less likely.8,53 Venesection lowers the hematocrit by removing red blood cells and inducing systemic iron deficiency,18 thus ameliorating further erythrocyte production.53 However, venesection can cause unwanted adverse effects including vasovagal reactions due to fluid shifts,54 as well as symptoms such as chronic fatigue due to systemic iron deficiency,55 and incurs direct and indirect health care costs associated with patient visits. Some patients are unable to tolerate venesection because of the severity of adverse events, or do not achieve satisfactory hematocrit responses and, hence, require second-line nontargeted agents. New therapeutic options for PV are thus needed. Withholding iron from the BM by inhibiting iron export to the plasma offers an exciting therapeutic opportunity to replace therapeutic venesection to treat PV.56 We demonstrated that upregulation of endogenous hepcidin levels through liver-specific TMPRSS6 siRNA deprives the serum of iron and reduces hematocrit and hemoglobin concentrations in our PV model. A similar approach using antisense oligonucleotide therapies has likewise recently shown promising preclinical results.22 A phase 2 clinical trial showed that a hepcidin mimetic can obviate the need for venesection in patients with PV previously dependent on venesection.21 A clinical candidate of the TMPRSS6 siRNA used here (SLN124) is entering phase 1 and 2 clinical trials (NCT05499013) in patients with PV. Our data indicate that liver iron stores were not altered by TMPRSS6 siRNA treatment but splenic iron stores increased, consistent with this therapy redistributing iron stores rather than inducing systemic iron depletion, a feature that could protect patients from symptomatic iron deficiency. TMPRSS6 siRNA treatment is unlikely to result in vasovagal responses. Because hepcidin mimetics and TMPRSS6 siRNA therapies can be administered by subcutaneous injection, these therapies could potentially be self-administered, reducing health care costs.
In our clinical study, we found that patients exhibit low iron stores with concordant reductions in hepcidin that are not likely influenced by small increases in ERFE. Iron depletion and low iron stores have been observed in some previous studies18,57 although others have reported hepcidin levels similar to healthy controls.58,59 Although we detected elevated ERFE in our PV model and patients with PV, Erfe deletion did not modify hepcidin expression or alter disease phenotype. These findings may reflect the smaller degree of ERFE elevation in PV compared with diseases of ineffective erythropoiesis such as thalassemia.40 In keeping with this, we found that hepcidin-to-ferritin ratios are not reduced in patients with PV, unlike in thalassemia in which ratios are lower.60 Elevations of ERFE in our PV model were comparable with elevations detected in experimental mice with low-level ERFE overexpression, which do not alter hepcidin expression and produce only modest elevations in serum and liver iron.61
Numerous inflammatory cytokines (including IL-6) are elevated in patients with PV, some of which may portend inferior prognosis.42,44,62 We found preliminary evidence to suggest that IL-6–family cytokines (beyond IL-6 itself), which signal via GP130-coupled receptors,63 may be implicated in hepcidin regulation in PV. Consistent with our data, previous studies have indicated that anti–IL-6 treatment of mice with PV does not alter hematologic phenotype.64 Further characterization of the role of these cytokine(s) in hepcidin regulation in PV will be an important continuation of this work.
Characterization of the functional role of hepcidin and erythroferrone in PV was undertaken in a novel knockin inducible Jak2-V617F transplant model, with induction of the phenotype by tamoxifen delayed to ensure recovery of the mouse from the toxicity of the transplant procedure, which could itself induce inflammation and perturb hepcidin.65 The hematologic and splenic phenotype of this model, and the degree of upregulation of erythroferrone, was consistent with human PV disease although less severe than previous knockin models of Jak2-V617F PV, which have exhibited a stronger phenotype, with higher hemoglobin and hematocrit levels and greater degrees of splenomegaly22,39,66,67; these models may exhibit more marked elevations in erythroferrone, and deletion of erythroferrone in these models may induce a change in hepcidin levels and changes in systemic iron physiology. Evaluation of the role of erythroferrone in alternative models of PV remains an ongoing research need.
In summary, our findings implicate systemic iron regulation as a key determinant of the clinical severity of PV and lay the foundation for strategies that modify iron regulation as potential therapeutics for this disease.
Acknowledgments
The authors thank the Walter and Eliza Hall Institute (WEHI) Bioservices facility for husbandry of all animals and assistance with animal experiments, Stephen Wilcox for assistance with sequencing of RNA indexed libraries, and the WEHI Business Development Office and Legal and Licensing Office for support with Material Transfer Agreements. The authors thank Hal Drakesmith and Andrew Armitage for sharing iHamp and Erfe knockout mice. The authors thank all the participants who provided samples for this study, and Kelli Grey, Naomi Sprigg, and Fiona Sultana for collecting patient samples. The authors thank their patient consumers with PV, Nathalie Cook, and Anna Steiner for their input and feedback on this work. The authors acknowledge the participants and investigators of the FinnGen study.
This work was supported by the National Health and Medical Research Council (GNT1158696, GNT1159171, GNT1195236, GNT2009047, GNT1058344 and GNT1113577). Work in the ARG laboratory was supported by grants from CRUK, Wellcome, the WBH Foundation, and the Alborada Trust. This research has been conducted using the UK Biobank Resource under Application Number 36610. This work was also made possible through the Victorian State Government Operational Infrastructure Support and Australian Government National Health and Medical Research Council Independent Research Institute Infrastructure Support Scheme.
The contents of this published material are solely the responsibility of the individual authors and do not reflect the views of the National Health and Medical Research Council or funding partners.
Authorship
Contribution: C.B., K.B., A.P.N., and S.-R.P. conceptualized the study; C.B., V.E.J., U.S., A.L.G., S.J.L., E.J.B., A.R.G., W.S.A., M.B., A.P.N., and S.-R.P. designed the research; C.B., V.E.J., A.P., T.H., G.M.-M., K.F., R.A., D.C., and A.B. performed the research; C.B., V.E.J., A.L.G., and C.S.N.L.-W.-S. analyzed the data; and C.B., V.E.J., U.S., R.A., D.C., A.B., W.S.A., M.B., A.P.N., and S.-R.P. wrote the manuscript.
Conflict-of-interest disclosure: U.S. is a full-time employee of Silence Therapeutics GmbH and has stock options. The remaining authors declare no competing financial interests.
Correspondence: Cavan Bennett, Population Health and Immunity Division, Walter and Eliza Hall Institute of Medical Research, 1G Royal Pde, Parkville, VIC 3052, Australia; e-mail: bennett.c@wehi.edu.au; and Sant-Rayn Pasricha, Population Health and Immunity Division, The Walter and Eliza Hall Institute of Medical Research, 1G Royal Pde, Parkville, VIC 3052, Australia; e-mail: pasricha.s@wehi.edu.au.
References
Author notes
Data are available on request from the corresponding authors, Cavan Bennett (bennett.c@wehi.edu.au) and Sant-Rayn Pasricha (pasricha.s@wehi.edu.au).
The online version of this article contains a data supplement.
There is a Blood Commentary on this article in this issue.
The publication costs of this article were defrayed in part by page charge payment. Therefore, and solely to indicate this fact, this article is hereby marked “advertisement” in accordance with 18 USC section 1734.

This feature is available to Subscribers Only
Sign In or Create an Account Close Modal