Key Points
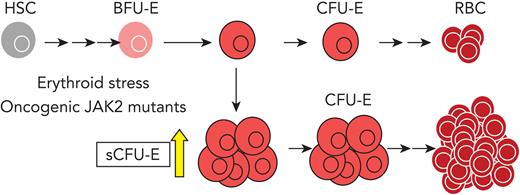
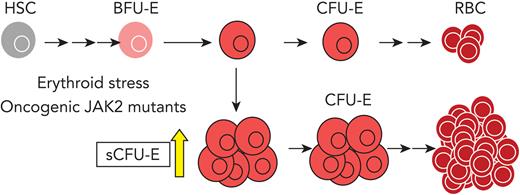
Epo-induced IRS2 allows engagement of IGF1R signaling to expand a previously unrecognized progenitor population in erythropoietic stress.
Truncated EpoR does not support stress CFU-E expansion and protects against JAK2(V617F)-driven erythrocytosis in myeloproliferative neoplasm.
Abstract
We found that in regenerative erythropoiesis, the erythroid progenitor landscape is reshaped, and a previously undescribed progenitor population with colony-forming unit-erythroid (CFU-E) activity (stress CFU-E [sCFU-E]) is expanded markedly to restore the erythron. sCFU-E cells are targets of erythropoietin (Epo), and sCFU-E expansion requires signaling from the Epo receptor (EpoR) cytoplasmic tyrosines. Molecularly, Epo promotes sCFU-E expansion via JAK2- and STAT5-dependent expression of IRS2, thus engaging the progrowth signaling from the IGF1 receptor (IGF1R). Inhibition of IGF1R and IRS2 signaling impairs sCFU-E cell growth, whereas exogenous IRS2 expression rescues cell growth in sCFU-E expressing truncated EpoR-lacking cytoplasmic tyrosines. This sCFU-E pathway is the major pathway involved in erythrocytosis driven by the oncogenic JAK2 mutant JAK2(V617F) in myeloproliferative neoplasm. Inability to expand sCFU-E cells by truncated EpoR protects against JAK2(V617F)-driven erythrocytosis. In samples from patients with myeloproliferative neoplasm, the number of sCFU-E-like cells increases, and inhibition of IGR1R and IRS2 signaling blocks Epo-hypersensitive erythroid cell colony formation. In summary, we identified a new stress-specific erythroid progenitor cell population that links regenerative erythropoiesis to pathogenic erythrocytosis.
Introduction
Hematologic homeostasis in adult humans requires the production of roughly 200 billion new erythrocytes per day. Erythropoiesis is a multistep process that begins when hematopoietic stem cells differentiate into erythroid progenitors. The earliest committed erythroid progenitors are the burst-forming unit-erythroid (BFU-E) cells, which divide and differentiate into colony-forming unit-erythroid (CFU-E) cells. CFU-E progenitors further proliferate and differentiate into erythroid precursors, which undergo terminal maturation to generate erythrocytes.
Erythropoietin (Epo) is the principal cytokine that controls erythropoiesis.1-3 Epo binding to Epo receptor (EpoR) activates the tyrosine kinase JAK2, which associates with the EpoR cytoplasmic domain. Activated JAK2 phosphorylates many of the tyrosine residues in the EpoR cytoplasmic domain, leading to docking of signaling proteins and subsequent activation of the STAT5, phosphatidylinositol 3-kinase (PI3K)/Akt, and MAPK pathways.4-6 Together, these pathways promote erythroid cell survival, proliferation, and differentiation.
At steady-state, normal Epo levels support basal erythropoiesis to replace the clearance of aged erythrocytes. Erythropoietic stress such as bleeding causes Epo levels to surge, dramatically increasing erythropoiesis via a process termed stress erythropoiesis. Stress erythropoiesis is critical for recovery and survival from blood loss, anemia of multiple causes, or therapeutic procedures such as chemotherapy and stem cell transplantation. Despite the importance of stress erythropoiesis, our understanding of this process remains incomplete.
Stress erythropoiesis differs from basal erythropoiesis in several ways. Basal erythropoiesis is achieved by fine-tuning survival and proliferation of erythroid precursors downstream of CFU-E cells, whereas stress erythropoiesis expands both erythroid precursors and progenitors.7-10 Although both basal and stress erythropoiesis each are regulated by EpoR, only stress erythropoiesis requires an intact EpoR cytoplasmic domain. Mice expressing a truncated EpoR lacking all cytoplasmic domain tyrosines have a near-normal basal hematocrit, but are deficient in their response to stress.11,12 In addition to Epo, stress erythropoiesis also involves corticosteroids, stem cell factor (SCF), and signaling from bone morphogenetic protein 4 (BMP4).13-15
Myeloproliferative neoplasms (MPNs) are a group of chronic myeloid malignancies characterized by clonal expansion of 1 or more myeloerythroid lineage cells. Clinically, MPNs present as overproduction of erythrocytes (polycythemia vera [PV]) or platelets (essential thrombocytosis), or as bone marrow fibrosis (primary myelofibrosis). MPNs can transform into acute myeloid leukemias, which commonly have a poor prognosis.16-18 In PV, erythropoiesis progresses at an aberrantly high rate even in the absence of increased Epo because of somatic mutations (most commonly V617F) in JAK2 that constitutively activate JAK2 kinase activity.19,20 Although Epo-independent, JAK2(V617F)-induced erythrocytosis still requires the EpoR to engage downstream signaling proteins.21
Although EpoR signaling in more differentiated erythroblasts has been well characterized,21-23 EpoR signaling in earlier progenitors is less well understood. In this study, we discovered a new population of progenitors that are able to form CFU-E-like colonies, herein termed stress CFU-E (sCFU-E), that specifically are expanded by erythropoietic stress. Failure to stimulate sCFU-E expansion in mice expressing truncated EpoR blocks both regenerative erythropoiesis and JAK2(V617F)-driven erythrocytosis, suggesting that oncogenic JAK2 hijacks sCFU-Es to promote erythrocytosis in MPN.
Methods
Mice, phlebotomy, Epo, and phenylhydrazine injection
Three- to 6-month-old mice were used for all experiments. Phlebotomy was performed by submandibular bleeding (400 μL) followed by fluid replacement with saline twice over 6 hours. For phenylhydrazine (PHZ) treatments, mice were injected intraperitoneally with 62.5 mg/kg (low dose) or 87.5 mg/kg (high dose) PHZ on days 0 and 1. For Epo injections, 100 U of Epoetin alpha (Amgen) was injected once subcutaneously.
Flow cytometry
For progenitor analyses, BFU-E and CFU-E progenitors were identified as described.24 Data were acquired on an LSRII, Fortessa, or Aria (BD Biosciences) flow cytometer and analyzed with FlowJo software (BD Biosciences).
In vitro culture of erythroid progenitors
BFU-E, sCFU-E, and CFU-E cells were sorted from murine bone marrow after immune depletion of lineage (Lin)-committed cells and hematopoietic stem cells (Sca1) using biotin-conjugated antibodies followed by streptavidin-conjugated magnetic resin. Sorted cells were cultured in StemPro34 (Thermo Fisher Scientific, Gibco) media supplemented with 2 U/mL Epo, 100 ng/mL SCF, 40 ng/mL IGF1, and 1 μM dexamethasone and were analyzed at the indicated time.
Human MPN patient samples
Bone marrow mononuclear samples were obtained from deidentified patients with PV, lymphoma, and monoclonal gammopathy of undetermined significance who gave informed consent. Human BFU-E and CFU-E cells were identified as described.25 For in vitro culture samples, sorted PV CD34+CD36– cells were expanded first in StemSpan SFEM media with StemSpan CC100 (both from StemCell Technologies) for 3 days. Subsequently, cells were cultured in SFEM media with CC100 and Epo (3 U/mL; day 0). As controls, normal CD34+ cells (Cooperative Center of Excellence in Hematology at Fred Hutch) were sorted, expanded, and cultured in parallel.
Statistical analyses
Data are reported as mean ± standard deviation (SD). Statistical significance was determined by using the Student t test or analysis of variance (ANOVA). A P value of < .05 was considered statistically significant. Normality tests and statistical analyses were performed using Prism 9 software (GraphPad).
Study approval
Deidentified human samples were acquired through the Hematologic Malignancies Tissue Bank at UT Southwestern with institutional review board approval. All participants gave informed consent. All mouse studies were approved by the institutional animal care and use committee.
Additional methods
Detailed methods can be found in the online article in the supplemental Methods.
Results
Phlebotomy induces expansion of a new population of erythroid progenitors
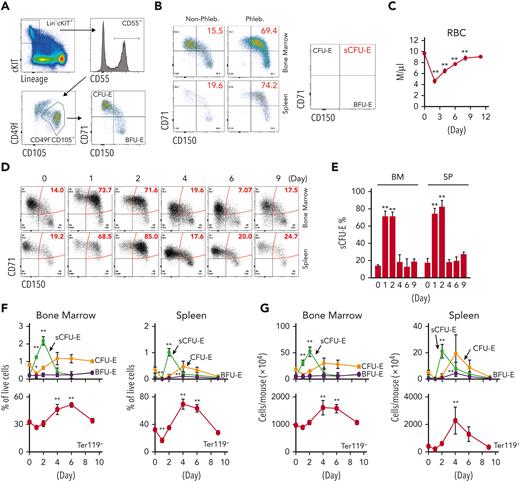
To examine early erythroid progenitors, we used a method that allows flow cytometric identification of murine BFU-E and CFU-E cells in adult hematopoietic tissues.24 In this assay, Lin–Kit+CD55+CD105+ cells are dissected into BFU-E (CD150+CD71–) and CFU-E (CD150-CD71+) cells (Figure 1A). Interestingly, a drastic expansion of an intermediate cell population that was CD150+CD71+ was observed on phlebotomy, a physiologic erythropoietic stress (Figure 1B). We designated this population as sCFU-E cells based on our subsequent characterization. During erythron recovery, wild-type mice exhibited a nadir in the number of red blood cells (RBCs) 2 days after phlebotomy and recovered a normal hematocrit by day 9 (Figure 1C). Expansion of sCFU-E cells was observed 1 day after phlebotomy and coincided with a decrease in BFU-E. Thereafter, the number of sCFU-E cells decreased, whereas the number of CFU-E cells increased, followed by an increase in Ter119+ erythroblasts (Figure 1D-G). Similar observations were made in the spleen (Figure 1D-G). These observations suggest that sCFU-Es are involved in regenerative erythropoiesis.
sCFU-E cells expand in erythropoietic stress. (A) Flow cytometric gating strategy. (B) Percentages of sCFU-E cells increase in the bone marrow and spleen of phlebotomized (Phleb.) mice 2 days after phlebotomy. (C) RBC counts on indicated day after phlebotomy. (D) Representative flow cytometry plots of temporal sCFU-E cell increases in the bone marrow (BM) and spleen (SP) of phlebotomized mice. (E) Quantification of percentage changes of sCFU-E cells in (D). (F) Quantification of BFU-E, sCFU-E, CFU-E, and Ter119+ cell percentages in phlebotomized mice at indicated times. (G) Total numbers of BFU-E, sCFU-E, CFU-E, and Ter119+ cells in phlebotomized mice at indicated times. Data represent the mean ± SD. ∗P < .05; ∗∗P < .01, 1-way ANOVA.
sCFU-E cells expand in erythropoietic stress. (A) Flow cytometric gating strategy. (B) Percentages of sCFU-E cells increase in the bone marrow and spleen of phlebotomized (Phleb.) mice 2 days after phlebotomy. (C) RBC counts on indicated day after phlebotomy. (D) Representative flow cytometry plots of temporal sCFU-E cell increases in the bone marrow (BM) and spleen (SP) of phlebotomized mice. (E) Quantification of percentage changes of sCFU-E cells in (D). (F) Quantification of BFU-E, sCFU-E, CFU-E, and Ter119+ cell percentages in phlebotomized mice at indicated times. (G) Total numbers of BFU-E, sCFU-E, CFU-E, and Ter119+ cells in phlebotomized mice at indicated times. Data represent the mean ± SD. ∗P < .05; ∗∗P < .01, 1-way ANOVA.
To examine the temporal relationship between these progenitors, in vitro cultures were set up in which BFU-E cells from normal or phlebotomized mice were isolated prospectively and cultured in media containing SCF, Epo, and dexamethasone to mimic stress erythropoiesis. Consistent with results in vivo, BFU-Es gave rise to sCFU-Es in 24 hours, which further differentiate into CFU-Es (supplemental Figure 1). Therefore, as erythropoiesis proceeds as a continuum,24,26,27 the temporal order of development proceeds from BFU-E to sCFU-E to CFU-E.
Characterization of sCFU-E cells
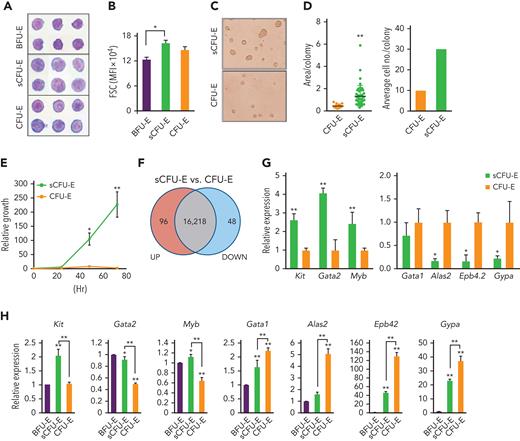
BFU-E, sCFU-E, and CFU-E cells from the bone marrow of phlebotomized mice were isolated and analyzed by histologic and colony assays. By Giemsa staining, sCFU-Es were more similar to CFU-Es and were larger than BFU-Es, consistent with their higher forward scatter intensity (Figure 2A-B). sCFU-E and CFU-E cells also showed more prominent nucleoli as compared with BFU-E cells (Figure 2A). In colony assays, sCFU-Es generated unifocal CFU-E-like colonies by day 2, not large multifocal burst colonies like BFU-Es, which usually take 5 to 7 days (Figure 2C). That both sCFU-E and CFU-E cells formed CFU-E-like colonies is consistent with our observation that the predominant colonies expanded after phlebotomy were CFU-E, but not BFU-E, colonies (supplemental Figure 2). Interestingly, sCFU-E colonies were significantly larger and contained about 3 times as many cells as CFU-E colonies (Figure 2C-D), suggesting that they possess higher proliferative potential. Indeed, sorted sCFU-E cells proliferated longer and generated more erythroid progeny compared with CFU-E cells in vitro (Figure 2E).
sCFU-E cells exhibit higher growth potential and express lower levels of erythroid-committed genes compared with CFU-E cells. (A) Histologic staining of sorted BFU-E, sCFU-E, and CFU-E cells. (B) Quantification of forward scatter (FSC) median fluorescence intensity, an indicator of cell size, by flow cytometry. (C) sCFU-E cells generate unifocal colonies on day 2. Colonies generated from sCFU-E cells are larger than those from CFU-E cells. (D) Quantification of area per colony and average cell number per colony in (C). (E) Sorted sCFU-E cells generate more progenies than CFU-E cells in vitro. (F) Comparison of sCFU-E and CFU-E cell transcriptome by RNA-seq. The number of genes with expression greater (up) or less (down) than 1.5-fold are indicated. (G) Relative expression of indicated genes in sCFU-E vs CFU-E cells from RNA-seq data. (H) Expression of indicated genes in sorted BFU-E, sCFU-E, and CFU-E by qPCR. Gene expression is normalized first to β-actin and then to expression in BFU-E cells. Significant differences between sCFU-E and CFU-E cells are specified. Data represent mean ± SD. Statistically significant differences indicated on top of each bar are in comparison with BFU-E cells. ∗P < .05; ∗∗P < .01, Student’s t test or 1-way ANOVA.
sCFU-E cells exhibit higher growth potential and express lower levels of erythroid-committed genes compared with CFU-E cells. (A) Histologic staining of sorted BFU-E, sCFU-E, and CFU-E cells. (B) Quantification of forward scatter (FSC) median fluorescence intensity, an indicator of cell size, by flow cytometry. (C) sCFU-E cells generate unifocal colonies on day 2. Colonies generated from sCFU-E cells are larger than those from CFU-E cells. (D) Quantification of area per colony and average cell number per colony in (C). (E) Sorted sCFU-E cells generate more progenies than CFU-E cells in vitro. (F) Comparison of sCFU-E and CFU-E cell transcriptome by RNA-seq. The number of genes with expression greater (up) or less (down) than 1.5-fold are indicated. (G) Relative expression of indicated genes in sCFU-E vs CFU-E cells from RNA-seq data. (H) Expression of indicated genes in sorted BFU-E, sCFU-E, and CFU-E by qPCR. Gene expression is normalized first to β-actin and then to expression in BFU-E cells. Significant differences between sCFU-E and CFU-E cells are specified. Data represent mean ± SD. Statistically significant differences indicated on top of each bar are in comparison with BFU-E cells. ∗P < .05; ∗∗P < .01, Student’s t test or 1-way ANOVA.
To compare sCFU-E and CFU-E cells, gene expression across the transcriptome were analyzed by RNA-seq using triplicate biological samples sorted from phlebotomized mouse marrow. We found that transcriptomes of sCFU-E and CFU-E cells were similar, with only 144 genes differentially expressed (fold change >1.5 and P < .05) (Figure 2F). Although no pathways were enriched in the differentially expressed genes (data not shown), several genes associated with an earlier stem or progenitor signature were enriched in sCFU-E cells, and genes associated with committed erythropoietic functions were enriched in CFU-E cells (Figure 2G). For example, the transcription factors Gata2 and Myb, as well as the receptor for stem cell factor c-Kit, were higher in sCFU-Es, whereas Alas2 (erythroid-specific delta-aminolevulinate synthase 2), Epb4.2 (erythrocyte membrane protein band 4.2), and Gypa (glycophorin A) were expressed at higher levels in CFU-E cells (Figure 2G). RNA-seq results were corroborated with quantitative polymerase chain reaction (qPCR) analyses using sorted BFU-E, sCFU-E, and CFU-E cells from phlebotomized mice (Figure 2H). These results suggest that in erythropoietic stress, an unexpected shift occurs within the erythroid progenitor compartment, in which a new cell population with higher proliferation potential, sCFU-E, is expanded disproportionally relative to CFU-E cells, increasing erythropoietic output.
sCFU-E expansion requires distal EpoR signaling
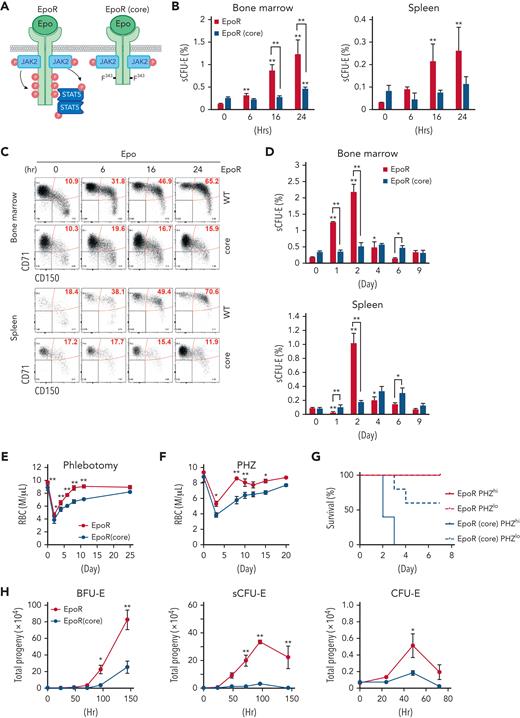
Because Epo critically regulates stress erythropoiesis, we tested whether sCFU-E cells are direct targets of Epo by analyzing erythroid progenitors after Epo injection. sCFU-E cells significantly expanded in both marrow and spleen starting as early as 6 hours after Epo injection (Figure 3B-C). We also examined sCFU-E expansion in a knockin mouse model expressing a truncated EpoR lacking all cytoplasmic tyrosine residues (EpoR-HM).12 This mouse was shown to support only basal erythropoiesis, not stress erythropoiesis (Figure 3A).3,11,12 Because this truncated EpoR represents a core minimal receptor sufficient for basal erythropoiesis, we refer to it as EpoR(core) herein (Figure 3A). Contrary to what was observed in wild-type mice, Epo injection failed to increase sCFU-E cells in EpoR(core) mice (Figure 3B-C). EpoR(core) mice also did not expand sCFU-E cells in response to phlebotomy (Figure 3D) and showed a slower recovery (Figure 3E). EpoR(core) mice also recovered more slowly and died of hemolysis challenge induced by high-dose phenylhydrazine (Figure 3F-G).
sCFU-E cells expansion is impaired in mice expressing truncated EpoR. (A) Diagrams of full-length EpoR and EpoR(core). (B) Epo-induced sCFU-E expansion is defective in EpoR(core) mice. Percentages of sCFU-E cells in the bone marrow or spleen were quantified at indicated times after Epo injection in mice expressing wild-type EpoR or EpoR(core). Statistically significant differences indicated on top of each bar are in comparison with time 0, whereas significant differences between EpoR and EpoR(core) at specific time points are specified. (C) Representative flow cytometry data from (B). (D) sCFU-E expansion after phlebotomy is defective in EpoR(core) mice. Statistically significant differences indicated on top of each bar are comparison with day 0, whereas significant differences between EpoR and EpoR(core) at specific time points are specified. (E) RBC counts after phlebotomy in mice expressing EpoR or EpoR(core) at indicated times. (F) RBC counts after PHZ-induced hemolysis in mice expressing EpoR or EpoR(core) at indicated times. (G) EpoR(core) mice die of erythropoietic stress elicited by PHZ treatment. Dosing of 62.5 mg/kg (PHZlo) or 87.5 mg/kg (PHZhi) is as indicated. (H) Sorted BFU-E and sCFU-E cells from EpoR(core) mice generated dramatically fewer erythroid progenies. Ter119+ erythroid progenies are enumerated at indicated time harvested from in vitro culture. Data represent the mean ± SD. ∗P < .05; ∗∗P < .01, 2-way ANOVA.
sCFU-E cells expansion is impaired in mice expressing truncated EpoR. (A) Diagrams of full-length EpoR and EpoR(core). (B) Epo-induced sCFU-E expansion is defective in EpoR(core) mice. Percentages of sCFU-E cells in the bone marrow or spleen were quantified at indicated times after Epo injection in mice expressing wild-type EpoR or EpoR(core). Statistically significant differences indicated on top of each bar are in comparison with time 0, whereas significant differences between EpoR and EpoR(core) at specific time points are specified. (C) Representative flow cytometry data from (B). (D) sCFU-E expansion after phlebotomy is defective in EpoR(core) mice. Statistically significant differences indicated on top of each bar are comparison with day 0, whereas significant differences between EpoR and EpoR(core) at specific time points are specified. (E) RBC counts after phlebotomy in mice expressing EpoR or EpoR(core) at indicated times. (F) RBC counts after PHZ-induced hemolysis in mice expressing EpoR or EpoR(core) at indicated times. (G) EpoR(core) mice die of erythropoietic stress elicited by PHZ treatment. Dosing of 62.5 mg/kg (PHZlo) or 87.5 mg/kg (PHZhi) is as indicated. (H) Sorted BFU-E and sCFU-E cells from EpoR(core) mice generated dramatically fewer erythroid progenies. Ter119+ erythroid progenies are enumerated at indicated time harvested from in vitro culture. Data represent the mean ± SD. ∗P < .05; ∗∗P < .01, 2-way ANOVA.
Consistent with the impaired sCFU-E expansion in EpoR(core) mice, sorted sCFU-Es from EpoR(core) mice generated significantly fewer progeny compared with those from wild-type mice in vitro (Figure 3H). Similarly, the upstream BFU-Es from EpoR(core) mice generated less progenies. Sorted CFU-E cells from EpoR(core) mice also generated fewer progenies, but the degree of reduction was mild. Ter119+ erythroblasts, especially FSClargeCD71hi erythroblasts, expanded normally in EpoR(core) mice (supplemental Figure 3).28 These results suggest that despite the ability to increase late erythroblasts, failure of sCFU-E expansion restricted erythroid output of EpoR(core) mice in stress. Moreover, EpoR cytoplasmic tyrosines are necessary for sCFU-E expansion.
The STAT5 pathway is necessary and sufficient for sCFU-E expansion
To probe the underlying mechanism of sCFU-E expansion, we compared proliferation and apoptosis in sCFU-E cells in phlebotomized vs normal mice. In the marrow, sCFU-Es showed higher proliferation in phlebotomized mice compared with nonphlebotomized mice. In the spleen, both higher proliferation and reduced apoptosis was observed (Figure 4A-B). Therefore, sCFU-E expansion involves enhanced proliferation and reduced apoptosis in erythropoietic stress.
STAT5 signaling is essential for sCFU-E growth. (A) Proliferation increases in sCFU-E cells after phlebotomy. (B) Apoptosis decreases in sCFU-E cells after phlebotomy. In (A) and (B), sCFU-E cells from freshly isolated bone marrow were gated for analyses. (C) Inhibitors to STAT5 abolish sCFU-E growth. Sorted BFU-E and sCFU-E cells are cultured in 10 μM of inhibitors or vehicle control (dimethyl sulfoxide [DMSO]) and analyzed after 48 hours. Phosphate-buffered saline (PBS)-treated samples also are shown as controls. (D) Diagrams of EpoR(core) and EpoR(core+Y343). (E) Y343 in EpoR rescues STAT5 binding and sCFU-E expansion in EpoR(core+Y343) mice. Data represent the mean ± SD. BrdU, bromodeoxyuridine; Phleb., phlebotomized. ∗P < .05; ∗∗P < .01, Student’s t test or 2-way ANOVA.
STAT5 signaling is essential for sCFU-E growth. (A) Proliferation increases in sCFU-E cells after phlebotomy. (B) Apoptosis decreases in sCFU-E cells after phlebotomy. In (A) and (B), sCFU-E cells from freshly isolated bone marrow were gated for analyses. (C) Inhibitors to STAT5 abolish sCFU-E growth. Sorted BFU-E and sCFU-E cells are cultured in 10 μM of inhibitors or vehicle control (dimethyl sulfoxide [DMSO]) and analyzed after 48 hours. Phosphate-buffered saline (PBS)-treated samples also are shown as controls. (D) Diagrams of EpoR(core) and EpoR(core+Y343). (E) Y343 in EpoR rescues STAT5 binding and sCFU-E expansion in EpoR(core+Y343) mice. Data represent the mean ± SD. BrdU, bromodeoxyuridine; Phleb., phlebotomized. ∗P < .05; ∗∗P < .01, Student’s t test or 2-way ANOVA.
Three major pathways downstream of EpoR are the STAT5, PI3K/Akt, and MAPK pathways. We treated sorted BFU-E and sCFU-E cells in vitro with pathway inhibitors and examined the effects. The STAT5 inhibitor pimozide completely abolished sCFU-E cell growth, whereas PI3K and MAPK inhibitors showed much weaker effects (Figure 4C; supplemental Figure 4). This is consistent with prior findings that STAT5-deficient mice have a near-normal hematocrit, but are deficient in erythropoietic stress response.10
To verify the role of STAT5 in sCFU-E expansion, we used another murine model, EpoR-H (henceforth referred to as EpoR[core+Y343]), that expresses EpoR(core) with Tyr343 restored (Figure 4D).12 EpoR Tyr343 is a major STAT5 binding site and rescues both STAT5 activation and erythropoietic stress response in EpoR(core).11 EpoR(core+Y343) rescued sCFU-E expansion on phlebotomy (Figure 4E), suggesting that the EpoR/JAK2/STAT5 signaling pathway promotes sCFU-E expansion in stress erythropoiesis.
The IGF1R/IRS2 pathway regulates sCFU-E expansion
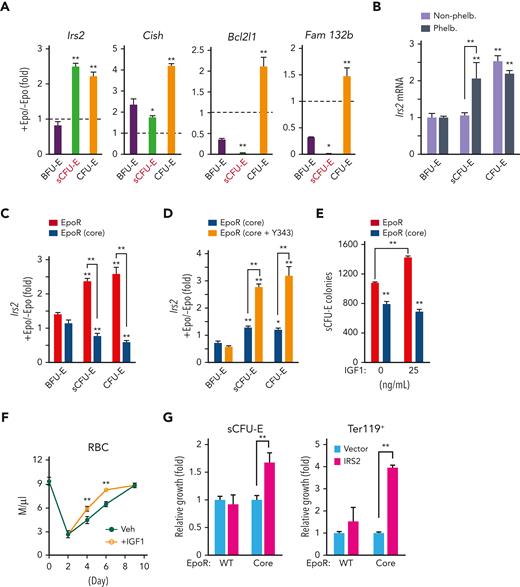
We examined several known STAT5 target genes downstream of Epo in sCFU-E cells, including Cish, a feedback negative regulator of cytokine receptor signaling, Bcl2l1, an antiapoptosis modulator, and Fam132b (also known as erythroferron), which regulates iron distribution. Although these targets all were induced in CFU-E cells, they were hardly induced in sCFU-E cells (Figure 5A). In contrast, Irs2 (insulin receptor substrate 2) was induced acutely in sCFU-E cells by Epo (Figure 5A) or phlebotomy (Figure 5B). Consistent with the defect of EpoR(core), but not EpoR(core+Y343), to support sCFU-E expansion, Epo-induced Irs2 expression was hampered in EpoR(core) and was restored in EpoR(core+Y343) sCFU-E (Figure 5C-D).
STAT5-induced IRS2 engages IGF1R signaling to promote sCFU-E growth. (A) Epo-induced expression of candidate STAT5 target genes in sorted BFU-E, sCFU-E, and CFU-E cells by qPCR. (B) Phlebotomy induces IRS2 expression in sCFU-E cells. Statistically significant differences indicated on top of each bar are comparison with BFU-E cells, whereas significant differences between nonphlebotomized and phlebotomized (phleb.) conditions are specified. (C) Epo-induced IRS2 expression is defective in sCFU-E and CFU-E cells of EpoR(core) mice. (D) Y343 rescues Epo-induced IRS2 expression in EpoR(core+Y343) sCFU-E and CFU-E cells. (E) IGF1 increases sCFU-E colonies in mice expressing wild-type (WT) but not EpoR(core). (F) IGF1 injection accelerates RBC recovery after phlebotomy. (G) Exogenous expression of IRS2 increases the growth of sCFU-E cells and the number of Ter119+ progenies generated in bone marrow cells from EpoR(core). GFP+ cells were gated for analyses and normalized to vector controls. Veh., vehicle control. ∗P < .05; ∗∗P < .01, 1-way or 2-way ANOVA.
STAT5-induced IRS2 engages IGF1R signaling to promote sCFU-E growth. (A) Epo-induced expression of candidate STAT5 target genes in sorted BFU-E, sCFU-E, and CFU-E cells by qPCR. (B) Phlebotomy induces IRS2 expression in sCFU-E cells. Statistically significant differences indicated on top of each bar are comparison with BFU-E cells, whereas significant differences between nonphlebotomized and phlebotomized (phleb.) conditions are specified. (C) Epo-induced IRS2 expression is defective in sCFU-E and CFU-E cells of EpoR(core) mice. (D) Y343 rescues Epo-induced IRS2 expression in EpoR(core+Y343) sCFU-E and CFU-E cells. (E) IGF1 increases sCFU-E colonies in mice expressing wild-type (WT) but not EpoR(core). (F) IGF1 injection accelerates RBC recovery after phlebotomy. (G) Exogenous expression of IRS2 increases the growth of sCFU-E cells and the number of Ter119+ progenies generated in bone marrow cells from EpoR(core). GFP+ cells were gated for analyses and normalized to vector controls. Veh., vehicle control. ∗P < .05; ∗∗P < .01, 1-way or 2-way ANOVA.
IRS2 is an adaptor protein that mediates signaling from both the IGF1 receptor (IGF1R) and the insulin receptor,29 and erythroid progenitors express higher levels of IGF1R.24 Consistent with a role of IGF1R and IRS2 in sCFU-E expansion, IGF1 promoted sCFU-E colony formation in wild-type, but not EpoR(core), mice (Figure 5E). Injection of IGF1 also accelerated erythron recovery after phlebotomy in mice (Figure 5F).
We next examined whether exogenous IRS2 expression can rescue growth of EpoR(core) sCFU-E. Lin– marrow cells from wild-type or EpoR(core) mice were transduced retrovirally to express myc-tagged IRS2 using a bicistronic vector that also expresses green fluorescent protein (GFP). These cells were cultured first in the absence of Epo to allow IRS2 expression before switching to Epo-containing media to promote erythroid cell proliferation and differentiation. Transduction efficiencies were comparable between wild-type and EpoR(core) cells (data not shown), and GFP+ cells were gated for analyses. Exogenous expression of IRS2 significantly expanded EpoR(core) sCFU-E and downstream Ter119+ progenies (Figure 5G). Ter119+ progeny produced by EpoR(core) progenitors was greater in number than that produced by normal progenitors, possibly because EpoR(core), besides its inability to induce Irs2, also is defective in inducing negative regulators of EpoR signaling such as Cish (data not shown).
Impaired sCFU-E expansion prevents erythrocytosis in JAK2(V617F)-induced MPNs
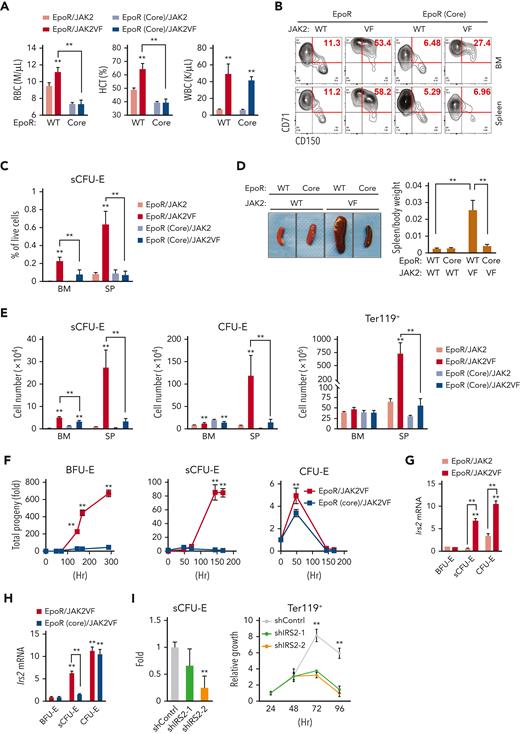
In MPNs, particularly PV, erythrocytes are overproduced as a result of abnormal and persistent high erythropoietic activity as in stress erythropoiesis. We previously showed that the EpoR, by acting as a scaffold to recruit signaling proteins, is required for the hyperactive JAK2 mutant JAK2(V617F) to drive erythrocytosis.21 To test whether JAK2(V617F) drives erythrocytosis via sCFU-E expansion, we used murine bone marrow transplant models of JAK2(V617F)-driven MPN (Figure 6A).21 In mice expressing normal EpoR, JAK2(V617F) drove both erythrocytosis and granulocytosis; however, in mice expressing EpoR(core), JAK2(V617F) drove granulocytosis, but sCFU-E expansion was impaired and erythrocytosis was suppressed fully (Figure 6A-C). These results were corroborated in a knockin model of JAK2(V617F)-induced PV driven by Mx1-cre.30 Erythrocytosis and splenomegaly were normalized in EpoR(core)JAK2(V617F)KI mice (Figure 6D; supplemental Figure 5), and the numbers of sCFU-E, CFU-E, and Ter119+ cells were reduced significantly (Figure 6E).
Impaired sCFU-E expansion prevents JAK2(V617F)-driven erythrocytosis in MPN. (A) Blood cell counts in transplanted mice expressing EpoR or EpoR(core) together with JAK2 or JAK2(V617F) 3 months after transplantation. (B-C) JAK2(V617F)-driven sCFU-E expansion is defective in transplant-recipient mice expressing EpoR(core). Representative flow plots are shown in (B) and quantifications in (C). (D) Expression of EpoR(core) prevents JAK2(V617F)-induced splenomegaly in JAK2(V617F)KI mice. (E) The numbers of sCFU-E, CFU-E, and Ter119+ cells are reduced significantly in EpoR(core)/JAK2(V617F)KI mice compared with EpoR/JAK2(V617F)KI mice. (F) Sorted BFU-E and sCFU-E cells from EpoR(core)/JAK2(V617F)KI mice fail to generate Ter119+ progenies in vitro. Cells were cultured in media with SCF, but devoid of Epo. (G) In mice expressing wild-type (WT) EpoR, JAK2(V617F) increases IRS2 messenger RNA (mRNA) expression in sCFU-E and CFU-E cells. (H) IRS2 mRNA expression is reduced significantly in sCFU-E cells from EpoR(core)/JAK2(V617F) mice. (I) IRS2 knockdown inhibits sCFU-E and erythroid progeny growth in vitro. GFP+ cells are gated for analyses. sCFU-E fold changes are normalized to shControl, and the relative growth of Ter119+ cells are normalized to cell numbers at 24 hours. BM, bone marrow; HCT, hematocrit; SP, spleen; VF, JAK2(V617F); WBC, white blood cell. ∗P < .05, ∗∗P < .01, 2-way ANOVA.
Impaired sCFU-E expansion prevents JAK2(V617F)-driven erythrocytosis in MPN. (A) Blood cell counts in transplanted mice expressing EpoR or EpoR(core) together with JAK2 or JAK2(V617F) 3 months after transplantation. (B-C) JAK2(V617F)-driven sCFU-E expansion is defective in transplant-recipient mice expressing EpoR(core). Representative flow plots are shown in (B) and quantifications in (C). (D) Expression of EpoR(core) prevents JAK2(V617F)-induced splenomegaly in JAK2(V617F)KI mice. (E) The numbers of sCFU-E, CFU-E, and Ter119+ cells are reduced significantly in EpoR(core)/JAK2(V617F)KI mice compared with EpoR/JAK2(V617F)KI mice. (F) Sorted BFU-E and sCFU-E cells from EpoR(core)/JAK2(V617F)KI mice fail to generate Ter119+ progenies in vitro. Cells were cultured in media with SCF, but devoid of Epo. (G) In mice expressing wild-type (WT) EpoR, JAK2(V617F) increases IRS2 messenger RNA (mRNA) expression in sCFU-E and CFU-E cells. (H) IRS2 mRNA expression is reduced significantly in sCFU-E cells from EpoR(core)/JAK2(V617F) mice. (I) IRS2 knockdown inhibits sCFU-E and erythroid progeny growth in vitro. GFP+ cells are gated for analyses. sCFU-E fold changes are normalized to shControl, and the relative growth of Ter119+ cells are normalized to cell numbers at 24 hours. BM, bone marrow; HCT, hematocrit; SP, spleen; VF, JAK2(V617F); WBC, white blood cell. ∗P < .05, ∗∗P < .01, 2-way ANOVA.
To compare directly the ability of JAK2(V617F) to drive constitutive signaling in cells expressing wild-type EpoR or EpoR(core), we isolated BFU-E, sCFU-E, and CFU-E cells from EpoR/JAK2(V617F)KI and EpoR(core)/JAK2(V617F)KI mice and compared their growth in vitro in the absence of Epo. sCFU-E and BFU-E cells with a normal EpoR grew robustly in the absence of Epo, but sCFU-E and BFU-E cells from EpoR(core) did not (Figure 6F). CFU-E cells from both animals showed similar growth, indicating that signals in CFU-E and later Ter119+ erythroblasts largely are preserved in EpoR(core) cells (Figure 6F). Even in cultures with Epo, BFU-E and sCFU-E expressing JAK2(V617F) with wild-type EpoR grew much better and generated more progeny than those with EpoR(core), whereas the difference in CFU-E was mild (supplemental Figure 6). These results show that JAK2(V617F)-dependent erythrocytosis requires induction of sCFU-E via signaling downstream of EpoR.
Consistent with the importance of IGF1R/IRS2 signaling in sCFU-E expansion, Irs2 expression was higher in sCFU-E in mice expressing JAK2(V617F) than wild-type JAK2 (Figure 6G). Irs2 expression also was higher in sCFU-E from EpoR/JAK2(V617F) mice than from EpoR(core)/JAK2(V617F) mice (Figure 6H). Irs2 expression was normal in EpoR(core)/JAK2(V617F) CFU-E cells, indicating that alternative ways to upregulate Irs2 in CFU-E cells exist.
To test whether IRS2 is essential for sCFU-E proliferation, we knocked down IRS2 in Lin– bone marrow cells from EpoR/JAK2(V617F) mice using retroviral short hairpin RNA (shRNA) vectors. After a brief culture to allow for shRNA expression, cells were cultured in low Epo media and were compared for erythroid cell proliferation and differentiation. Two independent shRNAs targeting IRS2 decreased sCFU-E cell growth and production of downstream Ter119+ progeny relative to control shRNA (Figure 6I), demonstrating that IRS2 is necessary for sCFU-E expansion in JAK2(V617F)-driven erythrocytosis.
sCFU-E cells are expanded in human MPN
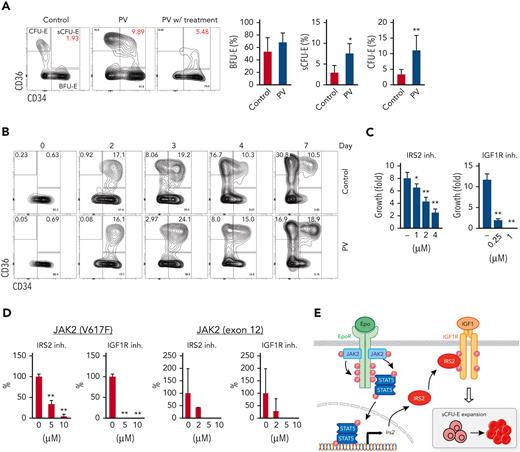
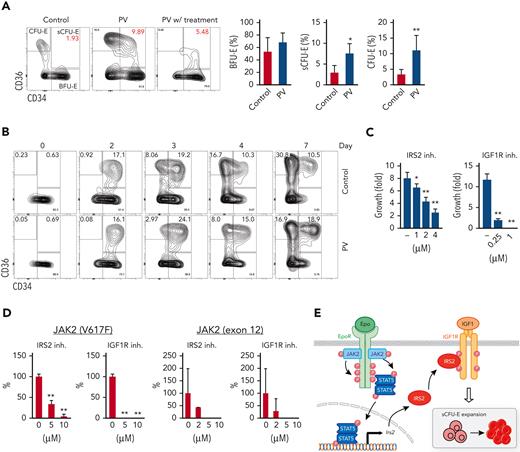
In humans, intermediate populations between BFU-E and CFU-E cells have been observed,31-33 and IRS2 expression increases on erythroid differentiation in CD34+ cell culture samples.34 Therefore, we tried to correlate our findings in the human setting. We examined bone marrow samples from patients with JAK2(V617F)-positive PV using established immunophenotypic markers for human BFU-E and CFU-E cells.25 Samples from lymphoma and monoclonal gammopathy of undetermined significance that showed no marrow involvement were used as controls. Within Lin–IL3R– cells, BFU-E cells were identified as CD34+CD36– and CFU-E cells as CD34–CD36+. Stem and early hematopoietic progenitors also are included in the BFU-E gate, but their numbers are presumably low. Similar to sCFU-E cells observed in mice, PV samples showed significantly more intermediate CD34+CD36+ cells compared with controls (Figure 7A; supplemental Figure 7). PV samples also showed significantly more CFU-E cells (Figure 7A). Consistent with an essential role of JAK2 signaling, fewer CD34+CD36+ and CFU-E cells were observed in a PV sample from a patient treated with JAK2 inhibitors and hydroxyurea (Figure 7A). We also established in vitro cultures of sorted PV BFU-E cells and normal controls. Similar to what was observed in murine cultures, BFU-E cells progressed to CD34+CD36+ cells then to CFU-E cells (Figure 7B). Importantly, although the initial percentages of CD34+CD36+ cells were similar between control and PV samples (day 2), higher percentages of CD34+CD36+ cells persisted in PV culture samples (Figure 7B; supplemental Figure 8). Together, these results suggest that CD34+CD36+ cells are equivalent to sCFU-E cells observed in murine models.
sCFU-E cells are expanded in human PV, and inhibition of IGF1R/IRS2 signaling suppresses Epo-hypersensitive erythroid colonies. (A) Percentages of CD34+CD36+ and CD34–CD36+cells increase in PV samples. (B) In vitro culture of sorted BFU-E cells from PV or controls. Cells are examined by flow cytometry on indicated day after culture. (C) Inhibitors of IRS2 or IGF1R kinase activity reduce sorted murine sCFU-E growth in vitro. Data presented are 48 hours in culture. (D) IRS2 and IGF1R kinase inhibitors reduce the number of erythroid colonies grown from peripheral mononuclear cells from patients with PV. Cells are cultured in methylcellulose media with SCF (50 ng/mL) and low Epo (0.05 U/mL), and colonies are scored on day 14. (E) Current model of EpoR-IGF1R/IRS2 signaling cross talk. inh., inhibitor .∗P < .05; ∗∗P < .01, Student’s t test or 1-way ANOVA.
sCFU-E cells are expanded in human PV, and inhibition of IGF1R/IRS2 signaling suppresses Epo-hypersensitive erythroid colonies. (A) Percentages of CD34+CD36+ and CD34–CD36+cells increase in PV samples. (B) In vitro culture of sorted BFU-E cells from PV or controls. Cells are examined by flow cytometry on indicated day after culture. (C) Inhibitors of IRS2 or IGF1R kinase activity reduce sorted murine sCFU-E growth in vitro. Data presented are 48 hours in culture. (D) IRS2 and IGF1R kinase inhibitors reduce the number of erythroid colonies grown from peripheral mononuclear cells from patients with PV. Cells are cultured in methylcellulose media with SCF (50 ng/mL) and low Epo (0.05 U/mL), and colonies are scored on day 14. (E) Current model of EpoR-IGF1R/IRS2 signaling cross talk. inh., inhibitor .∗P < .05; ∗∗P < .01, Student’s t test or 1-way ANOVA.
Ashley et al32 recently showed that intermediate CD34+CD36+ cells could be grown from CD34+ cell culture in vitro and could form CFU-E colonies. These cells can be dissected further into immature CD71medCD105med and mature CD71hiCD105hi subsets, and only CD71medCD105med cells are responsive to dexamethasone.32 Murine sCFU-E cells also express CD71 and CD105, and their expression increases as cells differentiate from BFU-E to sCFU-E to CFU-E cells (supplemental Figure 9). Contrasting from what was observed for dexamethasone, PV CD34+CD36+ cells showed increased percentages of the CD71hiCD105hi cells, but not the CD71hiCD105lo or CD71loCD105lo cells. A similar observation was made in PV mice, in which the CD71hiCD105hi subset expanded more than the CD71medCD105med subset in sCFU-E cells (supplemental Figure 10).
To examine the therapeutic potential of targeting the IGF1R/IRS2 pathway in MPN, we examined the effect of 2 inhibitors. NT157 causes IRS2 degradation, whereas BMS-754807 inhibits IGF1R kinase activity.35 Both inhibitors, in a dose-dependent manner, effectively inhibited murine sCFU-E growth (Figure 7C) and the ability of JAK2(V617F)-positive PV mononuclear cells to form erythroid colonies under low Epo conditions (Figure 7D). Some patients with PV harbor mutations in JAK2 exon 12 instead of V617F; these inhibitors also reduced erythroid colony formation in exon 12 mutant samples (Figure 7D).
Together, our results identify sCFU-E as a novel cell population specifically expanded in erythropoietic stress, and a synergistic cross talk between EpoR and IGF1R, mediated by IRS2, is essential for sCFU-E expansion (Figure 7E). Moreover, sCFU-E expansion is essential for oncogenic JAK2 mutants to drive erythrocytosis in MPN. Therapeutic targeting of sCFU-E cells, both positively and negatively, could be beneficial for treating anemia and MPN, respectively.
Discussion
In this study, we identified an intermediate progenitor population, hierarchically between BFU-E and CFU-E cells, that is induced specifically by erythropoietic stress. These sCFU-E cells are targets of rising plasma Epo, driving the recovery of peripheral RBC mass. In MPN, sCFU-E cells are hijacked by oncogenic JAK2 mutants to drive erythrocytosis. Molecularly, we showed that signaling from the EpoR distal domain, via STAT5 induction of IRS2, engages IGF1R signaling for sCFU-E expansion. These results identify sCFU-E cells as targets for therapeutic interventions in anemia or MPN.
Mechanisms regulating stress erythropoiesis are understood best in the mouse spleen, where it is observed most significantly. Survival of splenic Ter119+ erythroblasts, but not their bone-marrow counterparts, is regulated by Fas and FasL in stress erythropoiesis.36 Wnt and β-catenin signaling is not required for steady-state erythropoiesis, but rather for the proliferation of splenic stress erythroid progenitors.37,38 Moreover, elegant studies from the Paulson laboratory have shown that erythropoietic stress stimulates migration of short-term hematopoietic stem cells to the spleen, where they expand and differentiate into specialized stress BFU-E cells. Contrary to steady-state BFU-E cells, the generation of stress BFU-E cells requires splenic BMP4.13,39 Singbrant et al40 later showed that these stress BFU-E cells are enriched in Lin–Kit+CD71loCD150+CD9+.
Contrary to these spleen-specific mechanisms, sCFU-E expansion, both in regenerative erythropoiesis and in MPN, occurs in the marrow as well as the spleen. Because human stress erythropoietic response occurs in the marrow, expansion of sCFU-E may represent a more conserved mechanism. In this regard, sCFU-E cells may be similar to day 3 BFU-E cells observed after sublethal irradiation using colony assays.41 Although normal BFU-E colonies form on day 7 after seeding, Peslak et al41 showed that cells capable of generating BFU-E colonies on day 3 first expand in the marrow and subsequently migrate to the spleen after sublethal irradiation. Day 3 BFU-E cells are more mature than normal BFU-E cells, are Epo-responsive, and are consistent with sCFU-E cells being an intermediate population between immature (day 7) BFU-E and CFU-E cells.
The different modes and the diverse cellular entities and machineries highlight the complexity of regenerative erythropoiesis. Experimental anemia can be induced by different treatments such as phlebotomy, PHZ-induced hemolysis, irradiation, transplantation, or inflammation. This mirrors the diverse clinical conditions stress erythropoiesis is involved in, including cardiac or pulmonary syndromes, anemia of multiple causes, chemotherapy, and stem cell transplantation, or in diseases such as MPN. It is proposed that BMP4-mediated stress erythropoiesis is specific to situations involving inflammation.15 Whether different response methods are specific to different conditions and whether the contribution of sCFU-E expansion in anemia is induced by different means warrant further investigation.
Since the discovery of intermediate progenitors between BFU-E and CFU-E in 1978,31 their function has remained elusive. Our results and those of others suggest that these cells are heterogeneous, and different subpopulations are regulated specifically. For example, the more immature CD34+CD36+CD71medCD105med cells are expanded on glucocorticoid treatment in CD34+ cultures from patients with normal but not steroid-resistant Diamond-Blackfan anemia.32 However, oncogenic EpoR and JAK2 signaling drives the expansion of the more mature CD34+CD36+CD71hiCD105hi cells in MPN. Understanding mechanisms regulating the different subpopulations may inform erythroid biology and the development of optimal therapies for different disease states.
A role for IGF1 in expanding sCFU-E cells in stress erythropoiesis and erythrocytosis is consistent with prior findings that IGF1 stimulates the proliferation of erythroid progenitors.31,42,43 Moreover, erythroid progenitors in patients with MPN are known to be hypersensitive to IGF1,44-46 and combinations of JAK2 and IGF1R inhibitors show therapeutic efficacy in MPN mice.47 MPN develops in mice with poor ability to degrade the IGF1R because of deficiency of arsenite-inducible RNA-associated protein-like (AIRAPL).48 IGF1 levels decrease significantly with age, and low IGF1 levels are associated with anemia and anemia of aging.49-52
Molecularly, the linchpin connecting EpoR and IGF1R signaling pathways in promoting sCFU-E expansion is IRS2, an adaptor protein essential for IGF1R progrowth signaling. Epo induces IRS2 expression in sCFU-E via STAT5 activation, and potential gamma interferon-activated sites (GAS) were identified in Irs2 intron (data not shown). Both Epo and IGF1 can induce tyrosine phosphorylation on IRS2, and downstream PI3K and MAPK pathways also may regulate IRS2 phosphorylation and function.53-57 IRS2 also can translocate into the nucleus and forms complexes with upstream binding factor 1 to regulate ribosomal RNA synthesis58 or can bind to NF-κb and localize to the cyclin D promoter.59 Therefore, IRS2 may contribute to sCFU-E expansion and erythroid progenitor proliferation and differentiation via multiple mechanisms.
At this point, we do not know why several known STAT5 targets were not induced in sCFU-E cells. Target genes were examined 90 minutes after Epo induction, an early time point to avoid induction via indirect mechanisms. It is possible that some target genes may require longer induction time. Alternatively, differences in STAT5 binding resulting from variations in sequences at or around STAT5 binding sites, chromatin configuration, or the existence of nearby sites for coregulators, as well as the sCFU-E cellular milieu may affect target gene induction.60-62
Our study identified a new hematopoietic progenitor cell population induced to combat heightened erythroid demand in stress erythropoiesis. We showed that these cells can be hijacked to promote erythrocytosis in MPN. The lineage-restricted and stress-specific nature of sCFU-E cells may make them a safer and more ideal target for the treatment of anemia and erythrocytosis. It should be noted that in MPN, simultaneous targeting of JAK2(V617F)-expressing hematopoietic stem cells is necessary, but simultaneous targeting of expanded sCFU-E cells may allow for a lower hematopoietic stem cells-directed treatment to reduce the toxicity observed in current treatment regimens.
Acknowledgments
The authors thank Merav Socolovsky for sharing flow cytometry protocols, Harvey Lodish and James Palis for EpoR(core) and EpoR(core+Y343) mice, Ben Ebert and Ann Mullally for JAK2(V617F) knockin mice, and Cheryl Lewis for assisting with patient sample collection.
This study was supported by research funding from the National Heart, Lung, and Blood Institute (R01HL089966) to L.J.H., National Institute of Diabetes and Digestive and Kidney Diseases (R01DK111430) and National Cancer Institute (R01CA230631) to J.X., National Human Genome Research Institute (UM1HG011996) and National Cancer Institute (R01CA262781, R21CA259771, and P30CA142543) to L.X., National Cancer Institute (K08CA194275) to S.S.C., National Cancer Institute (P01CA108671) to R.K.R., Rally Foundation (L.X.), the Cancer Prevention Research Institute of Texas (RP180805 and RP200103 to L.X.; RR180046 to S.S.C.), American Society of Hematology (Junior Faculty Scholar Award to S.S.C.), Memorial Sloan Kettering Cancer Center (P30CA008748 to R.K.R.), and Harold C. Simmons Comprehensive Cancer Center (pilot translational grant to L.J.H.), and funds from Incyte, Constellation, Stemline, and Zentalis to R.K.R.
Authorship
Contribution: H.H., H.Y., Y.M., and L.J.H. designed the research. H.H., H.Y., Y.M., Y.Z., X.X., H.S., S.C.C., J.X., R.K.R., and L.J.H. performed research studies and analyzed data. Y.Z., X.X., N.W., L.X., and J.X. performed bioinformatics analyses. H.H. and L.J.H. wrote the manuscript with input from all authors.
Conflict-of-interest disclosure: R.K.R. has received consulting fees from Constellation, Incyte, Celgene/BMS, Novartis, Promedior, CTI, Jazz Pharmaceuticals, Blueprint, Stemline, Galecto, Pharmaessentia, Abbvie, Sierra Oncology, and Disc Medicines. The remaining authors declare no competing financial interests.
Correspondence: Lily Huang, Department of Cell Biology, University of Texas Southwestern Medical Center, Dallas, TX 75390-9039; e-mail: lily.huang@utsouthwestern.edu.
References
Author notes
∗H.H. and H.Y. contributed equally to this study.
Data and protocols will be shared upon request to the corresponding author.
The online version of this article contains a data supplement.
The publication costs of this article were defrayed in part by page charge payment. Therefore, and solely to indicate this fact, this article is hereby marked “advertisement” in accordance with 18 USC section 1734.



![STAT5 signaling is essential for sCFU-E growth. (A) Proliferation increases in sCFU-E cells after phlebotomy. (B) Apoptosis decreases in sCFU-E cells after phlebotomy. In (A) and (B), sCFU-E cells from freshly isolated bone marrow were gated for analyses. (C) Inhibitors to STAT5 abolish sCFU-E growth. Sorted BFU-E and sCFU-E cells are cultured in 10 μM of inhibitors or vehicle control (dimethyl sulfoxide [DMSO]) and analyzed after 48 hours. Phosphate-buffered saline (PBS)-treated samples also are shown as controls. (D) Diagrams of EpoR(core) and EpoR(core+Y343). (E) Y343 in EpoR rescues STAT5 binding and sCFU-E expansion in EpoR(core+Y343) mice. Data represent the mean ± SD. BrdU, bromodeoxyuridine; Phleb., phlebotomized. ∗P < .05; ∗∗P < .01, Student’s t test or 2-way ANOVA.](https://ash.silverchair-cdn.com/ash/content_public/journal/blood/140/22/10.1182_blood.2022016741/5/m_blood_bld-2022-016741-gr4.jpeg?Expires=1765675331&Signature=FDPwVNWxbhpDbKdKHfBg5luusZ61LHdImDa-tmaEEXti5ekJuIAqCQNAoZY6Sts~~uiG8mrY~kCIL~Z51KcI2~IXWddQ5wzrxmsW7RgCZBlvgJ4UdF7erN8g56lw6Ws6~sA86RPTKFLu--gnF3GRyJJVlR7OcG43uDkLZHfviZcDeyDEf2gXHRq~nRDk-zFZ~y-LUlMHOIbHMiFspEf5F1p91ja71yXeMVSo5IMMPPwuhnaibtMWkYRLVd~enK28yNGqlzM8OixYFb1g0fJlZ34K3X5k95bv7-nur6ZUA8KZHKq55AAxj8-LEknDl6kfdk8~LRyxBXQfLrPtBvqEwg__&Key-Pair-Id=APKAIE5G5CRDK6RD3PGA)


![STAT5 signaling is essential for sCFU-E growth. (A) Proliferation increases in sCFU-E cells after phlebotomy. (B) Apoptosis decreases in sCFU-E cells after phlebotomy. In (A) and (B), sCFU-E cells from freshly isolated bone marrow were gated for analyses. (C) Inhibitors to STAT5 abolish sCFU-E growth. Sorted BFU-E and sCFU-E cells are cultured in 10 μM of inhibitors or vehicle control (dimethyl sulfoxide [DMSO]) and analyzed after 48 hours. Phosphate-buffered saline (PBS)-treated samples also are shown as controls. (D) Diagrams of EpoR(core) and EpoR(core+Y343). (E) Y343 in EpoR rescues STAT5 binding and sCFU-E expansion in EpoR(core+Y343) mice. Data represent the mean ± SD. BrdU, bromodeoxyuridine; Phleb., phlebotomized. ∗P < .05; ∗∗P < .01, Student’s t test or 2-way ANOVA.](https://ash.silverchair-cdn.com/ash/content_public/journal/blood/140/22/10.1182_blood.2022016741/5/m_blood_bld-2022-016741-gr4.jpeg?Expires=1765675332&Signature=5KrKVVSGFdiaJX2-LoeLjc1WHzaOTPWbA-YaBCP2SwKzi7JNEZe6Tb5fwDijXh2zbk1VaUdXbRlx4SAuheUa5spvInPKjSfPBiFdiedOLJekzduuUnkZ0~xgVDxnd012IHUPIIkSonx~NGwYF6JicEAKLbvuqgn1wwGtx6I38Dbt-3j~Yr~xURQrt~qEJQAFeKyi1bsW0Yh7vX3JT5Rez7lOlwghVQThX7LKLSrosjFClLHTvvrBR15qNnhyLCKMjjVoGiX9ORwXP0GcTqLxsJvl6l~x~LP99CxSxy2tSjm7-QxKO2ZMzLcTzuqgunqIyBv13~rAH~MVtqHitotitw__&Key-Pair-Id=APKAIE5G5CRDK6RD3PGA)

