Key Points
Robust subtypes of DLBCL are identified by model-based clustering of genetic mutations in a large (n = 928) population-based cohort.
With full follow-up data available for all sequenced patients, the prognostic significance of these subtypes is identified.

Abstract
Based on the profile of genetic alterations occurring in tumor samples from selected diffuse large B-cell lymphoma (DLBCL) patients, 2 recent whole-exome sequencing studies proposed partially overlapping classification systems. Using clustering techniques applied to targeted sequencing data derived from a large unselected population-based patient cohort with full clinical follow-up (n = 928), we investigated whether molecular subtypes can be robustly identified using methods potentially applicable in routine clinical practice. DNA extracted from DLBCL tumors diagnosed in patients residing in a catchment population of ∼4 million (14 centers) were sequenced with a targeted 293-gene hematological-malignancy panel. Bernoulli mixture-model clustering was applied and the resulting subtypes analyzed in relation to their clinical characteristics and outcomes. Five molecular subtypes were resolved, termed MYD88, BCL2, SOCS1/SGK1, TET2/SGK1, and NOTCH2, along with an unclassified group. The subtypes characterized by genetic alterations of BCL2, NOTCH2, and MYD88 recapitulated recent studies showing good, intermediate, and poor prognosis, respectively. The SOCS1/SGK1 subtype showed biological overlap with primary mediastinal B-cell lymphoma and conferred excellent prognosis. Although not identified as a distinct cluster, NOTCH1 mutation was associated with poor prognosis. The impact of TP53 mutation varied with genomic subtypes, conferring no effect in the NOTCH2 subtype and poor prognosis in the MYD88 subtype. Our findings confirm the existence of molecular subtypes of DLBCL, providing evidence that genomic tests have prognostic significance in non-selected DLBCL patients. The identification of both good and poor risk subtypes in patients treated with R-CHOP (rituximab, cyclophosphamide, doxorubicin, vincristine, and prednisone) clearly show the clinical value of the approach, confirming the need for a consensus classification.
Introduction
Diffuse large B-cell lymphoma (DLBCL) is the most common non-Hodgkin lymphoma.1-3 Although potentially curable with immunochemotherapy, refractory or relapsed lymphoma occurs in ∼40% of patients. Despite the substantial increase in biological understanding in recent years, attempts to improve survival by combining standard therapy with novel targeted agents have thus far yielded disappointing results, with no phase 3 trial leading to a change in the accepted standard of care since the addition of rituximab to cyclophosphamide, doxorubicin, vincristine, and prednisone (R-CHOP) chemotherapy in 2002.4 One barrier to the effective use of novel therapies targeting specific pathways is the biological heterogeneity of DLBCL and the likely existence of multiple distinct disease subtypes. Hence, to permit more accurate targeting in clinical trials, it is becoming increasingly important to define these subtypes, permitting stratification that separates patients likely to achieve cure with R-CHOP alone from high-risk groups that may benefit from emerging therapies.
Gene expression profiling distinguishes transcriptional subtypes of DLBCL, including activated B-cell–like (ABC) and germinal center B-cell–like (GCB) in the cell-of-origin classification, and more recently, molecular high-grade (MHG).5-8 Genomic studies have reported additional heterogeneity9-15 ; the 3 latest used whole-exome sequencing to describe molecular subtypes based on the profile of genetic alterations within each tumor.16-18 Two of these studies proposed partially overlapping classifications16,17 ; these converging conclusions suggest the existence of convincing molecular subtypes with distinct biology and the potential to guide therapeutic targeting.
However, several questions remain before a consensus classification can be implemented in clinical practice. The first relates to robustness, because it is unclear how variation introduced by different sequencing platforms, variant calling algorithms, biopsy material, and methods of statistical analysis affect the ability to resolve genetic subtypes. The second relates to the practicalities of implementing a classification in a real-world setting: the ability to resolve genetic subtypes using panel-based sequencing on DNA from both fresh and formalin-fixed, paraffin-embedded (FFPE) material. Finally, studies conducted to date have been largely based on specimens and data from clinical trials and specialist referral center archives, potentially limiting the generalizability of findings to the patient population as a whole.
Established with the aim of addressing such questions, the current report describes results from a genomics study embedded within a contemporary UK “real-world” population-based patient cohort. All diagnoses in the catchment population of ∼4 million (14 hospitals) are centrally made at a specialized hematological oncology reference laboratory.19 Using surplus material archived at the time of diagnosis, 4244 lymphoid and myeloid tumor samples have now been sequenced and assessed for somatic mutations against a pan-hematological malignancy panel of 293 genes; the findings for 928 patients diagnosed with DLBCL are reported here.
Materials and methods
Patients and procedures
Data are from the UK population-based Haematological Malignancy Research Network (HMRN; https://www.hmrn.org).19 Initiated in 2004, all diagnoses within HMRN’s boundaries are made and coded by clinical specialists at a single integrated hematopathology laboratory, the Haematological Malignancy Diagnostic Service (www.HMDS.info). Full details of HMRN’s methods and ethical approvals have been published elsewhere; ethical approval for HMRN was granted under REC reference 04/Q1205/69 and for the genetic sequencing under 14/WS/0098.19,20 In brief, covering 14 hospitals and tracking all patients with hematological malignancies (∼2400 per year) through clinical and national administrative systems (mortality and morbidity), HMRN’s patient cohort operates under a legal basis that permits full treatment and outcome data to be collected from clinical records without explicit consent. The study cohort for the current report comprised 2358 subjects newly diagnosed with DLBCL between 1 September 2004 and 31 August 2012 with International Classification of Diseases for Oncology, Third Edition, codes 9679, 9680, 9688, 9712, and 9735. Of these patients, 928 (39.4%) had suitable diagnostic material for genetic analysis (supplemental Figure 1, available on the Blood Web site). All patients were followed up for mortality until 31 December 2018.
DNA sequencing
DNA was extracted from surplus FFPE material archived at the time of diagnostic biopsy using the Qiagen QIAamp DNA FFPE tissue kit (catalog no. 51306). For each sample, 50 to 200 ng of genomic DNA was sheared by using a Covaris LE220 focused ultrasonicator (Covaris) to produce 100 to 200 bp fragments. Indexed libraries were generated by using a modified version of the SureSelect XT protocol (Agilent Technologies), pooled (16-plex), and captured with a bespoke set of 120 nt biotinylated RNA baits (Agilent Technologies); this approach covered 293 genes implicated in hematological malignancy (supplemental Table 1) using the SureDesign interface (Agilent Technologies) on default parameters (all coding exons of all genes targeted with 10 flanking bases at 3′ and 5′ end of each exon). Capture libraries were quantified, assessed for size distribution and quality, and sequenced on Illumina HiSeq 2500 instruments using 75 base paired-end sequencing according to the manufacturer’s instructions. The average read depth across all samples was 500× reads per base. Full details of sequencing, variant calling, and annotation are provided in the supplemental Methods (section 2.1). Single nucleotide variants and copy number variants are detailed in supplemental Tables 2 and 3.
Statistical analysis
A total of 117 genetic features occurred in at least 1% of patients; these features defined binary variables denoting 105 mutations, 4 amplifications, and 8 markers indicating presence of either a homozygous deletion or mutation (supplemental Table 1). These 117 binary variables were used to identify subgroups of patients with similar genetic characteristics. Genetic features found in <1% of cases were not used for clustering.
To identify these genetic subgroups, the data were modeled as a finite mixture of Bernoulli distributions, providing a data-driven probabilistic interpretation of group membership strength.21 The number of identifiable clusters was selected by using the Akaike Information Criterion (AIC) likelihood penalization method.
Three additional techniques were used to assess cluster strength and stability. First, the Integrated Completed Likelihood (ICL)22 was used to determine cluster number; second, cluster stability under repeated resampling was investigated by consensus clustering23 ; and third, the clustering process was restricted to the homogeneous group of de novo DLBCL not otherwise specified (NOS) patients treated with R-CHOP (n = 579). Full details of this sensitivity analysis are presented in the supplemental Methods (sections 2.2-2.4).
Survival analysis was conducted by using the Kaplan-Meier estimator and proportional hazards regression, with all patients followed up for mortality until 31 December 2018. Analyses were conducted in Stata 15.124 and R 3.5.3,25 using the libraries flexmix21 and survival.26 Gene expression profiling was available for a subset of cases from a previous analysis, in which full details of the methods are provided.7,8 Gene Set Enrichment Analysis was run using software developed by the Broad Institute.27,28 Pearson’s χ2 test was used for assessing differences in proportions, with the Benjamini-Hochberg adjustment for multiple comparisons. The data used in this study are presented in supplemental Tables 4 and 6; the R-code is available on Github, at: https://github.com/ecsg-uoy/DLBCLGenomicSubtyping.
Results
Genetic substructure of DLBCL
Demographic and clinical characteristics of the study cohort (N = 2358) and analysis cohort (n = 928) are summarized in Table 1. Although broadly similar to the study cohort as a whole, those with archived material of sufficient quality for next-generation sequencing (analysis cohort) were, on average, slightly younger (median diagnostic age 68.5 vs 70.0 years), were more likely to have localized disease (eg, 33% vs 30.5% stage I/II disease), and were more likely to have been treated with curative intent (86.5% vs 81.8%).
Individual biopsy samples were associated with a median of 7 driver mutations (supplemental Figure 2). In 49 patients (5.3%), no genetic abnormality was detected. Genetic alterations stratified according to cell of origin confirmed that when applied to FFPE material, our sequencing platform and variant calling strategy identified mutational profiles in close agreement with previous studies (supplemental Figure 2).16-18
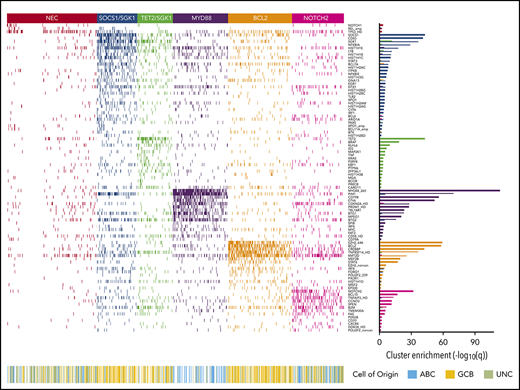
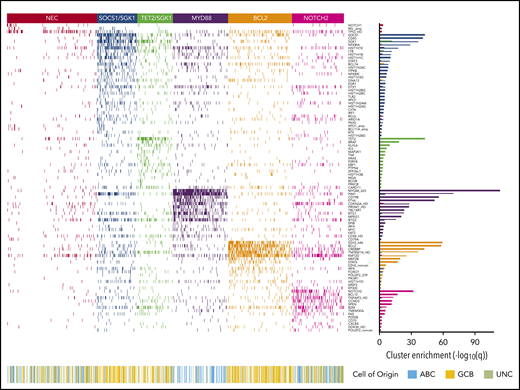
Applying the Akaike Information Criterion to determine optimal cluster number, 5 genomic clusters were identified. These were named MYD88, BCL2, TET2/SGK1, SOCS1/SGK1, and NOTCH2, according to the genetic features most enriched in each cluster, leaving 27% of patients as “not elsewhere classified” (NEC) (Figure 1). Information on the genetic clusters identified using the integrated completed likelihood criterion and an assessment of cluster stability by consensus clustering are presented in the supplemental Methods (sections 2.2 and 2.3; supplemental Figures 3-7; supplemental Table 5).

Heat map of characteristic mutations from each of the 6 genetic clusters that were identified by using the Akaike information criterion in the analysis cohort (n = 928). Distinct clusters are identified by color. Along the bottom of the figure, the color strip shows the corresponding cell-of-origin classification for each patient. The panel on the right-hand side shows the enrichment for mutations within each cluster, with a logarithmic q-value scale. Only those mutations are shown that are identified as significantly enriched for the given group, as determined by a Benjamini-Hochberg adjusted q < 0.05 from a χ2 test of independence. “HD” indicates the homozygous deletion or a mutation in this gene; “noncan” denotes a non-canonical mutation; and “amp” indicates an amplification. For cell-of-origin, UNC represents the unclassified group.
Heat map of characteristic mutations from each of the 6 genetic clusters that were identified by using the Akaike information criterion in the analysis cohort (n = 928). Distinct clusters are identified by color. Along the bottom of the figure, the color strip shows the corresponding cell-of-origin classification for each patient. The panel on the right-hand side shows the enrichment for mutations within each cluster, with a logarithmic q-value scale. Only those mutations are shown that are identified as significantly enriched for the given group, as determined by a Benjamini-Hochberg adjusted q < 0.05 from a χ2 test of independence. “HD” indicates the homozygous deletion or a mutation in this gene; “noncan” denotes a non-canonical mutation; and “amp” indicates an amplification. For cell-of-origin, UNC represents the unclassified group.
The MYD88 cluster (n = 152) was dominated by mutation of MYD88 (L265P), PIM1, CD79B, and ETV6 and frequent loss of CDKN2A; the available gene expression data showed that most belonged to the ABC subtype, with enrichment for signatures associated with ABC-DLBCL, IRF4, and MYC (Figure 2). To assess biological features of DLBCL independent of anatomic site of presentation, we included special site DLBCL in our primary clustering. However, very similar results were observed when such cases were excluded and clustering restricted to DLBCL NOS (supplemental Figure 8). The majority of primary central nervous system lymphomas (PCNSL), along with primary testicular and those with breast involvement, clustered within this group (Table 2). This cluster strongly recapitulates the recently described MCD16 and C517 subtypes.
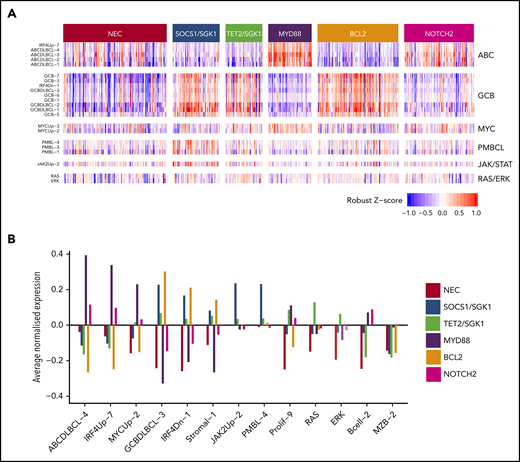
Relations between gene expression profiling and the 6 genetic clusters that were identified by using the Akaike information criterion for the 519 subjects with available gene expression profiling data. (A) Heat map of a selection of signatures. (B) Highlights of a small number of these that exhibit the strongest trends.
Relations between gene expression profiling and the 6 genetic clusters that were identified by using the Akaike information criterion for the 519 subjects with available gene expression profiling data. (A) Heat map of a selection of signatures. (B) Highlights of a small number of these that exhibit the strongest trends.
The BCL2 cluster (n = 176) showed frequent mutation of EZH2, BCL2, CREBBP, TNFRSF14, KMT2D, and MEF2B. The majority of cases for whom fluorescence in situ hybridization (FISH) was available (82 of 92) had a t(14:18) BCL2 translocation, and mutation of BCL2 was strongly correlated with this translocation (P < .0001). Gene expression revealed a predominance of GCB-DLBCL but also enrichment for MHG DLBCL (Table 2; Figure 2). Most cases of transformed follicular lymphoma fell within this cluster, robustly mapping to the previously described EZB and C3 clusters.16,17
The SOCS1/SGK1 group (n = 111) was characterized by mutations, including SOCS1, CD83, SGK1, NFKBIA, HIST1H1E, and STAT3. Several of these genes, including SOCS1, were known targets of aberrant somatic hypermutation. This cluster seems to represent a subdivision of the recently described C4 cluster.17
SOCS1 mutation is a finding shared with primary mediastinal B-cell lymphoma (PMBCL). The inclusion of cases diagnosed as PMBCL in our clustering allowed the demonstration that 12 of 20 PMCBL cases clustered in this group along with 98 DLBCL NOS cases. The latter cases in this cluster showed no pathological features of PMBCL and were not enriched for mediastinal involvement (supplemental Figure 9). Gene expression profiling showed that DLBCL NOS cases in this group were predominantly of GCB origin and enriched for signatures associated with PMBCL and JAK/STAT signaling, suggesting a degree of biological similarity to PMBCL29 (Figure 2). Enrichment was also seen for other genes previously noted to be enriched in PMBCL, including ITPKB, NFKBIE, and CIITA.30 These results suggest that PMBCL, a lymphoma with a unique anatomic location, shares significant molecular overlap with a subset of otherwise nodal DLBCL, supporting a previous description of non-mediastinal DLBCL tumors that share biological similarity to PMBCL.29 This also recapitulates the findings observed for the relation between PCNSL, primary testicular and primary breast DLCBL, and the MYD88 group of DLCBL NOS, supporting a more general overlap between special site lymphomas and specific molecular subsets of DLBCL NOS.
The TET2/SGK1 (n = 98) cluster was characterized by mutations including TET2, SGK1, KLHL6, ZFP36L1, BRAF, MAP2K1, and KRAS. The mutation of multiple components of the ERK pathway was associated with enrichment of gene expression signatures of RAS and ERK (Figure 2). Predominantly GCB in origin, these cases seem to represent a second subdivision of the recently described C4 cluster.17
A final NOTCH2 cluster (n = 143) was characterized by mutations including NOTCH2, BCL10, TNFAIP3, CCND3, SPEN, TMEM30A FAS, and CD70. Our targeted panel did not capture BCL6 fusion status, although BCL6 rearrangement by using FISH, where available (317 of 928), confirmed a strong correlation with NOTCH2 mutation (P < .0001). Gene expression showed that this cluster comprised a mixture of ABC, GCB, and unclassified DLBCL (Table 2). Enhanced NOTCH activity was not detected by gene expression, nor could we detect transcriptional evidence of increased NOTCH activity when restricting analysis to patients with NOTCH2 mutation. The mutational similarities suggest biological similarity to marginal zone lymphoma; a preexisting diagnosis of marginal zone lymphoma was noted only in 3 patients. This group corresponds closely to the previously described BN216 or C117 subtypes.
Validation of our clustering strategy on an external data set
To further explore the relation of clusters defined in our data sets to those of other cohorts recently defined, we took advantage of published data from Chapuy et al.17 We considered this from 2 angles: first, by applying our Bernoulli clustering approach to their total data set; and second, by restricting analysis to the features in common between our data set and theirs. With respect to the former, our algorithm identified 6 clusters, largely recapitulating those published by Chapuy et al (supplemental Figure 10). Genetic features enriched within these clusters closely matched those enriched in the data of Chapuy et al, as well as those enriched in clusters within our patient cohort (supplemental Table 7). However, we were not able to resolve a division of the SGK1 subgroup, which in our cohort splits into SOCS1/SGK1 and TET2/SGK1 subgroups, a finding likely to be explained by the lack of SOCS1 and TET2 mutation calls in the data of Chapuy et al. Restricting the analysis to the 60 overlapping genetic features reproduced 5 of the original subgroups but led to loss of the cluster defined by TP53 mutation and copy number alteration (CNA), which corresponded to the C2 cluster of Chapuy et al (supplemental Figure 11). These cases were instead predominantly reassigned to the unclassified group (56%) and the BCL2 group (22.7%). Taken together, these findings confirm that our clustering approach is robust across data sets and that the absence of a TP53 cluster in our own cohort relates to limited copy number information available from our panel; the majority of cases likely to remain unclassified or allocated to the BCL2 group.
Genomic subtype and patient outcome
Five-year overall survival (OS) estimates for all patients (n = 928) and those treated with R-CHOP (n = 648) are presented at the bottom of Table 2. For all patients, analyses revealed especially poor outcome for patients in the MYD88 cluster, with 5-year OS of 42% (34.9-50.7). In contrast, patients within the SOCS1/SGK1, BCL2, and TET2/SGK1 clusters fared better than patients in the MYD88 group, with 5-year OS of 64.9% (56.6-74.4), 62.5% (55.7-70.1), and 60.1% (51.1-70.6), respectively (P < 10−3 for each group compared with MYD88). NEC and NOTCH2 clusters had intermediate survival: 5-year OS of 53.6% (47.7-60.2) and 48.1% (40.5-57.0) (P = .008, .063 compared with MYD88).
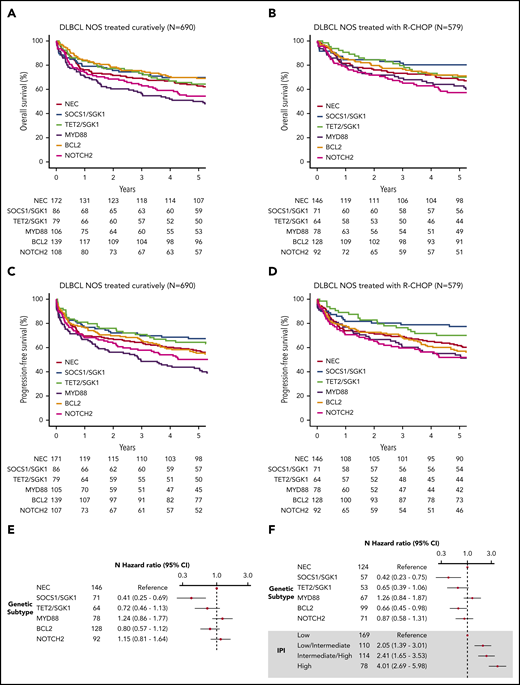
To examine survival in a more homogeneous patient cohort, we restricted our analysis to patients with de novo DLBCL NOS treated with curative intent (n = 690). Similar survival trends were observed, with the poorest outcome seen among the MYD88 subgroup (Figure 3A-B; supplemental Figure 12). Because some of these patients were treated with attenuated regimens that might be considered “R-CHOP–like,” we repeated the analysis on the 579 patients with de novo DLBCL treated with R-CHOP (Figure 3C-D, supplemental Figure 12). Especially good survival was seen in SOCS1/SGK1 (n = 84), in which 5-year OS was 80.2% (71.5-90.1). However, the apparently negative prognostic impact of MYD88 cluster membership (n = 78) was reduced, increasing the OS estimate of this subgroup to 62.8% (53.0-74.5); although not statistically significant (P = .1), this intriguing result suggests a specific sensitivity of the MYD88 subtype to either patient-intrinsic or treatment-related factors that may partially explain previous controversy regarding its prognostic implication.31

Survival in clusters identified by using the Akaike information criterion. (A) OS of the 690 patients treated with curative intent stratified according to cluster. (B) OS of the 579 de novo DLBCL NOS patients treated using R-CHOP, stratified according to cluster. (C) Progression-free survival of the 690 patients treated with curative intent stratified according to cluster. (D) Progression-free survival of the 579 de novo DLBCL NOS patients treated by using R-CHOP, stratified according to cluster. (E) Crude hazard ratios of cluster membership for the 579 de novo DLBCL NOS R-CHOP–treated patients. (F) Adjusted hazard ratios of the subset of the group of 579 patients with IPI data available (n = 499). CI, confidence interval.
Survival in clusters identified by using the Akaike information criterion. (A) OS of the 690 patients treated with curative intent stratified according to cluster. (B) OS of the 579 de novo DLBCL NOS patients treated using R-CHOP, stratified according to cluster. (C) Progression-free survival of the 690 patients treated with curative intent stratified according to cluster. (D) Progression-free survival of the 579 de novo DLBCL NOS patients treated by using R-CHOP, stratified according to cluster. (E) Crude hazard ratios of cluster membership for the 579 de novo DLBCL NOS R-CHOP–treated patients. (F) Adjusted hazard ratios of the subset of the group of 579 patients with IPI data available (n = 499). CI, confidence interval.
Inspection of clinical risk factors revealed variation across the molecular cluster; the NOTCH2 group was associated with the greatest number of patients with high-intermediate and high International Prognostic Index (IPI) scores (supplemental Figure 13). Figure 3 presents the IPI-adjusted hazard ratios for each molecular subtype, confirming inferior survival estimates in the MYD88 subtype, a neutral effect of NOTCH2, and enhanced survival in the TET2/SGK1, SOCS1/SGK1, and BCL2 groups.
Although our clustering algorithm did not resolve a distinct NOTCH1 cluster, the majority of NOTCH1 mutant cases were found within the unclassified NEC group, suggesting they may represent a distinct subtype too small to be detected by our modeling strategy. Indeed, the presence of NOTCH1 mutation (n = 16) conferred an especially poor outcome, with a 5-year OS of 39% (NOTCH1 mutant vs wild type, P = .004) (Figure 4A).
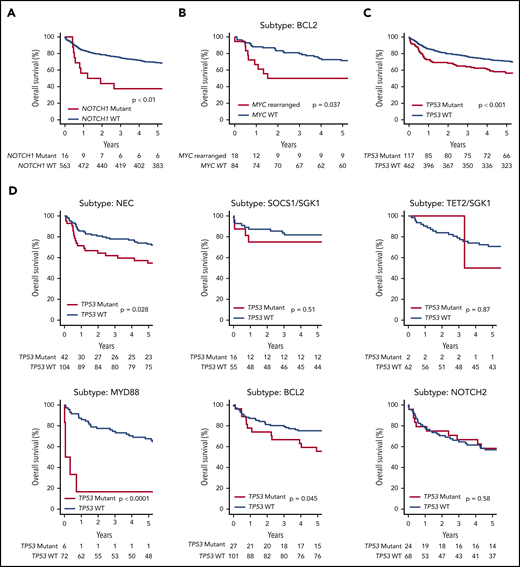
OS of the de novo DLBCL NOS R-CHOP–treated patients (n = 579), stratified according to a selection of genetic features. (A) NOTCH1 mutation. (B) MYC rearrangement status in the subset of patients belonging to the BCL2 Akaike information criterion subtype. (C) TP53 mutation or homozygous deletion. (D) The effect of TP53 mutation or homozygous deletion in each genetic subtype.
OS of the de novo DLBCL NOS R-CHOP–treated patients (n = 579), stratified according to a selection of genetic features. (A) NOTCH1 mutation. (B) MYC rearrangement status in the subset of patients belonging to the BCL2 Akaike information criterion subtype. (C) TP53 mutation or homozygous deletion. (D) The effect of TP53 mutation or homozygous deletion in each genetic subtype.
MYC rearrangement was most enriched within the BCL2 cluster (supplemental Figure 13), conferring poor prognosis in R-CHOP–treated patients, 5-year OS 50.0% (31.5-79.4), compared vs patients without MYC rearrangement, who had 71% OS (62.4-81.8) (Figure 4B). Similarly, most cases of double-hit lymphoma and MHG were found in the BCL2 cluster, where both conferred a poor prognosis in R-CHOP–treated patients: 5-year OS 43.8% (25.1, 76.3) and 44.4% (21.4, 92.3), respectively. There were insufficient numbers of events to determine the effect of MYC rearrangement, double hit lymphoma, or MHG in other clusters (supplemental Figure 13). Also strongly enriched within the BCL2 cluster were cases of transformed follicular lymphoma and cases of DLBCL with a concurrent diagnosis of follicular lymphoma detected based on results of the diagnostic biopsy. Although patients with transformed follicular lymphoma had inferior survival estimates, in the BCL2 cluster, no differences in survival between DLBCL with/without a concurrent diagnosis of follicular lymphoma was observed. This finding agrees with a recent study by Wang et al32 (supplemental Figure 14).
As noted earlier, we did not identify a distinct TP53/CNA cluster in our cohort. The potential for other clusters, in particular the BCL2 subgroup, to contain cases that might otherwise have been classified to a TP53 cluster prompted us to examine survival of each cluster stratified according to TP53 mutation status. Remarkably, the prognostic impact of TP53 mutation (Figure 4C) varied considerably across the different molecular subtypes (Figure 4D). TP53 mutation was associated with a worse prognosis in the NEC and BCL2 subtypes and, although uncommon, TP53 mutation conferred an extremely poor prognosis in the MYD88 cluster. In contrast, there was no evidence of a prognostic effect in patients within the NOTCH2 or SOCS1/SGK1 clusters, and was rarely detected in the TET2/SGK1 cluster. This finding suggests that in addition to its presence in a TP53-mutant cluster, TP53 mutation may also be acquired by tumors belonging to other subgroups and that in this scenario its prognostic effect is subtype dependent.
Discussion
Based on the genomic profile of individual tumors, our large population-based study defined 5 molecular DLBCL subtypes, named MYD88, BCL2, SOCS1/SGK1, TET2/SGK1, and NOTCH2, with each having distinct features in terms of both their biology and clinical outcome. With prospective tracking of treatment and outcome in 928 patients with DLBCL (trial and nontrial) diagnosed by specialist staff at a single laboratory, we escape the biases that may result from sequencing archived biopsy collections established from the selective referral of clinically or diagnostically challenging cases to specialist pathology centers. Indeed, the only determinant of whether patients were included in the analysis cohort was the availability of sufficient sample for the extraction of adequate DNA. This unselected cohort therefore provides a unique representation of real-world DLBCL that may not have been captured in previous molecular subtyping studies. We have not restricted the cluster analysis to any particular subtype of DLBCL, considering an a priori approach to the evolving classification of these possibly heterogeneous disease types a particular strength of this study.
Considerable variability in genomic subtype identification can be introduced by differences in biopsy type, sequencing strategy, variant calling pipeline, driver annotation algorithms, and the statistical method used to identify genomic clusters. It remained uncertain whether the genomic clusters described in recent studies represented sufficiently robust entities to be resolved against variation in each of the aforementioned factors. We used alternative, but widely accepted, pipelines for variant and driver annotation and different approaches to the identification of genomic clusters. Despite these considerable differences, we have independently converged on very similar genomic subtypes. Indeed, when comparing enriched mutations between equivalent clusters across studies, we observe a very high degree of overlap. Therefore, our data strongly support the conclusion that DLBCL exists as molecularly distinct subtypes that are resolvable through genomic analysis. Importantly, we were able to identify these subtypes by using a targeted sequencing panel applied to biopsy material, a strategy that would be applicable to a nonacademic diagnostic laboratory.
The lack of BCL6 fusion data is a limitation of our study. However, available FISH data confirmed the association between NOTCH2 mutation and rearrangement of BCL6. Furthermore, even in the absence of BCL6 fusion data, we were able to identify a NOTCH2 subtype that shows mutation enrichment similar to the previously identified BN2/C116,17 clusters. Our study was also limited by the extent of copy number data available from our panel. As such, we did not resolve a subgroup mapping to the C2 cluster of Chapuy et al.17 The application of our clustering algorithm to the data of Chapuy et al, applying all or just overlapping genetic features, supports the existence of this subtype and the requirement for adequate copy number information for its detection. Future sequencing panels designed to assign DLBCL molecular subtype will likely include probes that target regions of recurrent copy number variability. The existence of a TP53/CNA cluster is further supported by the finding that the majority (56%) of these cases were not alternatively classified but rather assigned to an unclassified NEC group according to our cluster algorithm (supplemental Figure 11). However, 23% of the TP53/CNA cases carried a mutational profile that, in the absence of copy number data, reassigns them to the BCL2 cluster. This leads us to hypothesize that TP53 mutation and associated CNAs may arise in 2 different contexts: either as the primary determinant of a distinct disease subtype or alternatively as a secondary event in a tumor arising from one of the other subgroups, most commonly the BCL2 cluster.
A novel finding in our study was the division of the previously identified SGK1 cluster17 into SOCS1/SGK1 and TET2/SGK1 subgroups, the biological validity of which was supported by the enrichment of JAK/STAT and ERK gene expression signatures, respectively. Driver mutations of TET2 and SOCS1 were not reported in the earlier study,17 which impaired the ability of our clustering algorithm to resolve this split within the data of Chapuy et al. These differences in mutation calling, likely due to differences in variant and driver annotation strategies, highlight some of the challenges to be overcome when implementing a consensus classification system. Interestingly, our SOCS1/SGK1 subtype shared both mutation and gene expression profile similarities with PMBCL, supporting a previous description of non-mediastinal DLBCL tumors that share biological similarity with PMBCL.29 This analysis also has parallels with other subsets of special site lymphomas, including PCNSL and those occurring de novo in testis and breast, which overlap with the MYD88 subgroup; this finding highlights a recurrent link between special site and nodal DLBCL NOS across several molecular subsets.
Prospective clinical data on all cases (supplemental Table 4) provided greater insight into the prognostic impact of clusters, revealing how survival of MYD88 clustered patients was especially sensitive to either patient-intrinsic or treatment-related characteristics. This difference in outcome when analysis of MYD88 patients is restricted to those treated with full R-CHOP vs other R-CHOP–like regimens may explain some of the controversy around the prognostic impact of this group.31 Multivariate analysis allowed us to quantify the relative risk of individual subtypes independent of IPI factors, an analysis that reinforced the importance of clinical risk factors in determining prognosis. Most notably, we have revealed the extremely favorable outcome of patients in the SOCS1/SGK1 subtype, suggesting this group might be the subject of future trials examining de-escalation of therapy.
The large size of our cohort allowed us to examine the impact of individual factors within clusters. Of particular interest, we were able to comment on the survival of patients in the BCL2 cluster with and without concurrent follicular lymphoma according to results of the diagnostic biopsy. The similarity of survival in response to R-CHOP mirrors that recently reported32 and leads us to hypothesize that DLBCL with concurrent follicular lymphoma may represent an entity that is biologically and clinically indistinguishable from other DLBCL patients clustered into the BCL2 subgroup, with the finding of concurrent follicular lymphoma dependent solely on the region of tumor captured by the biopsy finding. Conversely, transformed follicular lymphoma was associated with inferior survival, consistent with this form representing a distinct clinical entity.
Individual genetic features allowed us to identify other high-risk groups. Although we did not identify a distinct NOTCH1 cluster, the predominance of NOTCH1 mutant cases within the NEC group and their especially poor outcome support the concept that these patients should be considered separately in clinical practice. Many (27 of 66) translocated lymphomas, and the majority (21 of 38) of double-hit lymphomas, were classified into the BCL2 cluster, allowing very good and poor risk subgroups to be resolved from this cluster. Finally, we observe intriguing variation of the impact of TP53 mutation across clusters with no detectable effect in the NOTCH2 group, contrasting with the dismal prognosis conferred in the MYD88 cluster. Overall, this suggests that individual prognostic information may ultimately be best tailored to patients through the combined use of genomic cluster and individual gene data.
This study is the first to analyze the genetic structure of DLBCL by using a large unselected population-based register of patients with full clinical follow-up. Our findings substantiate the conclusions of recent studies by confirming the existence of reproducible molecular subtypes of DLBCL defined by their profile of genomic alterations. We show that genetic subtypes can be resolved by using a targeted sequencing panel applied to biopsy material acquired in routine clinical practice. We refined the molecular classification further to identify a new, very good risk subtype that shares biological features of PMBCL. We also provide greater insight into the prognostic impact of the genomic subtypes and their interaction with other genetic and clinical factors. Together with previous studies, these findings suggest that the field is ready for a concerted effort to standardize the molecular subclassification of DLBCL. Stratification according to molecular subtype will guide the design and interpretation of future clinical trials in DLBCL.
The online version of this article contains a data supplement.
The publication costs of this article were defrayed in part by page charge payment. Therefore, and solely to indicate this fact, this article is hereby marked “advertisement” in accordance with 18 USC section 1734.
Acknowledgments
Bloodwise (grant 15037) funded the majority of this study. Genetic sequencing was funded by 14M Genomics, a start-up company that ceased trading February 2016. Bloodwise had no role in the design of the study, data collection, data analysis, data interpretation, or writing of the report. 14M Genomics was involved in the design of the pan-hematological gene panel but took no further part in the study. D.J.H. was funded by a clinician scientist fellowship from the Medical Research Council (MRC) and receives core funding from Wellcome and MRC to the Wellcome–MRC Cambridge Stem Cell Institute. Some of the analysis in this study was performed on the “Viking” high-performance computing cluster at the University of York.
Authorship
Contribution: S.L.B., P.A.B., D.P., A.G.S., E.R., P.J.C., R.M.T., R.P., C.B., and S.C. contributed to conception and design; S.L.B., P.A.B., D.P., A.G.S., E.R., S.L.C., P.G., S.J.L.V.H., N.W., P.J.C., R.P., C.B., and S.C. provided study material or patients; all authors participated in the collection and assembly of data; S.E.L., S.L.B., P.A.B., D.P., A.G.S., E.R., S.L.C., C.R., P.J.C., R.M.T., R.P., C.B., S.C., and D.J.H. analyzed and interpreted the data; S.E.L., S.L.B., P.A.B., A.G.S., E.R., C.B., S.C., and D.J.H. wrote the manuscript; and all authors gave final approval of the manuscript and agreed to be accountable for all aspects of the work.
Conflict-of-interest disclosure: P.A.B. reports consultancy for Karus Therapeutics, OncoDNA, and Everything Genetic. D.J.H. received research funding from Gilead International; and reports consultancy for Karus. The remaining authors declare no competing financial interests.
The current affiliation for C.R. is Department of Bioengineering, Stanford University, Palo Alto, CA.
Correspondence: Simon Crouch, Epidemiology and Cancer Statistics Group, Department of Health Sciences, University of York, York, YO10 5DD, United Kingdom; e-mail: simon.crouch@york.ac.uk.