Key Points
Neurotoxicity after CAR T cells is associated with cytokine release syndrome; serum levels of inflammatory markers correlate with severity.
Grade 3-4 neurotoxicity is a negative prognostic factor for OS, and a short course of steroids does not appear to alter outcome.

Abstract
Chimeric antigen receptor (CAR) T cells have emerged as a promising class of cell-based immunotherapy in refractory malignancies. Neurotoxicity represents a common and potentially life-threatening adverse effect of CAR T cells, and clinical experience is limited. Here, we describe the clinical presentation and management of 25 adult patients who presented with neurotoxic syndromes after CAR T-cell therapy at the Massachusetts General Hospital. This cohort includes 24 patients treated with CD19-directed CAR T cells for non-Hodgkin lymphoma (n = 23) and acute lymphoblastic leukemia (n = 1), and 1 patient treated with α-fetoprotein–directed CAR T cells for hepatocellular carcinoma (n = 1). Twelve of the 25 patients (48%) developed grade 1-2 neurotoxicity and 13 patients (52%) presented with grade 3-4 neurotoxicity. We found that lower platelet counts at time of CAR T-cell infusion were associated with more severe neurotoxicity (P = .030). Cytokine release syndrome occurred in 24 of 25 patients (96%). Serum levels of ferritin peaked with onset of neurologic symptoms, and higher ferritin levels were associated with higher neurotoxicity grade. Grade 3-4 neurotoxicity correlated negatively with overall survival (OS) (P = .013). Median OS of the entire cohort was 54.7 weeks. Eight patients (32%) with grade 3-4 neurotoxicity were deceased at database closure, whereas none died with neurotoxicity grade 1-2. High pretreatment lactate dehydrogenase was frequently encountered in lymphoma patients with grade 3-4 neurotoxicity and correlated negatively with progression-free survival (P = .048). We did not find evidence that steroid use ≥7 days altered the patient’s outcome when compared with <7 days of steroids. Management of CAR T cell–mediated neurotoxicity warrants evaluation in prospective clinical trials.
Introduction
Genetically engineered chimeric antigen receptor (CAR) T-lymphocytes have emerged as a powerful new class of immunotherapeutic agents in relapsed and refractory malignancies.1 CARs incorporate antigen-recognition moieties as well as T cell–activating and costimulatory domains that can endow an autologous polyclonal T-cell population with antigen specificity following viral transduction. This process redirects the immune effector cell against a target antigen on the tumor cell surface such as the B-cell marker CD19.2 Several clinical trials have shown high response rates for adoptive immunotherapy with CAR T cells.3-5 Two CAR T-cell products were recently approved by the US Food and Drug Administration for use in relapsed or refractory diffuse large B-cell lymphoma and B-cell acute lymphoblastic leukemia.1
Despite this early success, broader application of CAR T-cell therapies may be limited by unique toxicities.6 Cytokine release syndrome (CRS) and neurotoxicity are among the most commonly observed toxicities after adoptive immunotherapy with CAR T cells. Neurologic symptoms have been consistently reported in clinical trials of T-cell activating agents such as bispecific T cell–engaging antibodies or CD19-directed CAR T-cell therapy, and also for CAR T cells targeting antigens other than CD19.7-10 More than 60% of patients treated with CAR T cells may experience toxic neurologic effects, although there is heterogeneity across different CAR T-cell constructs.11 A broad spectrum of CAR T-cell therapy-mediated neurotoxicity has been described and ranges from mild confusion to aphasia, seizures, cerebral edema with coma, and potentially death.9
Enrichment of proinflammatory cytokines in the central nervous system, endothelial activation, and macrophage activation syndrome have all been proposed as potential mechanisms.12-14 Agents used to manage CRS, such as the anti-interleukin-6 (IL-6) receptor antibody tocilizumab, do not appear to reduce or may even worsen the severity of neurotoxicity, and therapy for neurotoxicity rests upon symptomatic management, seizure control, and corticosteroids.15,16 Despite the widespread use of corticosteroids, it is unknown to what degree they influence CAR T cell–mediated anticancer effects, and a “standard of care” for corticosteroid use to treat neurotoxicity remains to be defined.17
In this study, we present the institutional experience from the Massachusetts General Hospital of patients managed for CAR T cell–mediated neurotoxicity. We describe the clinical presentation, radiographic and electroencephalographic (EEG) findings, potential biomarkers, patient management, and overall outcome.
Patients and methods
Study population
Study design and methods were approved by the institutional review board of the Massachusetts General Hospital. We retrospectively searched our institutional database and identified patients treated between 2016 and 2018 for neurotoxicity following CAR T-cell infusion. We collected demographic and clinical pretreatment information, onset and grade of CRS, clinical presentation, severity and pattern of neurotoxicity, serum levels of pretreatment lactate dehydrogenase (LDH) in lymphoma patients and acute-phase proteins in all patients, radiographic and EEG findings, treatment, use of steroids, and clinical outcome. EEG findings of 4 patients included in this cohort have been previously reported.18
Toxicity assessment
Neurotoxicity was prospectively graded according to National Cancer Institute Common Terminology Criteria for Adverse Effects v4.03. Additional retrospective review of the medical records was performed to grade neurotoxicity according to Common Terminology Criteria for Adverse Effects v4.03; discrepancies were adjusted by consensus review. Low-grade neurotoxicity was defined as grade 1 and 2 and high-grade neurotoxicity was defined as grade 3 and 4. CRS was graded according to the Penn CRS grading scale.19
Outcome analysis
Disease burden and response to therapy was evaluated directly before and 1 month after CAR T-cell infusion using positron emission tomography-computed tomography (CT), whole-body CT, or magnetic resonance imaging (MRI) for patients with lymphoma or hepatocellular carcinoma, and with bone marrow biopsy for leukemia patients. Response to CAR T-cell therapy was graded per disease standard.
Statistical analysis
For statistical analysis, the highest grade of neurotoxicity in each subject was used. Data were tested for normal distribution and equal variance using the D' Agostino-Pearson omnibus normality test. Differences between 2 groups were analyzed by the unpaired Student t test. In case of nonparametric data, we used the Mann-Whitney U test. All values are expressed as mean ± standard error of the mean if not indicated otherwise, and range is given. Categorical variables are described in absolute numbers and percent. Relationships between categorical variables were analyzed using the χ2 test. For survival analyses, patients were followed until death or day of database closure (15 August 2018). Patients lost to follow-up were censored at the day of last follow-up. Date of disease progression was defined as first date when restaging studies or autopsy identified new or recurrent disease following CAR T-cell infusion. Cases in which autopsy showed complete remission in deceased subjects were censored at that time point and not classified as disease progression. Overall survival was defined as interval from CAR T-cell infusion to death from any cause. Survival and predictors of outcome were calculated using Kaplan-Meier survival analysis and log-rank test. All statistical analyses were performed using Prism statistical software (Prism 7.0a; GraphPad Software Inc., San Diego, CA). The significance level was set at P ≤ .05. Data can be accessed by contacting the authors.
Results
Study population
Twenty-five patients with neurotoxicity mediated by CAR T-cell therapy were identified (Table 1). Patients were treated for the following relapsed or refractory underlying diseases: diffuse large B-cell lymphoma (21/25 patients, 84%); primary mediastinal large B-cell lymphoma (1/25, 4%); chronic lymphocytic leukemia/small cell lymphocytic lymphoma (1/25, 4%); acute lymphoblastic leukemia (1/25, 4%); and hepatocellular carcinoma (1/25, 4%). All patients underwent lymphodepletion with a combination of fludarabine and cyclophosphamide before CAR T-cell infusion, per standard of care. Twenty-four of 25 patients (96%) received CD19-directed CAR T cells; 1 patient (1/25, 4%) had CAR T-cell therapy directed against α-fetoprotein.
Twelve of 25 patients (48%) developed low-grade neurotoxicity (grade 1-2), including 5 patients who experienced worst grade 1 neurotoxicity and 7 patients who experienced worst grade 2 neurotoxicity. Thirteen of 25 patients (52%) developed more severe high-grade neurotoxicity (grade 3-4), including 7 patients with grade 3 neurotoxicity and 6 patients with grade 4 neurotoxicity. Median age in patients with low-grade neurotoxicity was 61 ± 3.6 years (range, 35-76) and 71 ± 5.3 years (range, 26-82) in patients with high-grade neurotoxicity (P = .963). Within the group of 23 patients treated for lymphoma, 5 of 10 lymphoma patients with low-grade neurotoxicity (50%) and 9 of 13 lymphoma patients with high-grade neurotoxicity (69%) had pretreatment LDH levels ≥400 U/L (P = .473). No differences between patients with low- or high-grade neurotoxicity were retrospectively found for the hematologic parameters of white blood cells counts or absolute neutrophil counts at CAR T-cell infusion. However, platelet counts were significantly lower at time of CAR T cell infusion in individuals who later developed high-grade neurotoxicity when compared with patients who developed low-grade neurotoxicity (74.6 ± 16 vs 166.8 ± 36 × 109/L; P = .030).
Clinical presentation
The median time from CAR T-cell infusion to first neurologic symptoms of any grade was 5 ± 0.9 days (range, 1-20 days) and the median time to first severe neurotoxicity was 7 ± 1.9 days (range, 3-30 days) (Figure 1A).
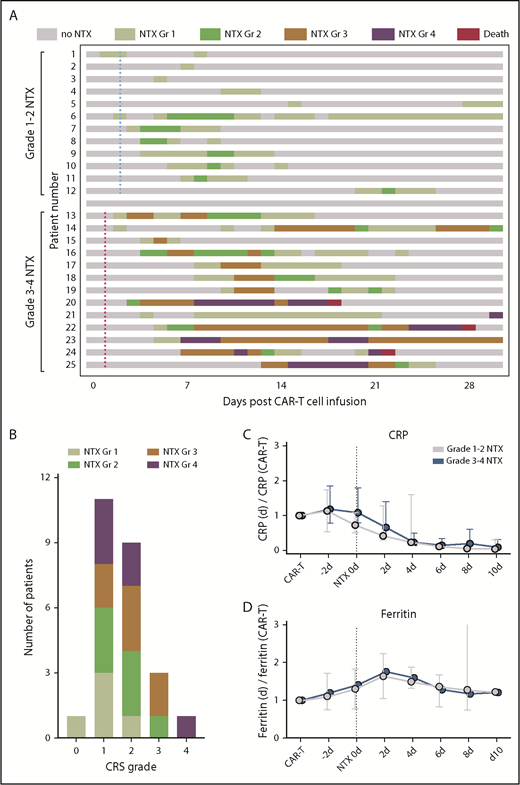
Timeline and biomarkers of neurotoxicity (NTX). (A) Swimmer plot shows the kinetics of NTX in each patient through 30 days after CAR T-cell infusion (n = 25). Each row represents 1 patient; the highest grade of neurotoxicity recorded on each day is color-coded. Three patients died within 30 days of CAR T-cell infusion after severe neurologic symptoms. Median time to first fever ≥38°C for patients with (blue dotted line) grade 1-2 neurotoxicity and (red dotted line) grade 3-4 neurotoxicity is indicated. (B) Number of patients with each grade (Gr) of CRS and neurotoxicity. (C-D) Serum levels of the acute-phase proteins CRP (C) and ferritin (D) in relationship to serum levels at CAR T-cell infusion. Ratio is shown for patients with grade 1-2 neurotoxicity (gray) and grade 3-4 neurotoxicity (blue) 2 days before neurotoxicity; at onset of neurotoxicity; and at days 2, 4, 6, 8, and 10 after onset of neurotoxicity. Vertical black dotted line indicates onset of neurotoxicity. Median ratio and interquartile range are given.
Timeline and biomarkers of neurotoxicity (NTX). (A) Swimmer plot shows the kinetics of NTX in each patient through 30 days after CAR T-cell infusion (n = 25). Each row represents 1 patient; the highest grade of neurotoxicity recorded on each day is color-coded. Three patients died within 30 days of CAR T-cell infusion after severe neurologic symptoms. Median time to first fever ≥38°C for patients with (blue dotted line) grade 1-2 neurotoxicity and (red dotted line) grade 3-4 neurotoxicity is indicated. (B) Number of patients with each grade (Gr) of CRS and neurotoxicity. (C-D) Serum levels of the acute-phase proteins CRP (C) and ferritin (D) in relationship to serum levels at CAR T-cell infusion. Ratio is shown for patients with grade 1-2 neurotoxicity (gray) and grade 3-4 neurotoxicity (blue) 2 days before neurotoxicity; at onset of neurotoxicity; and at days 2, 4, 6, 8, and 10 after onset of neurotoxicity. Vertical black dotted line indicates onset of neurotoxicity. Median ratio and interquartile range are given.
The most common neurologic symptoms in the 12 patients with low-grade neurotoxicity were mild encephalopathy with altered mental status, confusion, or mildly decreased level of arousal (11/12 patients, 92%); mild aphasia with word-finding difficulties (6/12, 50%); and tremor (4/12, 33%). Fluctuating symptoms with intermittent symptom-free episodes were observed frequently. Low-grade neurotoxicity was present for a median of 5 ± 1.8 days (range, 1-25 days) during the first 30 days after infusion of CAR T cells. Among the 12 patients with low-grade neurotoxicity, CRS was present in 11 individuals (11/12, 92%); of those, only 1 patient had severe CRS ≥grade 3 (Figure 1B). Fever ≥38°C as an early sign of CRS occurred with a median of 2 ± 0.3 days (range, 0-4 days) after infusion of CAR T cells in low-grade neurotoxicity patients. In this subcohort, CRS consistently preceded the onset of neurologic symptoms, and the median time between first fever and first neurologic symptoms was 3 ± 1.5 days (range, 1-19 days). CRS lasted for a median of 5 ± 0.9 days (range, 1-11 days) and sometimes completely resolved before low-grade neurotoxicity occurred.
Thirteen patients had high-grade neurotoxicity, which was characterized in all patients by severe encephalopathy with impaired level of arousal, significant confusion or agitation, or intermittent apneic periods necessitating intubation for respiratory support. Other neurologic symptoms included severe aphasia (11/13 patients, 85%) and involuntary movements indicative of seizure-like activity or nonepileptic myoclonus (10/13, 77%). Intermittent symptom-free episodes were also found in high-grade neurotoxicity; however, neurologic symptoms often remained present >30 days after CAR T-cell infusion or were ended by patient death. All high-grade neurotoxicity patients also developed CRS, including 3 patients who had severe CRS ≥grade 3 and fever occurring at a median of 1 ± 1.1 days (range, 0-11) after infusion of CAR T cells. Unlike in patients with low-grade neurotoxicity, 2 patients with high-grade neurotoxicity had neurologic symptoms that preceded the onset of CRS by 4 and 8 days, retrospectively. Median time from first fever to first signs of neurotoxicity was 3 ± 1.3 days (range, −8 to 10) and to first severe neurotoxicity 5 ± 2 days (range, −2 to 29). CRS lasted for a median of 5 ± 0.2 days (range, 2-11) in high-grade neurotoxicity patients.
Serum biomarkers
Absolute levels of the acute-phase proteins C-reactive protein (CRP) and ferritin at time of CAR T-cell infusion did not significantly differ between patients who later developed low- or high-grade neurotoxicity. CRP and ferritin levels were rising in most patients after administration of CAR T cells compared with baseline levels at time of CAR T-cell infusion. Relative concentration of CRP peaked before onset of any neurologic symptoms, and decreased during follow-up to levels below baseline (Figure 1C). Ferritin peaked shortly after onset of neurotoxicity, and trended toward baseline during follow-up (Figure 1D). Absolute peak concentrations for ferritin (2 days after onset of neurotoxicity) were significantly more elevated in high-grade neurotoxicity patients when compared with low-grade neurotoxicity patients (4533 ± 930 vs 1646 ± 472 ng/mL; P = .007), but no differences were found for peak CRP concentrations (2 days before neurotoxicity onset) (116 ± 28 vs 119 ± 21 mg/L; P = .784).
Radiographic and EEG findings
Brain MRI studies before CAR T-cell infusion were available in 11 of 12 patients who developed low-grade neurotoxicity, and in all 13 patients who developed high-grade neurotoxicity. White matter changes were observed in a comparable percentage of patients with low-grade neurotoxicity (6/11 patients, 55%) and high-grade neurotoxicity (9/13, 69%) (P = .247), and were consistent with either preexisting small vessel disease or posttreatment changes. One patient (who later developed high-grade neurotoxicity) had evidence of pachymeningeal thickening before CAR T-cell therapy, which had been attributed to toxicity from prior intrathecal methotrexate therapy.
Twenty-one patients underwent neuroimaging with cranial CT as part of their workup for CAR T-cell therapy-induced neurotoxicity, which revealed normal findings in 20 patients (20/21, 95%). One patient with grade 4 neurotoxicity had a normal head CT scan when neurologic symptoms started (Figure 2A) but developed subdural hematoma 13 days later (Figure 2A′). The patient became obtunded with no history of falls between the 2 CT scans.

Brain imaging and electroencephalography during neurotoxicity. (A) Normal CT of the brain at onset of neurotoxicity (top) and subdural hematoma 13 days later (A′). (B) Axial MRI of the brain with normal FLAIR (top) and diffusion-weighted imaging (DWI, bottom) sequences during acute neurotoxicity. (C) Axial FLAIR image (top) in a patient with severe neurotoxicity demonstrating a lesion (arrowheads) of the splenium of the corpus callosum partly characterized by restricted diffusion on DWI sequences (bottom). (D) Axial FLAIR hyperintensities of the brainstem (left) and the periventricular white matter (middle) were found in a patient with left-sided visual field deficit who presented 30 days after CAR T-cell infusion. Periventricular lesions were characterized by restricted diffusion on DWI sequences (right). Luxol fast blue (LFB) with hematoxylin and eosin (H&E) (E), neurofilament (F), and CD3 (G) stains of a tissue specimen taken from the periventricular lesion in panel D shows axonal injury of the optic radiation (original magnification, ×400). H&E-LFB demonstrates vacuolization and axonal spheroid formation (arrows). Immunohistochemical staining for neurofilament shows enlarged circular brown material consistent with axonal spheroids within white matter, a finding characteristic for Wallerian degeneration. Immunohistochemical staining for CD3 highlights T cells in scant numbers, primarily present in perivascular regions. (H) Electroencephalography of a patient who developed myoclonus and confusion 10 days after CAR T-cell infusion. Low-frequency blunted generalized periodic discharges admixed with rhythmicity on an alternating background between δ and θ slowing are displayed. The snapshot is seen in a longitudinal bipolar montage (left-right-left-right-midline): sensitivity, 7 μV/mm; time base, 30 mm/s; low-frequency filter, 1 Hz; high-frequency filter, 70 Hz; and notch, 60 Hz. (I, left) Axial FLAIR image in a patient with confusion after rituximab-lenalidomide infusion shows bilateral curvilinear hyperintensities in the juxtacortical frontoparietal white matter without restricted diffusion on DWI sequences (right). (J) Axial T1-weighted MRI postcontrast and FLAIR images demonstrate a radiosurgery lesion pre-CAR T-cell infusion (left) and evidence of radiation necrosis with contrast enhancement after CAR T-cell infusion (J′).
Brain imaging and electroencephalography during neurotoxicity. (A) Normal CT of the brain at onset of neurotoxicity (top) and subdural hematoma 13 days later (A′). (B) Axial MRI of the brain with normal FLAIR (top) and diffusion-weighted imaging (DWI, bottom) sequences during acute neurotoxicity. (C) Axial FLAIR image (top) in a patient with severe neurotoxicity demonstrating a lesion (arrowheads) of the splenium of the corpus callosum partly characterized by restricted diffusion on DWI sequences (bottom). (D) Axial FLAIR hyperintensities of the brainstem (left) and the periventricular white matter (middle) were found in a patient with left-sided visual field deficit who presented 30 days after CAR T-cell infusion. Periventricular lesions were characterized by restricted diffusion on DWI sequences (right). Luxol fast blue (LFB) with hematoxylin and eosin (H&E) (E), neurofilament (F), and CD3 (G) stains of a tissue specimen taken from the periventricular lesion in panel D shows axonal injury of the optic radiation (original magnification, ×400). H&E-LFB demonstrates vacuolization and axonal spheroid formation (arrows). Immunohistochemical staining for neurofilament shows enlarged circular brown material consistent with axonal spheroids within white matter, a finding characteristic for Wallerian degeneration. Immunohistochemical staining for CD3 highlights T cells in scant numbers, primarily present in perivascular regions. (H) Electroencephalography of a patient who developed myoclonus and confusion 10 days after CAR T-cell infusion. Low-frequency blunted generalized periodic discharges admixed with rhythmicity on an alternating background between δ and θ slowing are displayed. The snapshot is seen in a longitudinal bipolar montage (left-right-left-right-midline): sensitivity, 7 μV/mm; time base, 30 mm/s; low-frequency filter, 1 Hz; high-frequency filter, 70 Hz; and notch, 60 Hz. (I, left) Axial FLAIR image in a patient with confusion after rituximab-lenalidomide infusion shows bilateral curvilinear hyperintensities in the juxtacortical frontoparietal white matter without restricted diffusion on DWI sequences (right). (J) Axial T1-weighted MRI postcontrast and FLAIR images demonstrate a radiosurgery lesion pre-CAR T-cell infusion (left) and evidence of radiation necrosis with contrast enhancement after CAR T-cell infusion (J′).
Ten patients consisting of 2 low- and 8 high-grade neurotoxicity patients had cranial MRI performed during acute symptoms. Imaging was unrevealing in patients with low-grade neurotoxicity and in 6 patients with high-grade neurotoxicity (8/10, 80%) (Figure 2B). One patient had new periventricular hyperintensities and a lesion anterior to the splenium of the corpus callosum on T2-weighted fluid attenuation inversion recovery (FLAIR) imaging with associated restricted diffusion (Figure 2C). One patient had mild neurotoxicity that completely resolved, but 30 days after infusion presented with visual field deficit rapidly progressing to bilateral blindness and extremity weakness with upper motor neuron signs. MRI showed patchy T2-weighted FLAIR hyperintensities without corresponding restricted diffusion within the pons and hyperintensities with restricted diffusion within the periventricular white matter along the lateral ventricles and the splenium (Figure 2D). The patient died 10 weeks after CAR T-cell infusion; pathology showed axonal injury mostly affecting bilateral optic radiations (Figure 2E-G). However, this clinical phenotype was attributed to fludarabine-induced leukoencephalopathy and not interpreted as a direct consequence of CAR T cells.
EEG during acute neurologic symptoms was performed on 18 patients, including 6 with low-grade neurotoxicity and 12 with high-grade neurotoxicity. All 18 patients were found to have diffuse or frontal background slowing in the θ and δ frequency ranges. Periodic or rhythmic patterns within the ictal-interictal continuum were seen in 3 of 6 low-grade neurotoxicity patients (50%) and 11 of 12 high-grade neurotoxicity patients (92%) (Figure 2H). The following ictal-interictal patterns were encountered and in part occurred concurrently: generalized period discharges (GPD; 9/18 patients, 50%); generalized rhythmic δ activity (8/18, 44%); frontal intermittent rhythmic δ activity (2/18, 11%); bilateral independent periodic discharges (2/18, 11%); and stimulus-induced rhythmic, periodic, or ictal discharges (2/18, 11%). Burst suppression was induced in 3 patients with high-grade neurotoxicity, and status epilepticus was found in 2 high-grade neurotoxicity patients. Of note, some clinical events of involuntary rhythmic movements remained without EEG correlate.
Two patients had neurotoxicity after CAR T-cell infusion which completely resolved, however, they presented more than 30 days after CAR T-cell infusion with new neurologic symptoms and new imaging findings. First, 1 patient with prior high-grade neurotoxicity had lymphoma recurrence 4 months after CAR T-cell therapy, and salvage therapy with rituximab-lenalidomide was initiated. The patient subsequently developed confusion and myoclonus; MRI of the brain revealed frontoparietal FLAIR hyperintensities (Figure 2I). Second, 1 patient with a medical history of γ knife radiosurgery 6 months before CAR T-cell infusion (Figure 2J) and prior low-grade neurotoxicity presented with left-sided weakness 1 month after infusion, and was found to have exacerbation of radiation necrosis (Figure 2J′). Whereas there is evidence that symptoms of the first patients may be associated with CAR T cells,20 the latter case of radiation necrosis was believed to be an event occurring independently from CAR T cells.
Treatment, outcome, and prognostic markers
Management of patients with mild neurotoxicity included supportive therapy and the IL-6 receptor antibody tocilizumab for patients with CRS. Tocilizumab was administered in 12 patients for CRS ≥grade 2. Most patients received levetiracetam (750 mg twice daily) as seizure prophylaxis before onset of neurotoxicity or at first neurologic symptoms. However, all patients who developed periodic or rhythmic EEG patterns had already been started on seizure prophylaxis, and levetiracetam was therefore not able to prevent ictal-interictal EEG activity in our cohort. Phenytoin, fosphenytoin, lacosamide, lorazepam, and propofol were used in addition to levetiracetam for abnormal EEG patterns and status epilepticus.
Disease staging 1 month after CAR T-cell infusion was available in 24 of 25 patients. The overall response rate was 84%. Eleven patients had complete response (11/24 patients, 46%) (Figure 3A); 9 had partial response (38%); 2 had stable disease (8%); and 2 had progressive disease (8%). Median progression-free survival was not reached after 60 weeks; median overall survival was 54.7 weeks. A total of 8 patients (33%) had progressed at date of data cutoff and 8 patients had died (Figure 3B-C). Two low-grade neurotoxicity patients had progressed and all were alive at database closure, whereas 6 individuals were found to have disease progression and 8 had died among high-grade neurotoxicity patients. Of note, autopsy of 2 high-grade neurotoxicity patients showed no evidence of persisting lymphoma, including the autopsy of the previously mentioned case of fludarabine-induced leukoencephalopathy.

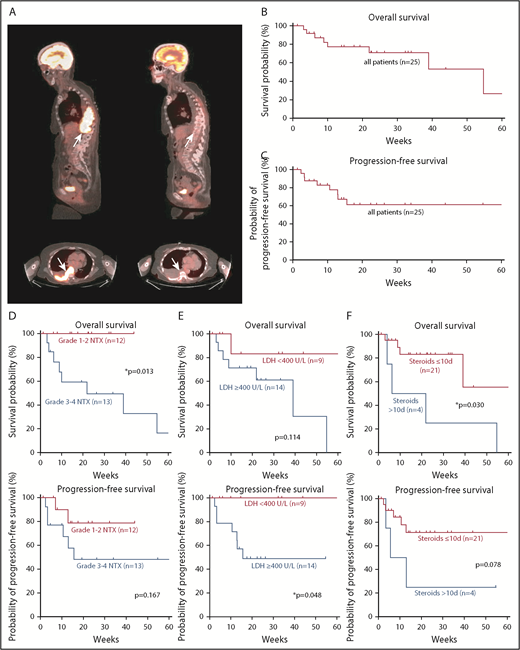
Prognostic markers for survival and disease progression in patients with neurotoxicity. (A) Sagittal and axial positron emission tomography-CT images show a paraspinal mass (arrows) with high-intensity contrast uptake consistent with lymphoma (left) and complete response 1 month after CAR T-cell infusion (right). Kaplan-Meier estimates of overall survival (B) and progression-free survival (C) in our cohort. Tick marks indicate censored patients. Kaplan-Meier estimates of overall survival and progression-free survival for different prognostic markers. Curves are given for patients with low- or high-grade neurotoxicity (D), LDH <400 U/L or ≥400 U/L at CAR T-cell infusion (E), and ≤10 or >10 days of steroid use (F). Tick marks indicate censored patients.
Prognostic markers for survival and disease progression in patients with neurotoxicity. (A) Sagittal and axial positron emission tomography-CT images show a paraspinal mass (arrows) with high-intensity contrast uptake consistent with lymphoma (left) and complete response 1 month after CAR T-cell infusion (right). Kaplan-Meier estimates of overall survival (B) and progression-free survival (C) in our cohort. Tick marks indicate censored patients. Kaplan-Meier estimates of overall survival and progression-free survival for different prognostic markers. Curves are given for patients with low- or high-grade neurotoxicity (D), LDH <400 U/L or ≥400 U/L at CAR T-cell infusion (E), and ≤10 or >10 days of steroid use (F). Tick marks indicate censored patients.
Long-term outcome data from patients with neurotoxicity are not available in the literature. We therefore studied the effect of neurotoxicity on the outcome within our cohort during a long follow-up period. Presentation with high-grade neurotoxicity (n = 13) was a significant negative prognostic marker for overall survival (P = .013), but not for progression-free survival (P = .167) when compared with patients presenting with low-grade neurotoxicity (n = 12) (Figure 3D). In addition, age >65 (n = 12) was a negative prognostic factor for overall survival (P = .039), but not for progression-free survival (P = .168). Given this risk for treatment-related mortality, we aimed to identify which patients were less likely to show a long-term benefit from CAR T-cell therapy. We found that high pretreatment LDH in lymphoma patients (n = 14) was not a significant negative prognostic marker for overall survival (P = .114), but for progression-free survival (P = .048) in the group of lymphoma patients (Figure 3E).
Although corticosteroids are commonly used to ameliorate symptoms of neurotoxicity, it has been hypothesized that corticosteroids may negatively affect the desired antitumor effect of CAR T cells. We therefore recorded the days of steroid use until the first disease staging exam in our patients. Dexamethasone was administered in 8 of 12 low-grade neurotoxicity patients for a median of 7 ± 1 days (range, 0-10 days), and in 12 of 13 high-grade neurotoxicity patients for a median of 8 ± 1.5 days (range, 0-19 days). Neurologic symptoms often improved within a few days of corticosteroid therapy. Corticosteroid use ≥7 days (n = 13) was neither a prognostic marker for overall survival (P = .874) nor for progression-free survival (P = .808) when compared with corticosteroid use <7 days. Of interest, however, a prolonged course of >10 days of steroids (n = 4) appeared to be a negative prognostic indicator for overall survival (P = .030), but not for progression-free survival (P = .078) (Figure 3F).
Discussion
CAR T-cell therapy represents a highly promising therapeutic development in oncology; however, it is frequently complicated by neurotoxicity.7-9,21 Only ∼1000 patients have received CAR T cells in the United States, and clinical experience for neurotoxicity remains limited.1 Long-term outcome data after neurotoxicity associated with CAR T-cell therapy are unavailable. With the present study, we characterize 25 unique patients who developed neurotoxicity as a consequence of CAR T-cell therapy.
We found that severe neurotoxicity represented a negative prognostic factor for overall survival. By the date of database cutoff, 8 of 13 patients with high-grade neurotoxicity had died, but no deaths occurred among patients with low-grade neurotoxicity. Three of our fatalities occurred within 30 days after CAR T-cell infusion because of significant neurologic symptoms. Our findings therefore highlight the potential for therapy-related mortality and underline the importance of rigorous monitoring of patients treated with CAR T cells.
Fatal neurotoxicity has been described in clinical studies, with an incidence of up to 3% after CD19-directed CAR T-cell infusion.13 Given the significant risk for treatment-related mortality and high disease remission rates at first staging, we aimed to retrospectively identify patients with increased morbidity and mortality risk after CAR T-cell therapy. Of note, although different CAR T-cell products may carry different risk profiles for systemic toxicity and neurotoxicity, we were bound to clinical trial reporting regulations and were therefore unable to identify our findings with respect to a specific CAR T-cell product.
Our analysis showed that pretreatment LDH was a potential predictor of post-CAR T-cell disease progression in lymphoma patients. Of interest, high LDH was found in most of the lymphoma patients who subsequently developed severe neurotoxicity. This observation corroborates the hypothesis that elevated LDH levels are a risk factor for worse outcome in lymphoma patients as defined by increased rates of disease progression and associated with a higher degree of severe neurotoxicity. High LDH largely reflects more extensive disease burden in our lymphoma patients.22 Our findings therefore appear consistent with those from CAR T-cell trials showing that higher LDH in lymphoma patients and higher disease burden is not only correlated with shorter remission duration, but also with higher incidence of neurotoxicity and shorter long-term survival.23,24 However, we were not able to detect a significant association between grade of neurotoxicity and disease progression, possibly due to a limited number of patients in our cohort.
High-dose corticosteroids are commonly used to ameliorate symptoms of neurotoxicity. Whether steroids may impair tumor-directed properties and therefore efficacy of CAR T cells remains an area of uncertainty.17,25 We did not find evidence that a course of corticosteroids ≥7 and ≤10 days altered the patients' overall outcome or progression-free survival when compared with a shorter course of <7 days of steroids. Also, disease response rates of our patients at first staging did not differ from what has been reported in larger clinical trials for lymphomas or leukemias treated with CAR T cells.9,24 We found, however, that a prolonged course of steroids >10 days in patients with severe neurotoxicity appeared to negatively influence overall survival, but not time to disease progression. The data does not allow to distinguish whether the association of prolonged steroid use with lower overall survival is related to a more severe degree of neurotoxicity or represents an independent risk factor for poor outcome.
In our cohort, neurotoxicity was highly correlated with manifestation of CRS, and neurologic symptoms were preceded by fever in most patients. Fever occurred earlier in patients who subsequently developed severe neurotoxicity. Early-onset fever may therefore raise suspicion for impending CAR T-cell neurotoxicity. Our assumptions are supported by other studies assessing the association between neurotoxicity and CRS. Santomasso et al evaluated 33 patients with neurotoxicity; all had at least fever as a symptom of CRS before onset of neurologic symptoms.11 Gust et al reported 53 patients with neurologic symptoms of any grade after CAR T-cell infusion and found that 91% had CRS.13 Although some studies speculate on potential neurotoxicity mechanisms independent from CRS,26 our study may not be in support of such a hypothesis.
We further analyzed levels of acute-phase proteins in patient serum to elucidate the relationship of neurotoxicity and CRS. We identified a unique pattern for the acute-phase reactants CRP and ferritin during the course of neurotoxicity, possibly suggesting a distinct role of each biomarker in patients with neurotoxicity. Ferritin peaked shortly after onset of neurologic symptoms and normalized when symptoms resolved, whereas CRP peaked before onset of neurotoxicity. Higher peak concentration of ferritin also correlated with higher grade of neurotoxicity. These findings are consistent with emerging reports by others,11,13,27 and we conclude that ferritin may possibly be more sensitive for following the clinical neurotoxicity course compared with CRP. Other studies have provided compelling evidence that central nervous system–specific production of proinflammatory cytokines such as IL-1 may play a crucial role in the development of neurotoxicity after CAR T-cell infusion, and that cytokine levels correlate with symptom severity.11,13,14 Although we were not able, based on the retrospective nature of our present study, to correlate cytokine levels with brain imaging findings or with steroid and tocilizumab use, such correlative analyses may be relevant in future prospectively designed studies.
We further found that low platelet counts before CAR T-cell infusion were associated with more severe neurotoxicity, possibly reflecting a heavily pretreated patient population at higher risk for treatment-related adverse events. Whether this association will hold true in large prospective clinical trials is unclear. Low platelet counts may be a biomarker of blood-brain barrier disruption,28 which in turn has been proposed to be an important factor in the pathogenesis of neurotoxicity.13 The contribution of conventional chemotherapy and lymphodepletion drugs to the development of CAR T cell–related neurotoxicity via low pretreatment platelet counts or other mechanisms therefore has to be taken into consideration.11,13 We did not find evidence that other non-neoplastic risk factors such as age, gender, or preexisting white matter disease (leukoencephalopathy) predisposed to the development of more severe neurotoxicity.
In our patients, periodic or rhythmic EEG patterns on the ictal-interictal continuum were characteristic for high-grade neurotoxicity. Synchronous discharges may be generated by disruptions of the thalamocortical networks and can be induced by neuronal dysfunction mediated through proinflammatory cytokines.29 We therefore hypothesize that EEG recordings may be useful to objectively monitor patients with neurologic symptoms. It remains to be evaluated if predefined therapeutic algorithms for antiepileptic agent titration and seizure prophylaxis in patients undergoing CAR T-cell therapy are helpful in improving clinical outcomes. Imaging abnormalities were occasionally found in patients with severe neurologic symptoms. Lesions of the splenium have been previously described after CAR T-cell infusion.11 However, imaging studies were primarily used to exclude alternative diagnoses for the observed neurologic symptoms. CT and MRI may therefore be less critical in guiding therapy compared with EEG monitoring.
Collectively, CAR T-cell therapy is emerging as a powerful therapeutic strategy in cancer patients, but potentially fatal neurotoxicity can be associated with such therapy. Considering the high frequency of neurotoxicity events, randomized prospective studies of treatment algorithms are urgently needed to improve patient monitoring and management. Blood biomarkers and EEG monitoring may be useful tools in optimizing patient care and safety and will also need to be evaluated.
The publication costs of this article were defrayed in part by page charge payment. Therefore, and solely to indicate this fact, this article is hereby marked “advertisement” in accordance with 18 USC section 1734.
Acknowledgment
The authors thank the patients and their families.
Authorship
Contribution: P.K., J.S.A., and J.D. undertook study concept and design; P.K., J.T.J., D.A.F., I.C.A.-R., T.T.B., N.F.C., L.N.G.C., A.H., M.V.M., M.H.S., J.D.S., R.W.T., E.P.H., J.A.B., J.S.A., M.J.F., and J.D. provided data collection; P.K., J.S.A., and J.D. analyzed and interpreted data; P.K. and J.D. drafted the manuscript; and P.K., J.T.J., D.A.F., I.C.A.-R., T.T.B., J.M.B., N.F.C., L.N.G.C., A.H., M.V.M., M.H.S., J.D.S., R.W.T., E.P.H., J.A.B., J.S.A., M.J.F., and J.D. revised the manuscript.
Conflict-of-interest disclosure: J.T.J. is a paid consultant for NF Network, Guidepoint Global, and ClearView Healthcare Partners, an unpaid consultant for Shepherd Foundation; and receives royalties from Elsevier Publishing. T.T.B. is a consultant for Genomicare, Merck, NXDC, Amgen, Proximagen/Upsher, and Champions Biotechnology; receives research support from Pfizer and Oncoceutics; and provides editorial activities for UpToDate and Oakstone. J.D.S. is a consultant for Verastem and receives grants or research support paid to his institution from Genentech/Roche, BeiGene, and TG Therapeutics. J.S.A. is a consultant for Celgene, Gilead, Kite Pharma, Juno therapeutics, and Novartis. M.J.F. provides clinical advisory board activities for Celgene and Novartis. J.D. is a consultant for Monteris Medical Corp and Unum Therapeutics and has received royalties from UpToDate. The remaining authors declare no competing financial interests.
Correspondence: Jorg Dietrich, Department of Neurology, Division of Neuro-Oncology, Massachusetts General Hospital Cancer Center, Harvard Medical School, 55 Fruit St, Yawkey 9E, Boston, MA 02114; e-mail: dietrich.jorg@mgh.harvard.edu.