Key Points
CD38-expressing immunosuppressive regulatory T and B cells and myeloid-derived suppressor cells were sensitive to daratumumab treatment.
Cytotoxic T-cell number, activation, and clonality increased after daratumumab treatment in heavily pretreated relapsed and refractory MM.
Abstract
Daratumumab targets CD38-expressing myeloma cells through a variety of immune-mediated mechanisms (complement-dependent cytotoxicity, antibody-dependent cell-mediated cytotoxicity, and antibody-dependent cellular phagocytosis) and direct apoptosis with crosslinking. These mechanisms may also target nonplasma cells that express CD38, which prompted evaluation of daratumumab’s effects on CD38-positive immune subpopulations. Peripheral blood (PB) and bone marrow (BM) from patients with relapsed/refractory myeloma from 2 daratumumab monotherapy studies were analyzed before and during therapy and at relapse. Regulatory B cells and myeloid-derived suppressor cells, previously shown to express CD38, were evaluated for immunosuppressive activity and daratumumab sensitivity in the myeloma setting. A novel subpopulation of regulatory T cells (Tregs) expressing CD38 was identified. These Tregs were more immunosuppressive in vitro than CD38-negative Tregs and were reduced in daratumumab-treated patients. In parallel, daratumumab induced robust increases in helper and cytotoxic T-cell absolute counts. In PB and BM, daratumumab induced significant increases in CD8+:CD4+ and CD8+:Treg ratios, and increased memory T cells while decreasing naïve T cells. The majority of patients demonstrated these broad T-cell changes, although patients with a partial response or better showed greater maximum effector and helper T-cell increases, elevated antiviral and alloreactive functional responses, and significantly greater increases in T-cell clonality as measured by T-cell receptor (TCR) sequencing. Increased TCR clonality positively correlated with increased CD8+ PB T-cell counts. Depletion of CD38+ immunosuppressive cells, which is associated with an increase in T-helper cells, cytotoxic T cells, T-cell functional response, and TCR clonality, represents possible additional mechanisms of action for daratumumab and deserves further exploration.
Introduction
Proteasome inhibitors (PIs) and immunomodulatory drugs (IMiDs) have improved outcomes in patients with multiple myeloma (MM).1-3 Despite these advances, prognosis for patients with relapsed MM remains poor, particularly for those who have relapsed after PI and IMiD treatment.4 New therapies with novel mechanisms of action are needed for resistant patient populations.
Myeloma is associated with immune dysfunction,5 including immune evasion through the expression of immune checkpoint ligands on plasma cells,6 elevated adenosine receptor and adenosine activity,7,8 and immune suppression through myeloid-derived suppressor cells (MDSCs) and regulatory T cell (Treg) activity.9-11 CD38 is ubiquitously expressed on MM cells,12,13 but is also present on other immune cells, including MDSCs and regulatory B cells (Bregs).14,15 These CD38-positive (CD38+) immunosuppressive cell populations are associated with decreased immune function and disease progression. Thus, the role of CD38 in myeloma and immune cell biology may be important for the treatment of disease.
Daratumumab is a human immunoglobulin G1 (IgG1) monoclonal antibody that targets CD38, inducing tumor cell death through multiple mechanisms, including antibody-dependent cell-mediated cytotoxicity (ADCC), complement-dependent cytotoxicity, and antibody-dependent cellular phagocytosis (ADCP).16,17 Daratumumab has shown promising antimyeloma activity in 2 clinical studies (GEN501 and SIRIUS) in patients with relapsed and refractory MM, resulting in remarkable response rates that include stringent complete responses (sCRs) and prolonged clinical responses in heavily pretreated patients.18,19 Based on these data, daratumumab was approved by the US Food and Drug Administration for patients with MM who have received ≥3 prior lines of therapy, including a PI and an IMiD agent, or who are double refractory to a PI and an IMiD.20
The observation that CD38 is expressed on various immune cells prompted an evaluation of the potential immunomodulatory effects of daratumumab monotherapy in patients with relapsed or relapsed and refractory MM. The impact of daratumumab on CD38+ immunosuppressive populations, T-cell proliferation and activation, and T-cell receptor (TCR) clonality was evaluated.
Methods
Clinical study design
Immune profiling and assessments of functional activity were performed in samples from patients with relapsed or refractory MM treated with daratumumab 16-mg/kg monotherapy and who were enrolled in 2 concurrent clinical studies (ClinicalTrials.gov Identifiers: #NCT00574288 [GEN501] and #NCT01985126 [SIRIUS]) that have been described in detail elsewhere.18,19 Briefly, in the GEN501 study, a phase 1/2 dose-escalation and dose-expansion study, patients had documented MM and had relapsed from or were refractory to ≥2 prior therapies.18 In SIRIUS, a phase 2 study, patients had received >3 prior therapies, including a PI or an IMiD, or were refractory to both classes of agents.19 Patients enrolled in these studies also received low to intermediate doses of corticosteroids to manage infusion-related reactions before and after daratumumab dosing. Best overall clinical responses were determined using the International Myeloma Working Group consensus recommendation for MM treatment response criteria.21 Patients were grouped into responders (ie, patients with best overall responses of partial response [PR], very good PR [VGPR], complete response [CR], or stringent CR [sCR]) and nonresponders (ie, patients with a best response of minimal response [MR], stable disease [SD], or progressive disease [PD]).
The investigators and sponsors were responsible for the study design and statistical analysis plan. The investigators and their research teams collected the data. Janssen Research & Development and Genmab compiled the data for summation and analysis and confirmed the accuracy of the data. All the investigators had full access to the data and analyses and were not restricted by confidentiality agreements. Ethics committees or institutional review boards at each study site approved the study protocols and the statistical analysis plans. The studies were conducted in accordance with the principles of the Declaration of Helsinki and the International Conference on Harmonization Good Clinical Practice guidelines. All the patients provided written informed consent.
Blood cell collection
Peripheral blood (PB) and bone marrow (BM) samples were collected in heparinized tubes at baseline, immediately prior to the first infusion, and at specified time points during treatment. The majority of samples were evaluated using real-time flow cytometry, as they arrived at a central laboratory 24 to 48 hours after collection. PB mononuclear cells (PBMCs) were obtained from whole blood, isolated by density-gradient centrifugation, and stored frozen until analysis. For the T-cell activation and clonality assays, pre- and posttreatment samples were analyzed at the same time, using frozen PBMC samples.
Immune cell phenotyping and quantification
Blood and BM samples were stained with the following multifluorochrome antibody panels: cell lineage panel, peridinin-chlorophyll proteins (PerCP)-Cy5.5α-CD19 (cloneHIB19; Becton Dickinson [BD]), allophycocyanin (APC)α-CD24 (SN3; eBioscience), PC7α-CD3 (UCHT-1; Beckman Coulter), V500α-CD16 (3G8; BD), and phycoerythrin (PE)α-CD56 (MY; BD); Treg panel, APCα-CD25 (2A3; BD), PEα-CD127 (HIL-7R-M21; BD), APC-H7α-HLA-DR (G46-6; BD), and PerCPα-CD4 (L200; BD); naive/memory T-cell panel, APC-H7α-CD4 (RPA-T4; BD), PerCP-Cy5.5α-CD8 (RPA-T4 BD), PEα-CD62L (SK11; BD), and APCα-CD45RA (HI100; BD). In addition, all samples were stained with fluorescein isothiocyanate α-CD38 (HuMax-003; Genmab/Janssen Research & Development), an antibody that binds to an epitope that is distinct from the epitope bound by daratumumab.22
Blood samples were lysed with fluorescence-activated cell sorter (FACS) lysing solution (BD), and FIX and PERM cell permeabilization reagent (Invitrogen) was used for BM aspirates. Analysis was performed using FACS Canto II flow cytometers, and data were analyzed using FACSDiva software. Absolute cell counts were calculated for PB samples, and immune cell subpopulations were represented as a percentage of total lymphocytes for BM samples.
MDSC phenotyping and daratumumab-mediated ADCC lysis
PBMCs from 3 normal healthy donors were cocultured with myeloma tumor cell lines (RPMI8226, U266, H929) for 6 days and evaluated for the production of granulocytic-like MDSCs (G-MDSCs; CD11b+CD14–HLA–DR–CD15+CD33+), as previously described.23 G-MDSCs were not present in normal healthy PBMCs; however, following coculture with all 3 myeloma cells lines, G-MDSCs were present as 5% to 25% of the total PBMC population (data not shown). Gating strategy for flow cytometric evaluation of G-MDSCs included CD11b+ as the first gate, followed by CD14– and HLA–DR– gating, and then followed by CD15+ and CD33+ gating. G-MDSCs were cell sorted and evaluated for CD38 expression levels and sensitivity to daratumumab-mediated ADCC.16 To evaluate the effect of daratumumab on ADCC/complement-dependent cytotoxicity (CDC) of MDSCs, serum containing a complement or an isotype control was added to ADCC assays.
Naive and memory cell analysis
Heparinized PB samples were obtained from patients prior to each infusion of daratumumab. PBMCs were isolated by Ficoll-Hypaque density-gradient centrifugation and stored in a cryopreservation medium (RPMI supplemented with 10% human serum and 10% dimethyl sulfoxide) in liquid nitrogen. For FACS analysis, PBMCs were thawed, and 2 × 10⁶ cells per panel were resuspended in phosphate-buffered saline with 0.05% sodium azide and 0.1% human serum albumin.
T-cell clonality
DNA from frozen patient PBMCs was assessed for TCR rearrangements using an Immunoseq assay (Adaptive Biotechnologies),24 and analysis was performed using prequalified multiplex polymerase chain reaction (PCR) assays (TR2015CRO-V-019), which were composed of forward and reverse primers that directly targeted the family of variable (V) genes (forward primers) and joining (J) genes (reverse primers). Each V and J gene primer acted as priming pairs to amplify somatically recombined TCRs, and each primer contained a specific universal DNA sequence. Following the initial PCR amplification, each amplicon was amplified a second time with forward and reverse primers containing the universal sequence and adaptor sequence needed for DNA sequencing by Illumina.
T-cell responses to viral and alloantigens
Patient PBMCs were seeded on 96-well plates (2 × 10⁵ cells per well) and stimulated for 5 days with a cocktail of 23 major histocompatibility complex class I–restricted viral peptides from human cytomegalovirus, Epstein-Barr virus, and influenza virus (2 µg/mL; cytomegalovirus, Epstein-Barr virus, and influenza virus peptide pool; PANATecs) or an equivalent number of 25-Gy–irradiated allogeneic PBMCs from healthy donors. Unstimulated PBMCs and PBMCs stimulated with anti-CD3/CD28–coated beads served as negative and positive controls, respectively. On day 5, interferon γ (IFN-γ) from cell-free supernatant was measured by sandwich enzyme-linked immunosorbent assay (Human IFN-γ ELISA Ready-SET-Go; eBioscience) and served as a surrogate marker for T-cell activation.
Carboxyfluorescein succinimidyl ester dilution assay
PBMCs from healthy donors were labeled with PerCP-Cy5.5α-CD3 (SK7; BD), knockout α-CD45 (J33; Beckman Coulter), V450α-CD4 (SK3; BD), PEα-CD25 (M-A251, BD), PE Cy7α-CD127 (HIL-7R-M21; BD), and APCα-CD38 (HB-7; BD) and sorted by FACS Aria (BD). Sorted effector cells were labeled with carboxyfluorescein succinimidyl ester (CFSE; eBioscience) and stimulated with anti-CD3/CD28–coated beads in the presence or absence of CD38+ or CD38− Tregs (1:1 Treg to effector cell ratio) in RPMI plus 10% fetal calf serum. After 72 hours, flow cytometry was performed, and the percent dilution of CFSE was used as a surrogate for T-cell proliferation.
Statistical analyses
The patient population was defined as all patients who had an evaluable response and received >1 dose of daratumumab, from whom >1 on-treatment sample had been collected. All data analyses and output generation were performed using the programming language R, with all reproducible code contained in an R package. Modeling of the populations of absolute T-cell counts in PB was presented on a log scale as a function of the relative visit only using linear mixed-effect models25,26 with a random intercept and slope. In a separate analysis using mixed modeling, associations between time and response were assessed as well. Baseline measurements were mapped relative to day 1. The normality of the data were evaluated using a Shapiro-Wilk test for 2-group comparisons.27 If the data were not normally distributed, all 2-group comparisons were evaluated using rank tests and a t test, following a Box-Cox transformation. In all cases, the results from the t test and rank tests agreed; thus, only the P values of the rank tests were reported. Differences between the sums of absolute expansion in the T-cell clone repertoire, and the maximum expansion of a single clone between responders and nonresponders were evaluated using a Wilcoxon rank-sum test.28 Paired Wilcoxon signed-rank tests were used to evaluate CD8+:CD4+ cell ratio changes over time, differences between T-cell clonality at baseline compared with on-treatment, and CD8+-naive T cells prior to the eighth infusion compared with samples at time of relapse, and to compare CD8+ effector memory T cells at baseline and at relapse.28 For the analysis of CD8+:CD4+ cell ratios, only data from patients with observations at all 3 (for PB) or 2 (for BM) time points were included. The timing of BM aspiration/biopsy varied by a few days from patient to patient, and, for this reason, all on-treatment visits were grouped into a single “on-treatment” time point. If a patient had multiple on-treatment BM measurements, the last on-treatment data point was used. Experimental data were aligned by mapping the relative study day to fixed-week windows (supplemental Appendix, available on the Blood Web site).
Results
Clinical findings
To assess the effects of daratumumab on CD38+ immune subpopulations, response-evaluable PB and BM samples from a total of 148 patients with MM who received daratumumab in the GEN501 (n = 42) and SIRIUS (n = 106) studies were analyzed by flow cytometry, functional assays, and TCR sequencing. The median (range) age of the patients and time since diagnosis were 64 (31-84) years and 5.12 (0.77-23.77) years, respectively. Fifty-three percent of patients were men. The population was heavily pretreated; 76% of patients had received >3 prior lines of therapy, 91% were refractory to their last line of treatment, and 86% were refractory to both a PI and an IMiD. Additional patient characteristics for this combined data set are summarized in supplemental Table 1. The overall response rates were 36% in the GEN501 study18 and 29% in the SIRIUS study.19
Effect of daratumumab on regulatory cells expressing CD38
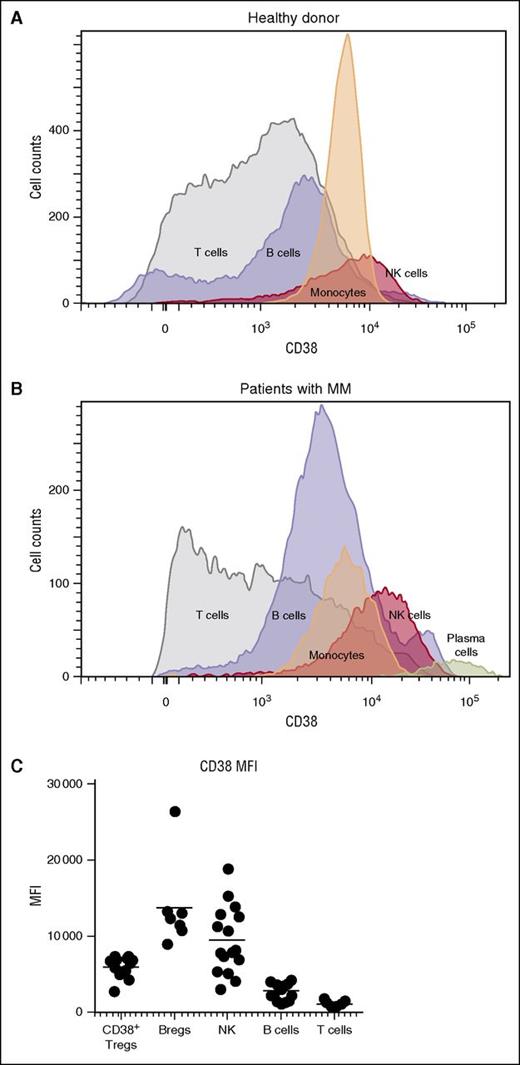
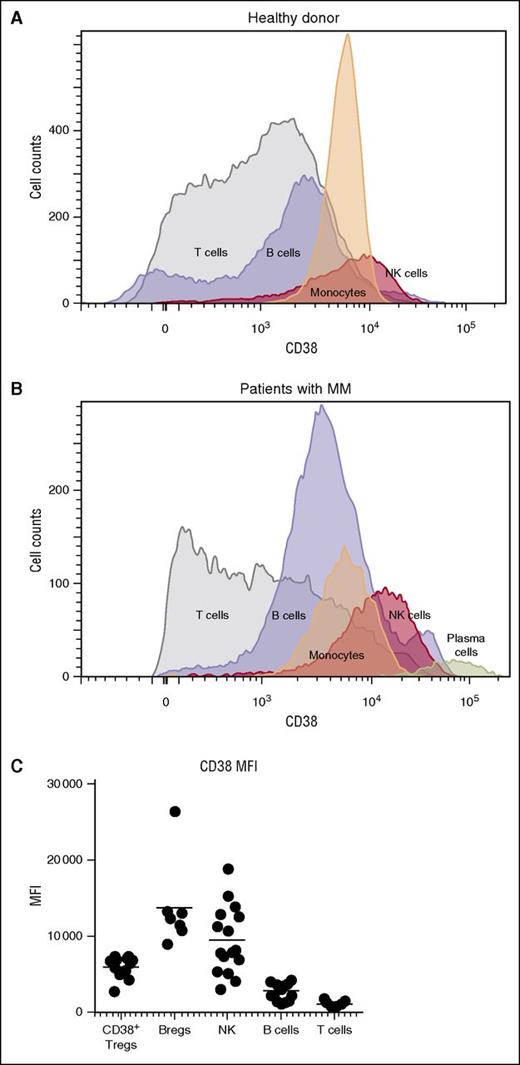
We confirmed the previously reported observation that CD38 was highly expressed on plasma cells of patients with MM,12 but was also present on natural killer (NK) cells, monocytes, B cells, and T cells in PBMCs of healthy donors (Figure 1A) and patients with MM (Figure 1B). A comparison of the mean fluorescent intensity of CD38 across these cellular populations showed that, after plasma cells, NK cells expressed the highest levels of CD38, followed by subpopulations of B and T cells (Figure 1C).
CD38 expression in various cell populations. Histograms show expression of CD38 in T cells, B cells, monocytes, and NK cells (A) in a healthy donor and (B) in a patient with MM. CD38 expression in plasma cells from the myeloma patient is also shown. (C) Subpopulations of NK cells, Tregs, Bregs, and MDSCs from relapsed and refractory myeloma patients expressed higher levels of CD38 compared with CD8+ and CD4+ T cells. MFI, mean fluorescent intensity.
CD38 expression in various cell populations. Histograms show expression of CD38 in T cells, B cells, monocytes, and NK cells (A) in a healthy donor and (B) in a patient with MM. CD38 expression in plasma cells from the myeloma patient is also shown. (C) Subpopulations of NK cells, Tregs, Bregs, and MDSCs from relapsed and refractory myeloma patients expressed higher levels of CD38 compared with CD8+ and CD4+ T cells. MFI, mean fluorescent intensity.
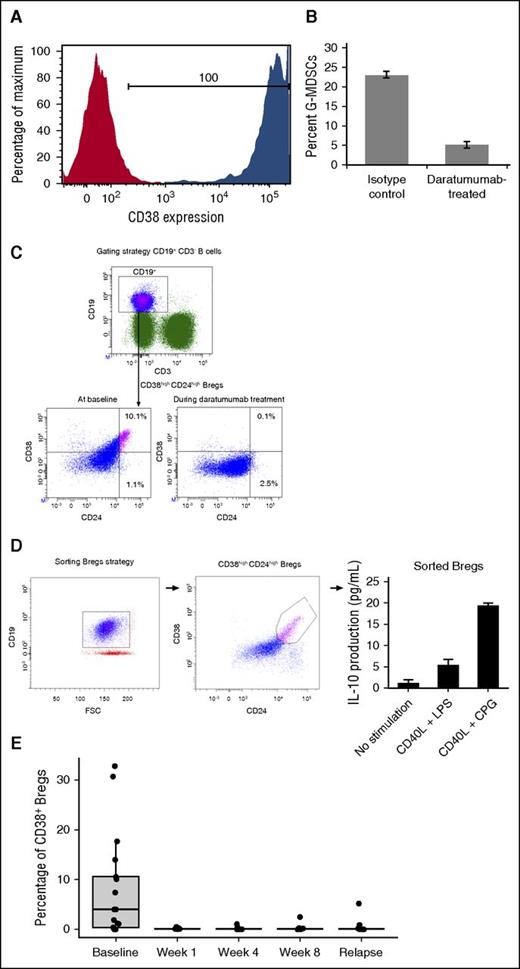
Given recent literature that indicated regulatory and suppressive immune populations like MDSCs and Bregs can express CD38,14,15 we evaluated these immune cells for their response to daratumumab treatment. Because MDSCs were not readily detectable in frozen PBMC samples,29 G-MDSCs (CD11b+CD14–HLA–DR–CD15+CD33+) were generated in vitro using a previously described coculture model.23 These G-MDSCs expressed elevated CD38 and were highly sensitive to daratumumab-mediated ADCC/CDC compared with an isotype control (Figure 2A-B). Bregs (CD19+CD24+CD38+) were measured in daratumumab-treated patients (n = 16; Figure 2C). These Bregs produced interleukin 10 (IL-10; Figure 2D), were reduced following the first dose of daratumumab (P = .0018 at week 1 compared with baseline), and remained low while patients were on treatment (Figure 2E).
Immunosuppressive cells express CD38 and are sensitive to daratumumab. G-MDSCs (CD11b+CD14–HLA–DR–CD15+CD33+) were generated from 6-day cocultures with healthy donor PBMCs and myeloma cell lines as previously described. G-MDSCs were sorted and evaluated for CD38 expression (red represents the isotype control and blue indicates the CD38+ staining) and (A) sensitivity to isotype or (B) daratumumab-mediated ADCC/CDC. (C) Bregs express CD38 and, when stimulated, (D) produced IL-10. (E) CD38+ Bregs decreased and remained depleted following daratumumab treatment.
Immunosuppressive cells express CD38 and are sensitive to daratumumab. G-MDSCs (CD11b+CD14–HLA–DR–CD15+CD33+) were generated from 6-day cocultures with healthy donor PBMCs and myeloma cell lines as previously described. G-MDSCs were sorted and evaluated for CD38 expression (red represents the isotype control and blue indicates the CD38+ staining) and (A) sensitivity to isotype or (B) daratumumab-mediated ADCC/CDC. (C) Bregs express CD38 and, when stimulated, (D) produced IL-10. (E) CD38+ Bregs decreased and remained depleted following daratumumab treatment.
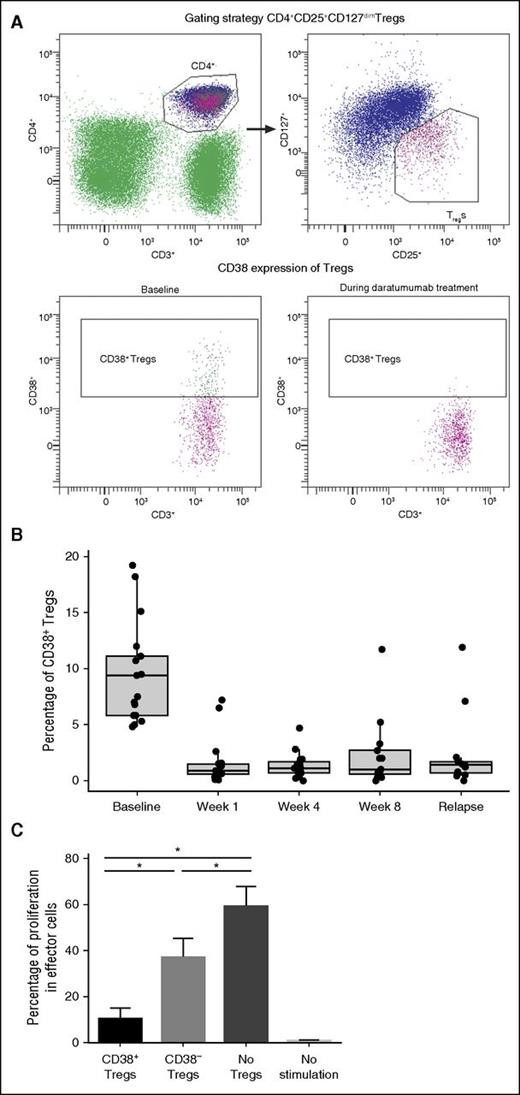
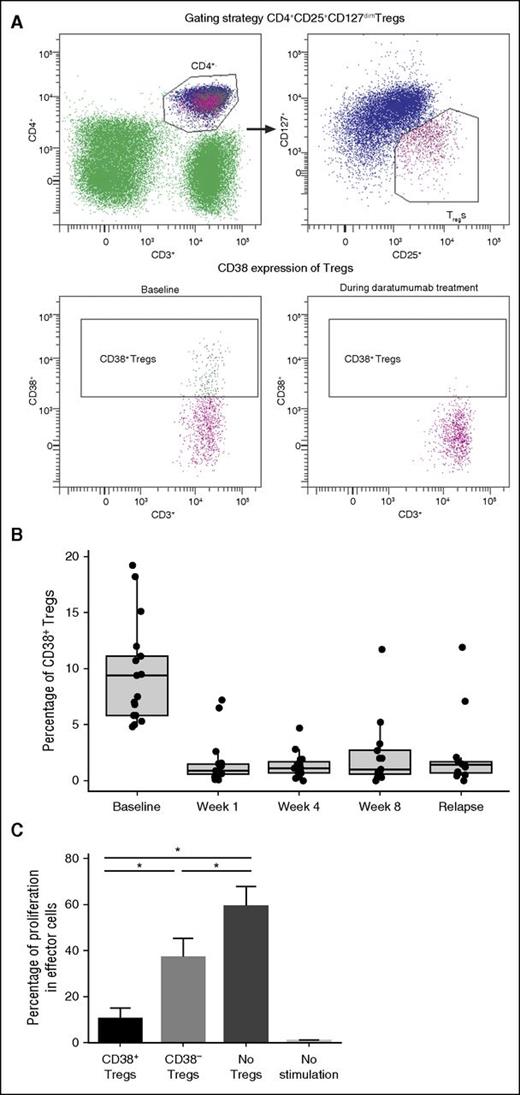
Given the high levels of CD38 expression in these immunosuppressive populations, we evaluated Tregs for expression of CD38 and sensitivity to daratumumab. A novel subpopulation (10 ± 10%) of peripheral Tregs (CD4+CD25+CD127dim) expressed high levels of CD38 prior to activation (Figure 3A). These CD38+ Tregs were highly sensitive to daratumumab treatment and exhibited a significant and almost immediate decline following the first dose of daratumumab (n = 17 patients; P = 8.88 × 10⁻¹⁶ at week 1 vs baseline). These CD38+ Tregs remained depleted throughout daratumumab treatment (P = 8.88 × 10⁻¹⁶, 1.11 × 10⁻¹⁵, and 1.50 × 10⁻¹¹ at weeks 1, 4, and 8, respectively, vs baseline; Figure 3B). In these studies, CD38 evaluation was performed using HuMax-003. It was confirmed that daratumumab did not interfere with the binding of HuMax-003 to CD38 that was expressed on total PBMCs, lymphocytes, monocytes, NK cells, or a CD38+ MM cell line (supplemental Figure 1).
Effect of daratumumab on CD38+ Tregs in PB. (A) In a representative experiment, the gating strategy of Tregs is shown (upper), and 18.2% of Tregs expressing CD38 were depleted after the first daratumumab infusion (lower). (B) CD38+ Tregs were reduced and remained low during weeks 1, 4, and 8 of daratumumab therapy. (C) In experiments performed on samples from multiple healthy donors, cell proliferation was assessed through the dilution of CFSE dye due to cell division; strong inhibition of cell division was observed in the presence of CD38+ Tregs, in contrast to the partial inhibition of proliferation observed in the presence of CD38− Tregs or negative controls. Error bars represent standard error. Asterisks denote significant changes.
Effect of daratumumab on CD38+ Tregs in PB. (A) In a representative experiment, the gating strategy of Tregs is shown (upper), and 18.2% of Tregs expressing CD38 were depleted after the first daratumumab infusion (lower). (B) CD38+ Tregs were reduced and remained low during weeks 1, 4, and 8 of daratumumab therapy. (C) In experiments performed on samples from multiple healthy donors, cell proliferation was assessed through the dilution of CFSE dye due to cell division; strong inhibition of cell division was observed in the presence of CD38+ Tregs, in contrast to the partial inhibition of proliferation observed in the presence of CD38− Tregs or negative controls. Error bars represent standard error. Asterisks denote significant changes.
To assess the possible biological relevance of CD38 expression in Tregs, we measured the suppressive capacity of CD38+ Tregs vs CD38− Tregs on autologous CD3+ T cells. In a series of experiments performed with samples from multiple healthy donors, CD38+ Tregs suppressed T-cell proliferation more robustly than CD38− Tregs or negative controls (Figure 3C).
Daratumumab induces helper and cytotoxic T-cell expansion
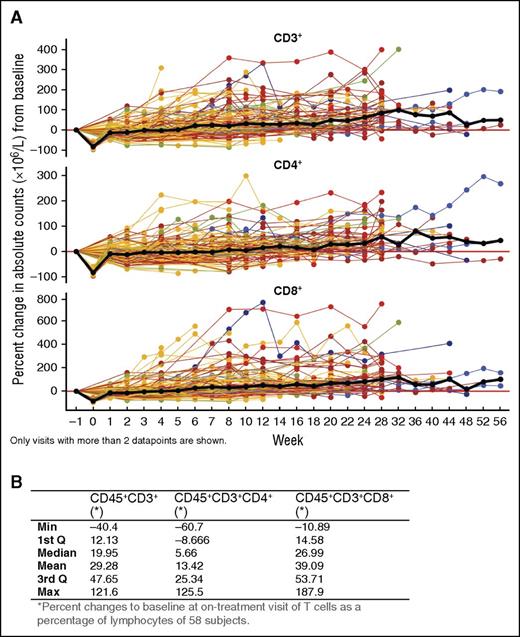
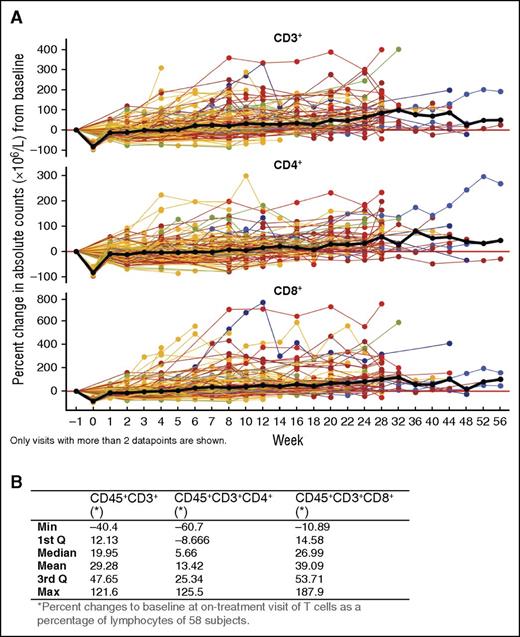
Given the reduction in CD38+ Tregs, Bregs, and MDSCs, we evaluated other lymphocyte populations. NK cells expressed the highest level of CD38 and were reduced with daratumumab treatment (T.C., unpublished data, October 1, 2015). B cells (CD19+) were maintained with daratumumab treatment and did not change significantly (data not shown). Interestingly, absolute counts for peripheral total CD3+ T cells, as well as CD4+ and CD8+ T-cell subsets, increased significantly with daratumumab 16-mg/mg treatment (CD3+: 0.16; 95% confidence interval [CI] = 0.14-0.19; CD4+: 0.12; 95% CI = 0.1-0.14; CD8+: 0.21; 95% CI = 0.17-0.25 on log scale per 100 days), which is equivalent to an average increase of ∼44%, 32%, and 62%, respectively, per 100 days (Figure 4A). Similar T-cell increases were observed in BM, with median maximal (range) increases from baseline in CD3+, CD4+, and CD8+ T-cell percentages of lymphocytes of 19.95% (−40.40% to 121.60%), 5.66% (−60.70% to 125.50%), and 26.99% (−10.89% to 187.90%), respectively (Figure 4B).
Effect of daratumumab treatment on helper and cytotoxic T-cell counts. (A) Longitudinal data representation of the percent change from baseline of absolute CD3+, CD4+, and CD8+ T-cell counts over time in PB; lines represent connected data points of individual patients that are colored by best overall clinical response: blue, sCR; orange, VGPR; brown, PR; yellow, SD; green, MR. The black bold line shows the overall median percent change over time. Only visits with >2 data points are shown. (B) Median (range) percent change from baseline in BM T cells (as a percentage of lymphocytes) of daratumumab-treated patient.
Effect of daratumumab treatment on helper and cytotoxic T-cell counts. (A) Longitudinal data representation of the percent change from baseline of absolute CD3+, CD4+, and CD8+ T-cell counts over time in PB; lines represent connected data points of individual patients that are colored by best overall clinical response: blue, sCR; orange, VGPR; brown, PR; yellow, SD; green, MR. The black bold line shows the overall median percent change over time. Only visits with >2 data points are shown. (B) Median (range) percent change from baseline in BM T cells (as a percentage of lymphocytes) of daratumumab-treated patient.
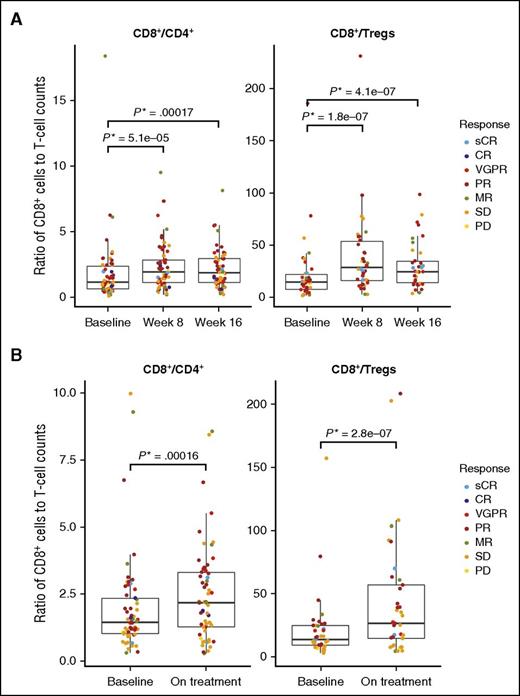
Ratios of CD8+:CD4+ and CD8+:Tregs were evaluated at baseline and at weeks 8 and 16 of treatment in the PB (Figure 5A) and at baseline and on treatment (week 12 ± 1 cycle) in BM (Figure 5B). The CD8+:CD4+ and CD8+:Treg ratios increased significantly over time in PB and BM with daratumumab treatment; no significant differences in CD8+:CD4+ or CD8+:Treg ratio were observed between responders and nonresponders. In PB, the median (range) ratio of CD8+:CD4+ T cells (n = 58) significantly increased at weeks 8 and 16: 1.99 (0.26-9.51; P = 5.1 × 10⁻⁵) and 1.92 (0.26-8.17; P = .00017), respectively, vs 1.21 (0.16-18.35) at baseline. Similar changes were observed for CD8+:Treg ratio (n = 38) at week 8 (29.21; 3.5-230.67; P = 1.7857 × 10⁻⁷) and week 16 (25.05; 4.33-98.91; P = 4.1245 × 10⁻⁷) vs 15.23 (2.33-185.5) at baseline. In the BM, the median (range) CD8+:CD4+ ratio (n = 58) increased from 1.46 (0.33-9.97) at baseline to 2.19 (0.30-8.56; P = .00016) at week 12 (±1 cycle). Similarly, CD8+:Treg ratios increased in the BM (n = 37) from 13.72 (3.06-157) at baseline to 26.57 (4.51-208.25; P = 2.7758 × 10⁻⁷) at week 12 (±1 cycle). In PB, a decrease in absolute Treg counts (including CD38+ and CD38– populations) occurred with daratumumab treatment (supplemental Figure 2A), suggesting that the observed reduction in CD38+ Tregs in response to daratumumab (supplemental Figure 2B) was due to an overall reduction in Tregs and not a downregulation in CD38 expression. CD8+:Treg ratios were significantly higher at week 8 in patients who showed a response to daratumumab (P = .00955; supplemental Figure 2C).
Ratio of CD8+ to CD4+ or Tregs over time. (A) Median ratios of CD8+:CD4+ (left; n = 58) and CD8+:Tregs (right; n = 38) increased at weeks 8 and 16 compared with baseline in the PB. Only patients with baseline, week 8, and week 16 measurements were included. (B) Similarly, in BM, median ratios of CD8+:CD4+ (left) and CD8+:Tregs (right) increased on treatment (week 12 ± 1 cycle) compared with baseline. No significant differences were observed between responders and nonresponders.
Ratio of CD8+ to CD4+ or Tregs over time. (A) Median ratios of CD8+:CD4+ (left; n = 58) and CD8+:Tregs (right; n = 38) increased at weeks 8 and 16 compared with baseline in the PB. Only patients with baseline, week 8, and week 16 measurements were included. (B) Similarly, in BM, median ratios of CD8+:CD4+ (left) and CD8+:Tregs (right) increased on treatment (week 12 ± 1 cycle) compared with baseline. No significant differences were observed between responders and nonresponders.
The median maximum percent increases in total CD3+, CD4+, and CD8+ T-cell counts were higher in patients who responded to treatment (n = 45) compared with those who did not respond (n = 93; supplemental Figure 3A). The median (range) percent increases from baseline of total CD3+, CD4+, and CD8+ T cells in patients who responded to daratumumab compared with those who did not were 86.76% (−16.1% to 398.71%) compared with 35.44% (−67.11% to 400.47%; P = .00012); 56.16% (−21.05% to 296.00%) compared with 26.97% (−68% to 298.89%; P = .00031), and 111.99% (−7.07% to 760.51%) compared with 42.5% (−66.22% to 589.12%; P = .00018), respectively (supplemental Figure 3A; supplemental Table 2). However, statistical significance is confounded by interactions between time and clinical response because patients who responded to daratumumab were observed for longer than those who did not respond (supplemental Figure 3B).
In a more detailed analysis of a subset of 17 patients enrolled in the GEN501 study, levels of peripheral HLA-DR+ CD8+ T cells were significantly increased during daratumumab treatment compared with baseline (supplemental Figure 4A; P = 1.25 × 10⁻⁵ at week 8) and declined when patients relapsed. This was accompanied by a decrease in the quantity of naive CD8+ T cells (supplemental Figure 4B; P = 1.82 × 10⁻⁴) and a concomitant increase in the quantity of CD8+ effector memory T cells (supplemental Figure 4C; P = 4.88 × 10⁻²). These expanding effector memory T cells expressed low levels of CD38 (supplemental Figure 4D). At relapse, the quantity of naive CD8+ T cells was similar compared with those at week 8, whereas CD8+ effector memory T cells returned to baseline levels (supplemental Figure 4B-C; P = .3 and 1, respectively). In addition, a significantly greater decrease in CD8+-naive T cells was apparent in patients who responded to treatment (P = .046 at week 8).
To assess daratumumab’s effects on T-cell activation and functionality, IFN-γ production from peripheral T cells in response to viral and alloantigens was measured in daratumumab-treated patients (n = 7) with a range of clinical outcomes (supplemental Figure 5A). Patients with a PR or better demonstrated significant increases in IFN-γ secretion in response to viral and alloantigens following daratumumab treatment, compared with baseline, for ≥1 time point during treatment, suggesting that T-cell function is not impaired by low CD38 expression. This increase appeared to be more marked in patients who responded to daratumumab than in those who did not. Consistent with these results, virus-reactive T cells demonstrated an increase in proliferative capacity during daratumumab treatment (supplemental Figure 5B).
Daratumumab skews the T-cell repertoire and increases TCR clonality
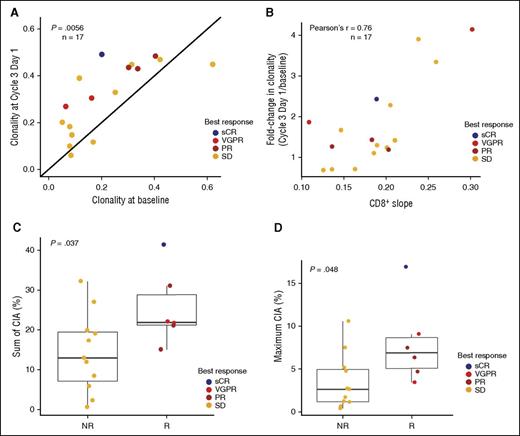
To investigate whether the observed T-cell expansion was clonal in nature, TCR clonality was assessed in a subset of patients (n = 17) through PCR/next-generation sequencing. TCR clonality increased significantly during daratumumab treatment in the majority of patients measured (14 of 17 = 82%; P = .0056; Figure 6A). Interestingly, the TCR clonality change observed on treatment was positively correlated with the increase in CD8+ T cells (Pearson's r = 0.76; Figure 6B). In addition, patients who responded to daratumumab had significantly greater increases in the sum of change in abundance (CIA) for each expanded T-cell clone in the TCR repertoire (P = .037; Figure 6C), as well as greater maximum CIA of individual clones (P = .048; Figure 6D) compared with patients without a clinical response.
Effect of daratumumab treatment on T-cell clonality. Patients with pre- and posttreatment samples were evaluated (n = 17). TCR clonality (A) increased during treatment with daratumumab and (B) was correlated with increases in CD8+ T cells. The sum of absolute CIA in responders and nonresponders is shown (C) for each expanded T-cell clone and (D) maximum CIA of a single T-cell clone. NR, nonresponder; R, responder.
Effect of daratumumab treatment on T-cell clonality. Patients with pre- and posttreatment samples were evaluated (n = 17). TCR clonality (A) increased during treatment with daratumumab and (B) was correlated with increases in CD8+ T cells. The sum of absolute CIA in responders and nonresponders is shown (C) for each expanded T-cell clone and (D) maximum CIA of a single T-cell clone. NR, nonresponder; R, responder.
Discussion
Daratumumab, the first monoclonal antibody approved for use in myeloma, has demonstrated promising activity as a monotherapy in patients with relapsed and refractory myeloma. Overall response rates were 36% and 29% in GEN501 and SIRIUS, respectively, in heavily treated patients administered daratumumab 16-mg/kg monotherapy and included rapid responses that deepened over time to include VGPRs, CRs, and sCRs.18,19 Responses were durable; among patients receiving daratumumab 16-mg/kg monotherapy, the median durations of response were 6.9 and 7.4 months.18,19 This study describes previously unknown immunomodulatory effects of daratumumab through reduction of CD38+ immunosuppressive cellular populations and concomitant induction of helper and cytotoxic T-cell expansion, production of IFN-γ in response to viral peptides, and increased TCR clonality, indicating an improved adaptive immune response. The extent of direct antitumor responses arising as a result of this adaptive response remains to be determined, along with their contribution to clinical responses.
Concurrent with recent literature,14,15 this study demonstrates that, in the myeloma setting, MDSCs and Bregs express CD38 and, in addition, were susceptible to daratumumab treatment. These cells are known to be present in the tumor microenvironment and contribute to tumor growth, immune evasion, angiogenesis, metastasis, and production of suppressive cytokines.30 In addition to these CD38+ suppressive cellular subsets, a novel subpopulation of Tregs (CD4+CD25+CD127dim) was identified that also expressed high levels of CD38 and demonstrated superior autologous T-cell suppressive capacities. These cells were also sensitive to daratumumab and were significantly reduced in patients receiving treatment. Daratumumab-mediated elimination of these CD38+ immune regulatory cells may reduce local immune suppression within the myeloma microenvironment and allow positive immune effector cells to expand and contribute to antitumor response.
Indeed, significant increases in broad T-cell populations, including both CD4+ and CD8+, were observed in PB and within the tumor (ie, the BM). As would be expected for this heavily pretreated population, there was broad interpatient variability in response to daratumumab. Specific CD8+ subpopulations were altered with daratumumab therapy, including significant decreases in naive T cells and concomitant significant increases in effector memory CD8+ T cells, indicating a shift in effector T cells toward an antigenic experienced phenotype that retained immunologic memory and may be reactive against tumor antigens. Ratios of CD8+:CD4+ and CD8+:Tregs also increased significantly with treatment, demonstrating a shift in positive vs negative immune regulators.
To evaluate whether expanded CD4+ and CD8+ T cells were clonal in nature, the T-cell repertoire was examined in a subset of patients. T-cell clonality significantly increased with daratumumab treatment, even in patients who had a best response of SD or who progressed. Therefore, increased T-cell clonality cannot be due simply to reduction in tumor burden. However, the skew in T-cell clonality was greater in patients with a good clinical response and was correlated with the increase in CD8+ T cells, suggesting the observed T-cell expansion with daratumumab treatment was antigen driven. This is remarkable in this patient population, which was heavily pretreated (median of 5 prior lines of therapy) and was not expected to be able to mount a strong antitumor immune response. In addition to increased TCR clonality, patients with a response to daratumumab demonstrated increased T-cell responses to preexisting viral and alloantigens, suggesting the rescue of the immune system from an immunosuppressive state. Future clinical studies will evaluate the antimyeloma effects of expanded T cells following daratumumab treatment.
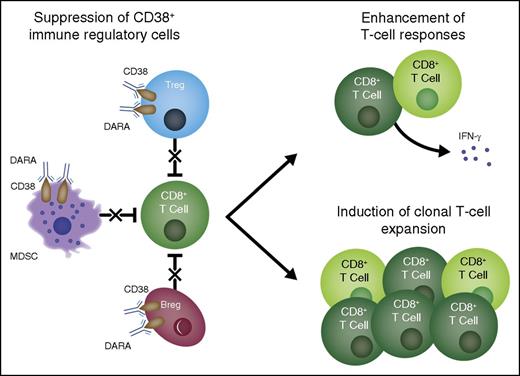
Treatment with daratumumab caused a reduction in immunosuppressive MDSCs, Tregs, and Bregs, although not all MDSC subtypes were evaluated due to limitations in the clinical samples collected. Ongoing clinical studies are focused on appropriate sample collection and further evaluation of daratumumab’s effects on additional subtypes of regulatory cellular populations. The reductions in MDSCs, Tregs, and Bregs described here were concomitant with an expansion of CD4+ T-helper cells and CD8+ cytotoxic T cells. T-cell clonality and functional antiviral responses, as measured by IFN-γ production, also increased with daratumumab treatment. These observations indicate that T cells continued to function properly, despite low CD38 expression, and suggest that increased T-cell response may be due to depletion of regulatory cells. Further, these changes in T-cell expansion, activity, and clonality were more pronounced in patients who responded to daratumumab compared with those who did not. Relapse from daratumumab therapy was associated with the reversal of many of these changes. This suggests an additional, previously uncharacterized mechanism of action of daratumumab through immunomodulation that may contribute to clinical responses and its efficacy in such a heavily treated patient population (Figure 7).19 Whether these immune effects result in targeted antimyeloma T-cell reactivity or represent a more generalized T-cell response will need to be addressed in future studies.
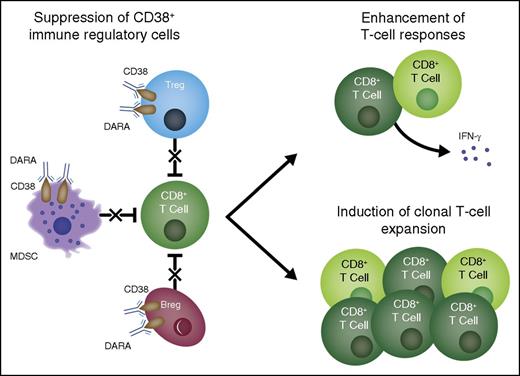
Multifactorial mechanism of action of daratumumab. Daratumumab induces antimyeloma effects via multiple mechanisms of action. Based on the present study, an additional mechanism of action is proposed in which treatment with daratumumab eliminates a population of highly immunosuppressive CD38+ Tregs, T-cell MDSCs, and Bregs and thus stimulates T-cell effector functions. DARA, daratumumab.
Multifactorial mechanism of action of daratumumab. Daratumumab induces antimyeloma effects via multiple mechanisms of action. Based on the present study, an additional mechanism of action is proposed in which treatment with daratumumab eliminates a population of highly immunosuppressive CD38+ Tregs, T-cell MDSCs, and Bregs and thus stimulates T-cell effector functions. DARA, daratumumab.
Recently, antibodies that promote antitumor immune responses, rather than targeting the cancer directly, have demonstrated efficacy in a range of settings. Antibodies inhibiting cytotoxic T-lymphocyte–associated antigen 4 and programmed cell death protein 1 promote T-cell expansion and enhance T-cell activation, respectively, resulting in prolonged survival and delayed disease recurrence in patients with advanced solid tumors and hematologic malignancies such as Hodgkin lymphoma.31-35 By enhancing anticancer immunity, these immunomodulatory antibodies may not only induce clinical responses, but also prevent disease recurrence.36 Interestingly, these agents have not demonstrated efficacy as monotherapies in MM, suggesting that enhancing immune function, while at the same time targeting malignant cells, may be required to maintain long-term clinical responses in MM.
In conclusion, these data suggest a previously unknown, multidimensional, immunomodulatory role for daratumumab that may contribute to deeper clinical responses and enhanced survival. Future studies will be needed to determine whether these expanded T cells are active against tumor-specific targets and what role these immunomodulatory effects play in overall clinical response. In addition, these data suggest a broader immune regulatory role of CD38 that may be applicable in other malignancies.
The online version of this article contains a data supplement.
The publication costs of this article were defrayed in part by page charge payment. Therefore, and solely to indicate this fact, this article is hereby marked “advertisement” in accordance with 18 USC section 1734.
Acknowledgments
The authors thank the patients who participated in the GEN501 and SIRIUS studies and their families, as well as the study coinvestigators, research nurses, and coordinators at each of the clinical sites. The authors acknowledge Huaibao Feng for his contributions to data analyses. Medical writing and editorial support, provided by Erica S. Chevalier-Larsen, and Christopher J. Jones, of MedErgy, were funded by Janssen Global Services, LLC.
The clinical studies were supported by research funding from Janssen Research & Development and Genmab, and the analyses presented here were supported by research funding by Janssen Research & Development.
Authorship
Contribution: J.K. contributed to the accrual and treatment of patients and data acquisition, interpretation, and analysis; T.C. contributed data acquisition, interpretation, and analysis; I.S.N. contributed to the accrual and treatment of patients and data acquisition, interpretation, and analysis; B.V. contributed to data interpretation and analysis; J.B. contributed to data acquisition, interpretation, and analysis; T.P. contributed to the accrual and treatment of patients and data interpretation and analysis; K.S. contributed to data acquisition, interpretation, and analysis; K.L. contributed to data interpretation and analysis; N.W.C.J.v.d.D. contributed to the accrual and treatment of patients and data acquisition, interpretation, and analysis; B.M.W. contributed to the accrual and treatment of patients and data acquisition, interpretation, and analysis; T.A. contributed to data acquisition, interpretation, and analysis; H.M.L. contributed to the accrual and treatment of patients and data acquisition, interpretation, and analysis; T.M. contributed to the scientific literature search and data acquisition, interpretation, and analysis; A.K.S. contributed to the scientific literature search and data acquisition, interpretation, and analysis; and all authors drafted and reviewed the manuscript, approved the final version, decided to publish this report, and vouch for data accuracy and completeness.
Conflict-of-interest disclosure: T.C. is an employee of Janssen Research & Development. B.V. is an employee of Janssen Research & Development. J.B. is an employee of Janssen Research & Development. T.P. received honoraria from Janssen, Celgene, and Genmab and research funding from Janssen, Celgene, Roche, and Novartis. K.S. is an employee of Janssen Research & Development. K.L. is an employee of Janssen Research & Development. N.W.C.J.v.d.D. received research funding from Janssen, Celgene, and Amgen. B.M.W. received honoraria from Janssen, Millennium, and Prothena and research funding from Janssen and Prothena. T.A. is an employee of Janssen Research & Development. H.M.L. received honoraria from Janssen, Amgen, and Genmab and research funding from Janssen and Genmab. T.M. received research funding from Janssen and Genmab. A.K.S. is an employee of Janssen Research & Development. All other authors declare no competing financial interests.
Correspondence: A. Kate Sasser, Janssen Research & Development, LLC, 1400 McKean Rd, Spring House, PA 19477; e-mail: ksasser1@its.jnj.com.
References
Author notes
J.K. and T.C. contributed equally to this work.
T.M. and A.K.S. contributed equally to this work.

