Key Points
Clot contraction has 3 phases differentially affected by platelet and fibrin mechanics, RBC compaction, and various blood components.
A new dynamic quantitative clot contraction assay can reveal novel aspects of formation and evolution of hemostatic clots and thrombi.
Abstract
Platelet-driven blood clot contraction (retraction) is thought to promote wound closure and secure hemostasis while preventing vascular occlusion. Notwithstanding its importance, clot contraction remains a poorly understood process, partially because of the lack of methodology to quantify its dynamics and requirements. We used a novel automated optical analyzer to continuously track in vitro changes in the size of contracting clots in whole blood and in variously reconstituted samples. Kinetics of contraction was complemented with dynamic rheometry to characterize the viscoelasticity of contracting clots. This combined approach enabled investigation of the coordinated mechanistic impact of platelets, including nonmuscle myosin II, red blood cells (RBCs), fibrin(ogen), factor XIIIa (FXIIIa), and thrombin on the kinetics and mechanics of the contraction process. Clot contraction is composed of 3 sequential phases, each characterized by a distinct rate constant. Thrombin, Ca2+, the integrin αIIbβ3, myosin IIa, FXIIIa cross-linking, and platelet count all promote 1 or more phases of the clot contraction process. In contrast, RBCs impair contraction and reduce elasticity, while increasing the overall contractile stress generated by the platelet-fibrin meshwork. A better understanding of the mechanisms by which blood cells, fibrin(ogen), and platelet-fibrin interactions modulate clot contraction may generate novel approaches to reveal and to manage thrombosis and hemostatic disorders.
Introduction
Bleeding and thrombotic vascular occlusion are predominant causes of death and disability.1,2 Much is understood about the initial steps of blood clot formation and the processes that limit its propagation and promote dissolution. In contrast, little is known about the processes that regulate clot contraction (retraction). Clot contraction is the active squeezing of a clot that reduces its volume3,4 preventing blood loss5 and restoring blood flow past otherwise obstructive thrombi.6 The importance of clot contraction is most evident in disorders that affect the platelet’s ability to generate nonmuscle myosin-driven contractile forces, such as MYH9 defects, which result in increased bleeding and decreased thrombus stability associated with a reduced extent of clot contraction notwithstanding normal platelet aggregation and secretion in response to agonists.7 The multiplicity of factors that can affect clot contraction is exemplified by their impact on alterations in fibrin structure. For example, factor XIII (FXIII) deficiency, where fibrin cross-linking is defective, can impair wound healing and lead to premature clot lysis and bleeding.8 Some forms of dysfibrinogenemias also lead to bleeding, whereas others predispose to thrombosis as a result of abnormal polymerization that may affect contraction.9 However, the role of clot contraction in the development of thrombotic vascular occlusion and resistance to endogenous and exogenous thrombolysis has only recently been explored.10
Clot contraction is driven by platelet-generated contractile forces5 that are propagated through the platelet-fibrin meshwork11 and result in the expulsion of serum.4 Platelets contract because of the interaction of actin5 and nonmuscle myosin IIa, which is initiated when platelets are activated by various stimuli, including thrombin.12,13 Thrombin converts fibrinogen to fibrin, which assembles into a highly elastic polymeric network,14-16 to which platelets attach through the integrin αIIbβ3.17,18 The mechanical properties of fibrin depend on cross-linking by FXIIIa.19 FXIIIa is required for clot contraction to occur,20 in part by mediating translocation of fibrin to sphingomyelin-rich rafts where it is able to colocalize with myosin and αIIbβ3.19 In addition, FXIII cross-linking has been shown to be important for red blood cell (RBC) retention in contracted blood clots.21,22
RBCs comprise a substantial portion of thrombus mass, especially those formed in veins.23 In a number of pathological conditions, such as sickle cell disease (SCD), an increased risk of thrombosis is associated with increased RBC membrane rigidity.1,24,25 However, evidence on the role of RBCs in clot contraction is only beginning to emerge. The contractile forces generated by the platelet-fibrin meshwork tightly pack and compress RBCs, resulting in a shape change from biconcave to polyhedral (called polyhedrocytes).26 This deformation of RBCs was observed in vitro as well as in thrombi from patients with ST-elevation myocardial infarction.26,27 Compaction of RBCs may help seal the clot but may also impair permeability to plasminogen activators, contributing to fibrinolysis resistance. The converse process (ie, the effect of RBCs on clot contraction) has received little or no investigation.
Notwithstanding the implied medical and biological importance of clot contraction, gaps in our understanding can be attributed, at least in part, to a lack of methodology to quantify the dynamics of the process. In this work, we continuously tracked clot shrinkage in vitro, which, in combination with rheometry, provided detailed quantitative information on the dynamics of clot contraction. The kinetics of clot contraction was found to be triphasic, and by varying the cellular composition, coagulation factors, and fibrin structure, the effect of blood composition on each of the phases of clot contraction could be followed. Detailed kinetic and mechanical characterization of the process of clot contraction presents the opportunity to better identify its role in thrombotic vascular occlusion and to develop novel and targeted approaches to promote hemostasis and prevent thrombosis.
Materials and methods
Continuous optical tracking of contracting clots
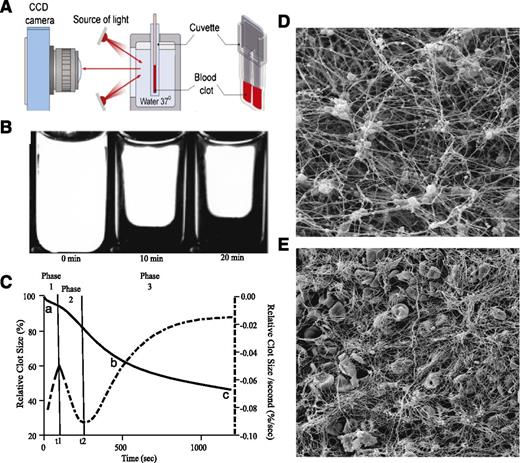
Clot size dynamics were tracked by measuring light scattering over time followed by computational processing of the serial images using a Thrombodynamics Analyzer System (HemaCore, Moscow, Russia) (Figure 1). Plastic cuvettes (12 × 7 × 1 mm) were prelubricated with a residual layer of 4% (volume to volume ratio) Triton X-100 in phosphate-buffered saline to prevent fibrin sticking to the chamber. Samples were incubated with CaCl2 (2 mM final concentration) at 37°C for 3 minutes followed by addition of 1 U/mL thrombin to initiate clotting. Samples (80 µL) were quickly transferred to the cuvette, which was placed into the thermostatic chamber (37°C) between a red light-emitting diode and a CCD camera (Figure 1A). Clot size was tracked from digitized images every 15 seconds for 20 minutes (Figure 1B). Subsequently, images were analyzed computationally to measure lag time (time to 95% of relative clot size; Figure 1C, a), area under the curve (AUC; Figure 1C, b), relative clot size at end point (Figure 1C, c), and average velocity (average of first derivative at each time point).
Schematic of the optical analyzer system. (A) Blood samples were added to the cuvette and allowed to clot. The cuvette was placed in the thermostat and exposed to light every 15 seconds, and images were recorded using a charge-coupled device (CCD) camera. (B) Images of blood clots during the process of contraction. (C) Data on clot size were compiled into a time course (kinetic) curve (solid line) with the following parameters extracted: lag time – time to 95% relative clot size (a), AUC (b), and final degree of contraction (c). The original curve of kinetics is segregated to the 3 parts (phase 1, phase 2, and phase 3) determined by assessing the local maximum and minimum of the instantaneous first derivative (dashed). Phase 1 shows the initial exponential phase of contraction; k1 is the rate constant associated with this phase of contraction. Phase 2 shows the middle linear region of contraction; k2 corresponds to the slope or rate of contraction in this region. Phase 3 shows the final phase of contraction, an exponential phase, and k3 corresponds to rate constant at which this decay occurs. Scanning electron microscopy was used to visually compare the ultrastructures of contracted blood clots in platelet-rich plasma (PRP) (D) and whole blood (E). Note that in PRP (D) fibrin fibers radiate from platelet aggregates and form bundles that likely propagate tension produced by the contracting platelets. In whole blood (E), the regular platelet-fibrin meshwork is partially impaired by RBCs that change the ability of fibrin to propagate the contractile force generated by platelets.
Schematic of the optical analyzer system. (A) Blood samples were added to the cuvette and allowed to clot. The cuvette was placed in the thermostat and exposed to light every 15 seconds, and images were recorded using a charge-coupled device (CCD) camera. (B) Images of blood clots during the process of contraction. (C) Data on clot size were compiled into a time course (kinetic) curve (solid line) with the following parameters extracted: lag time – time to 95% relative clot size (a), AUC (b), and final degree of contraction (c). The original curve of kinetics is segregated to the 3 parts (phase 1, phase 2, and phase 3) determined by assessing the local maximum and minimum of the instantaneous first derivative (dashed). Phase 1 shows the initial exponential phase of contraction; k1 is the rate constant associated with this phase of contraction. Phase 2 shows the middle linear region of contraction; k2 corresponds to the slope or rate of contraction in this region. Phase 3 shows the final phase of contraction, an exponential phase, and k3 corresponds to rate constant at which this decay occurs. Scanning electron microscopy was used to visually compare the ultrastructures of contracted blood clots in platelet-rich plasma (PRP) (D) and whole blood (E). Note that in PRP (D) fibrin fibers radiate from platelet aggregates and form bundles that likely propagate tension produced by the contracting platelets. In whole blood (E), the regular platelet-fibrin meshwork is partially impaired by RBCs that change the ability of fibrin to propagate the contractile force generated by platelets.
Rheometry of contracting clots
Reconstituted samples activated with thrombin and CaCl2 were placed in a rheometer (ARG2; TA Instruments, New Castle, DE), and the mechanical properties of the blood clot were tracked from the onset of coagulation through clot contraction. Low oscillatory strain (3%, 5 rad/s) was applied using a 20-mm parallel plate to measure the storage (G′) and loss (G′′) moduli, which correspond to the elastic and viscous properties of the clot, respectively (supplemental Figure 1A-C; available on the Blood Web site). As the clot polymerized in a 400-µm gap between the top and bottom plates, the contractile force generated by the platelet-fibrin meshwork was measured as the negative normal (perpendicular) force on the plates (supplemental Figure 1D-F).
Phase kinetic analysis of clot contraction
Transitions between different phases of contraction were determined by finding local maxima and minima points within the instantaneous first derivative of kinetic and normal force curves (Figure 1C). Curves were fit using GraphPad Prism 5.0 using a piecewise function, and the rate parameters and extent of contraction in each phase were determined (supplemental Methods).
Results
Optimization of in vitro clot contraction using thrombin and calcium chloride
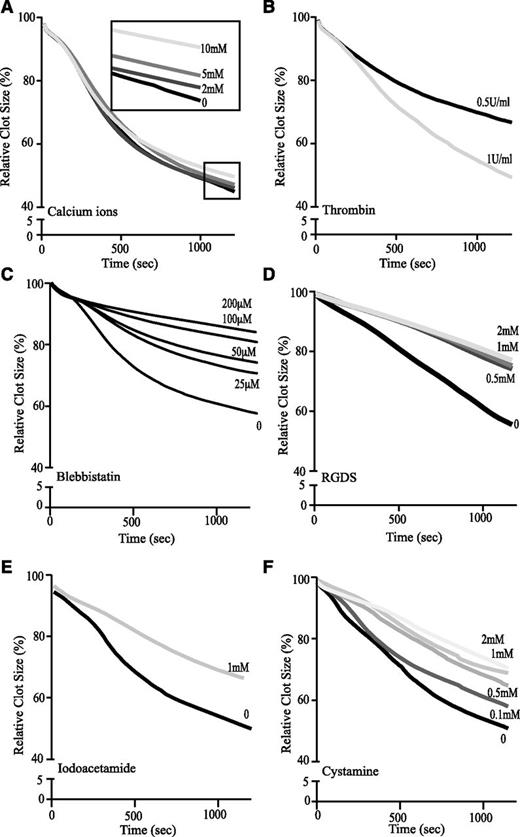
As both thrombin and CaCl2 have been shown to impact platelet contraction,12,28 we varied the concentration of each to determine optimal conditions for subsequent experiments (Figure 2A). The final CaCl2 concentration was varied from 0 to 10 mM in citrated whole blood samples, and clotting was initiated by addition of 1 U/mL thrombin. Exogenous Ca2+ was not required for clot formation and contraction to occur. However, when clots were formed in the absence of CaCl2, a portion of the incorporated RBCs were seen to fall out of clots in one-third of the samples (8 of 25) as contraction progressed and changes in clot size were tracked (supplemental Figure 2). Addition of 2 mM and 5 mM CaCl2 did not significantly impact the ability of the clot to contract but did stabilize clot structure and eliminate RBC fallout (Figure 2A; Table 1; supplemental Figure 2). No escape of RBCs from the clot was visualized in the presence of CaCl2 at any thrombin concentration. Addition of 0.5 U/mL of thrombin resulted in a significant decrease in the average velocity, AUC, and final extent of contraction compared with 1 U/mL thrombin (Figure 2B; Table 1). Thrombin concentrations at and <0.5 U/mL resulted in RBC settling, which introduced delay and nonuniform spatial contraction. Based on these results, clot contraction was initiated with 2 mM CaCl2 and 1 U/mL thrombin in all subsequent experiments, unless otherwise noted. These conditions allowed for fast, uniform, and stable clot formation and contraction.
Kinetics of clot contraction in whole blood. Curves tracking changes in the size of contracting clots formed in citrated whole blood. (A) Samples were clotted with 1 U/mL thrombin in the presence of 0, 2, 5, and 10 mM CaCl2. (B) Samples were clotted with 0.5 or 1 U/mL of thrombin and 2 mM CaCl2. (C-F) Samples were clotted with 1 U/mL and 2 mM CaCl2. (C) Myosin IIA was inhibited through the addition of blebbistatin at 25, 50, 100, and 200 μM final concentrations. (D) Fibrin-platelet interactions were impaired by adding RGDS at 0.5, 1, and 2 mM final concentrations. (E, F) Cross-linking of fibrin was suppressed with 1 mM iodoacetamide (E) and 0.1, 0.5, 1.0, and 2.0 mM cystamine (F).
Kinetics of clot contraction in whole blood. Curves tracking changes in the size of contracting clots formed in citrated whole blood. (A) Samples were clotted with 1 U/mL thrombin in the presence of 0, 2, 5, and 10 mM CaCl2. (B) Samples were clotted with 0.5 or 1 U/mL of thrombin and 2 mM CaCl2. (C-F) Samples were clotted with 1 U/mL and 2 mM CaCl2. (C) Myosin IIA was inhibited through the addition of blebbistatin at 25, 50, 100, and 200 μM final concentrations. (D) Fibrin-platelet interactions were impaired by adding RGDS at 0.5, 1, and 2 mM final concentrations. (E, F) Cross-linking of fibrin was suppressed with 1 mM iodoacetamide (E) and 0.1, 0.5, 1.0, and 2.0 mM cystamine (F).
The role of platelet contractile proteins in clot contraction
Contraction has been shown to depend on the development of actin-myosin interactions.6,19,29,30 To assess the contribution of nonmuscle myosin IIA in volume shrinkage within our system, we performed experiments in the presence of blebbistatin, a selective inhibitor of myosin II.31 Addition of 25 to 200 μM blebbistatin resulted in a dose-dependent decrease in the extent and average velocity of contraction (Figure 2C; Table 1), which confirms that clot contraction is driven by platelet contractile proteins.
The role of platelet-fibrin interactions in clot contraction
Platelet integrin αIIbβ3 has been shown to be important in development of clot tension in the presence of washed platelets and in PRP via its interaction with fibrin in vitro,19,32-34 as well as in vivo in mice.3 To test if the αIIbβ3-fibrin(ogen) or other integrin-mediated interactions affect the rate and extent of clot contraction, experiments were performed with increasing concentrations of Arg-Gly-Asp-Ser (RGDS) peptide, inhibiting fibrin(ogen) binding. Addition of 0.5 mM RGDS peptide decreased the average velocity, AUC, and extent of clot contraction, likely by competitively blocking platelet-fibrin interactions mediated by αIIbβ3. Further increases in RGDS to 2 mM did not show a greater effect (Figure 2D; Table 1), suggesting that additional platelet-fibrin binding sites are also involved in clot contraction.
The role of fibrin cross-linking in clot contraction
To assess the role of fibrin cross-linking in clot contraction, iodoacetamide, an inhibitor of FXIIIa, was added to blood prior to CaCl2 and thrombin, which caused a significant decrease in the average velocity, AUC, and extent of clot contraction (Figure 2E; Table 1). To confirm the specific role of FXIIIa cross-linking, cystamine, another transglutaminase inhibitor that blocks FXIIIa activity as a competitive substrate, unlike iodoacetamide, which blocks FXIIIa activity by alkylation, was also used. Cystamine, like iodoacetamide, caused a dose-dependent decrease in the average velocity and extent of clot contraction (Figure 2F; Table 1). In addition to slowing the overall kinetics of contraction, both inhibitors of FXIIIa also affected the individual phases of the process as described (Table 2).
Platelet count and fibrinogen levels have opposing effects on the extent of clot contraction
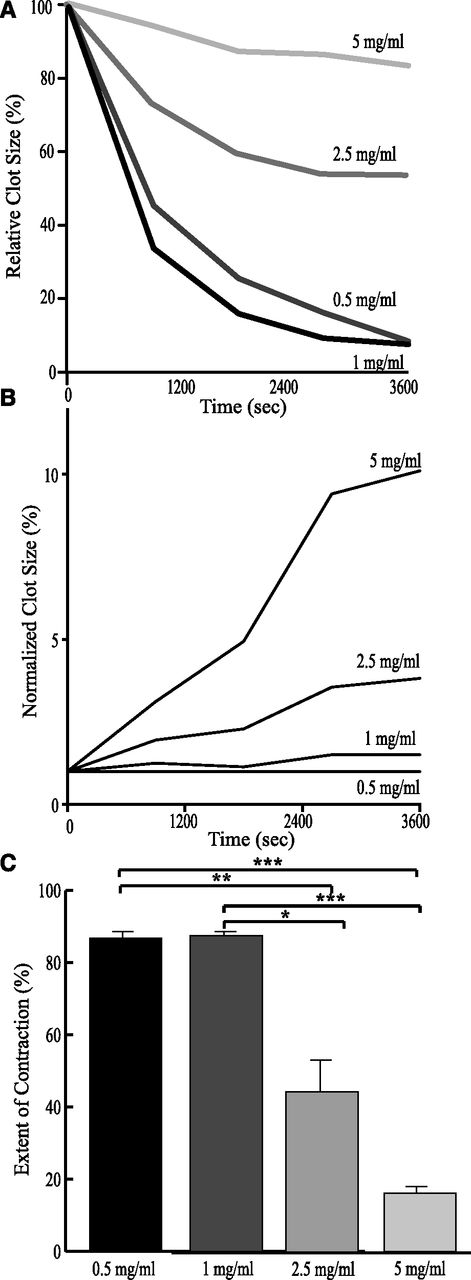
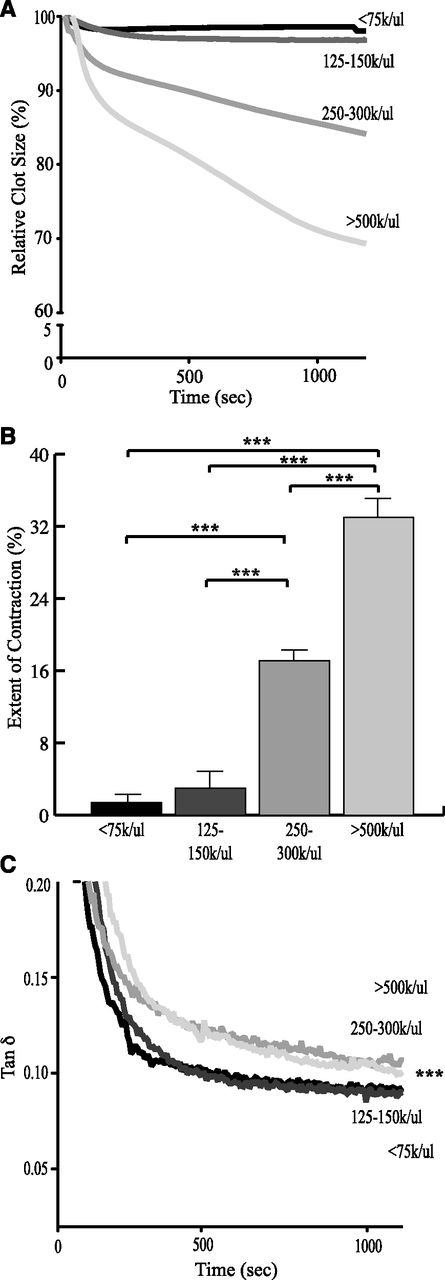
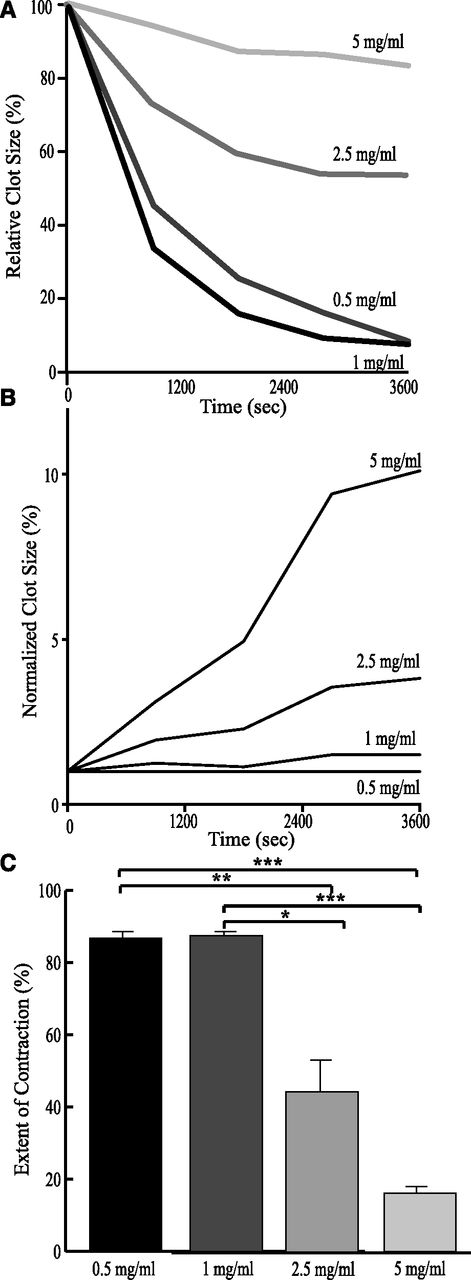
Because platelets and fibrin interact during the process of clot contraction (Figure 1D),35 we investigated the independent contribution of each. Isolated platelets were resuspended in varying amounts of platelet-free plasma (PFP), to maintain constant fibrinogen level. At platelet counts <150 000/µL, contraction was barely detectable (Figure 3A). When the platelet count was increased to 250 000 to 300 000/µL, total contraction increased 12-fold relative to identical experiments performed at platelet counts <75 000/µL (Figure 3A-B). At platelet counts >500 000/µL, there was a 23-fold increase in the extent of contraction. To assess the role of fibrin(ogen) concentration, isolated platelets were resuspended in buffer containing purified fibrinogen at concentrations varying from 0.5 to 5 mg/mL, with the platelet count kept constant (∼400 000/µL). There was a 40% and 60% decrease in the extent of contraction at fibrinogen concentrations of 2.5 mg/mL and 5 mg/mL, respectively, compared with concentrations <1 mg/mL (Figure 4A-C). Because cross-linking is needed to optimize clot contraction (Figure 2E-F; Table 1), it is important to note that fibrin in the reconstituted samples was cross-linked as shown by sodium dodecyl sulfate–polyacrylamide gel electrophoresis (supplemental Figure 3). Collectively, this suggests that the ratio of platelets to fibrinogen plays a critical role in determining the extent of contraction.
Effects of platelet count on clot contraction and dynamic viscoelastic properties. PRP was diluted with autologous PFP to final platelet concentrations of <75 000/µL, 125 000 to 150 000/µL, 250 000 to 300 000/µL, and >500 000/µL. Samples were incubated with 2 mM CaCl2 and 1 U/mL thrombin. The plots show the effect of platelet count on the kinetics of clot contraction (A), the final extent of contraction (B), and the ratio of viscous to elastic components of the blood clot (tan δ = G″/G′) (C). *P < .05; **P < .01; ***P < .001. (C) Significance comparison for <75 000/µL and >500 000/µL.
Effects of platelet count on clot contraction and dynamic viscoelastic properties. PRP was diluted with autologous PFP to final platelet concentrations of <75 000/µL, 125 000 to 150 000/µL, 250 000 to 300 000/µL, and >500 000/µL. Samples were incubated with 2 mM CaCl2 and 1 U/mL thrombin. The plots show the effect of platelet count on the kinetics of clot contraction (A), the final extent of contraction (B), and the ratio of viscous to elastic components of the blood clot (tan δ = G″/G′) (C). *P < .05; **P < .01; ***P < .001. (C) Significance comparison for <75 000/µL and >500 000/µL.
Effect of fibrin(ogen) concentration on clot contraction. (A) The kinetics of clot contraction in washed platelets (∼400 000/µL) resuspended buffer containing purified fibrinogen at a final concentration of 0.5, 1.0, 2.5, and 5.0 mg/mL and clotted with 1 U/mL thrombin and 2 mM CaCl2. (B) The extent of contraction normalized to the paired 0.5 mg/mL sample performed with the same source of platelets and fibrinogen. (C) The final extent of clot contraction observed under conditions described in (A) at 1 hour. *P < .05; **P < .01; ***P < .001.
Effect of fibrin(ogen) concentration on clot contraction. (A) The kinetics of clot contraction in washed platelets (∼400 000/µL) resuspended buffer containing purified fibrinogen at a final concentration of 0.5, 1.0, 2.5, and 5.0 mg/mL and clotted with 1 U/mL thrombin and 2 mM CaCl2. (B) The extent of contraction normalized to the paired 0.5 mg/mL sample performed with the same source of platelets and fibrinogen. (C) The final extent of clot contraction observed under conditions described in (A) at 1 hour. *P < .05; **P < .01; ***P < .001.
Effect of RBCs on extent of clot contraction
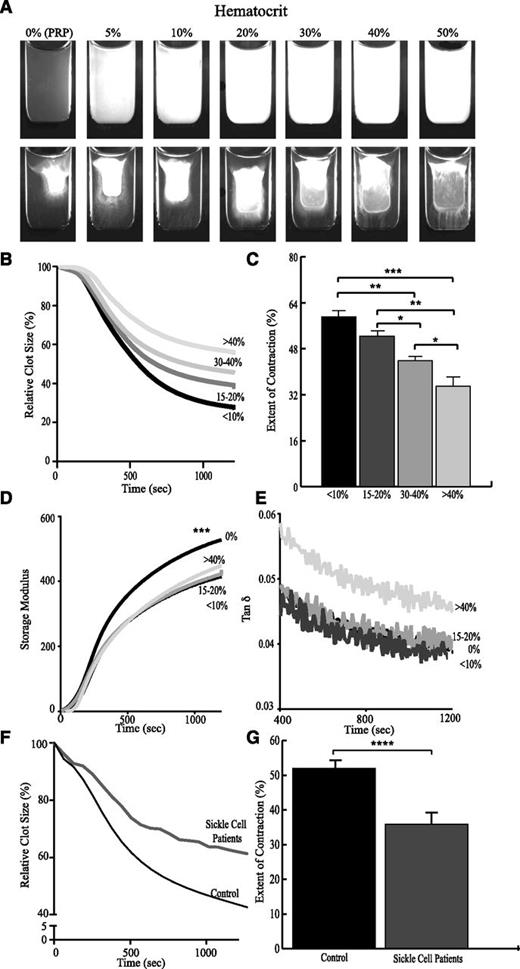
Because RBCs are embedded within the platelet-fibrin network (Figure 1E), we studied the effect of the volume fraction of RBCs (hematocrit) on contraction. RBCs were isolated and resuspended in mixtures of PRP and PFP, thereby independently varying hematocrit while maintaining platelets and fibrinogen. Notable optical differences were observed upon addition of RBCs (Figure 5A). Freshly formed clots containing RBCs were more opaque than those without RBCs. The extent of clot contraction was inversely related to the fractional volume of RBCs, whereby hematocrits between 30% and 40% decreased the extent of contraction by approximately one-third compared with clots prepared in the presence of <10% hematocrit. Small perturbations in hematocrit (comparing 15% to 20%, 30% to 40%, and >40%) also resulted in significant differences in the extent of contraction (Figure 5B), indicating that RBCs comprise an important component of the contracting blood clot. Adenosine diphosphate (ADP) released from RBCs can potentially enhance platelet activation. Therefore, we assessed the possible effect of RBC-produced ADP on the contraction process. We found that inhibition of platelet ADP receptors did not affect any measured parameters of thrombin-induced contraction (supplemental Figure 4) suggesting that the influence of RBCs on contraction is not biochemical. To assess whether clot contraction was altered by abnormally rigid RBCs, experiments were performed comparing samples of whole blood obtained from patients with SCD with whole blood samples from healthy donors. Samples from SCD patients exhibited 16% less contraction on average compared with healthy controls (P < .0001; Figure 5F-G).
Effects of RBCs on clot contraction and dynamic viscoelastic properties. RBCs were resuspended in mixtures of PRP and autologous PFP to vary the volume fraction of RBCs from <10% to >40% while keeping the platelet count and fibrinogen concentration constant. (A) Images of the clots before (upper row) and after (bottom row) 30-minute contraction induced by thrombin and CaCl2. Plots show the effects of RBCs on (B) the kinetics of contraction, (C) the final extent of contraction, (D) the elastic properties of the contracting clot (storage modulus, G′), and (E) the ratio of viscous to elastic properties (tan δ = G″/G′). The lower plots show the (F) averaged kinetics of clot contraction and the (G) average final extent of contraction in the whole blood of SCD patients (n = 3) vs whole blood from healthy controls (n = 51). *P < .05; **P < .01; ***P < .001; ****P < .0001.
Effects of RBCs on clot contraction and dynamic viscoelastic properties. RBCs were resuspended in mixtures of PRP and autologous PFP to vary the volume fraction of RBCs from <10% to >40% while keeping the platelet count and fibrinogen concentration constant. (A) Images of the clots before (upper row) and after (bottom row) 30-minute contraction induced by thrombin and CaCl2. Plots show the effects of RBCs on (B) the kinetics of contraction, (C) the final extent of contraction, (D) the elastic properties of the contracting clot (storage modulus, G′), and (E) the ratio of viscous to elastic properties (tan δ = G″/G′). The lower plots show the (F) averaged kinetics of clot contraction and the (G) average final extent of contraction in the whole blood of SCD patients (n = 3) vs whole blood from healthy controls (n = 51). *P < .05; **P < .01; ***P < .001; ****P < .0001.
Effects of platelets and RBCs on the mechanics of clot contraction
In vivo, clots and thrombi are exposed to shear forces generated by blood flow in the circulation. Through rheological studies performed in parallel, we examined the viscous and elastic properties of clots. Elasticity is the ability of a clot return to its original shape following deformation, whereas viscosity refers to irreversible deformation following application of force. Studies conducted on reconstituted samples prepared by varying platelets (at a constant fibrinogen level) and by varying RBCs (at constant platelet counts) revealed that addition of either platelets or RBCs induced a shift toward viscous properties of the clot (increase of tan δ) (Figures 3C and 5E). Although the shift toward viscous behavior with RBCs did not reach statistical significance, the presence of RBCs consistently decreased clot stiffness or elasticity (storage modulus [G′]) throughout the contraction process compared with samples lacking RBCs (Figure 5D).
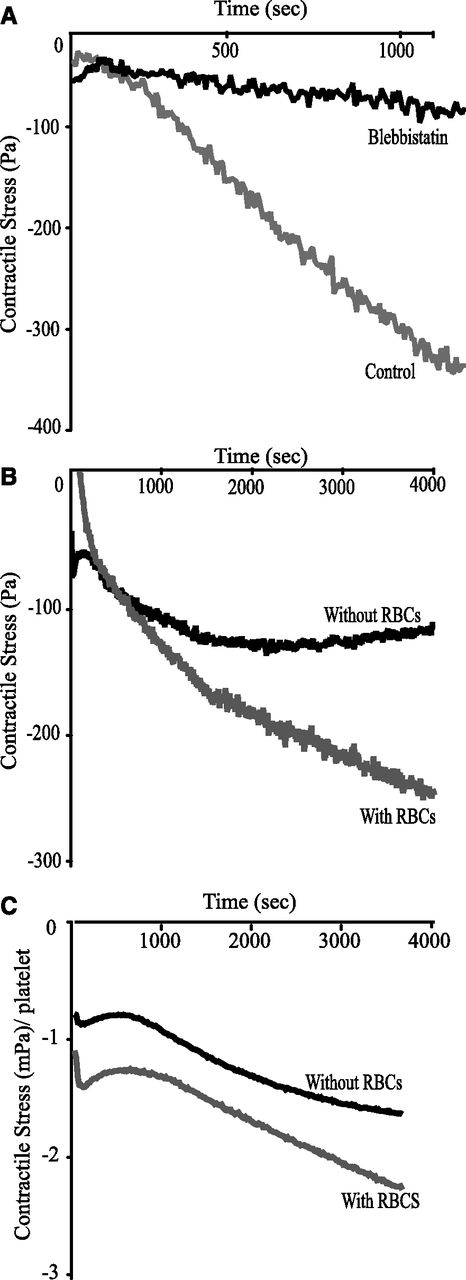
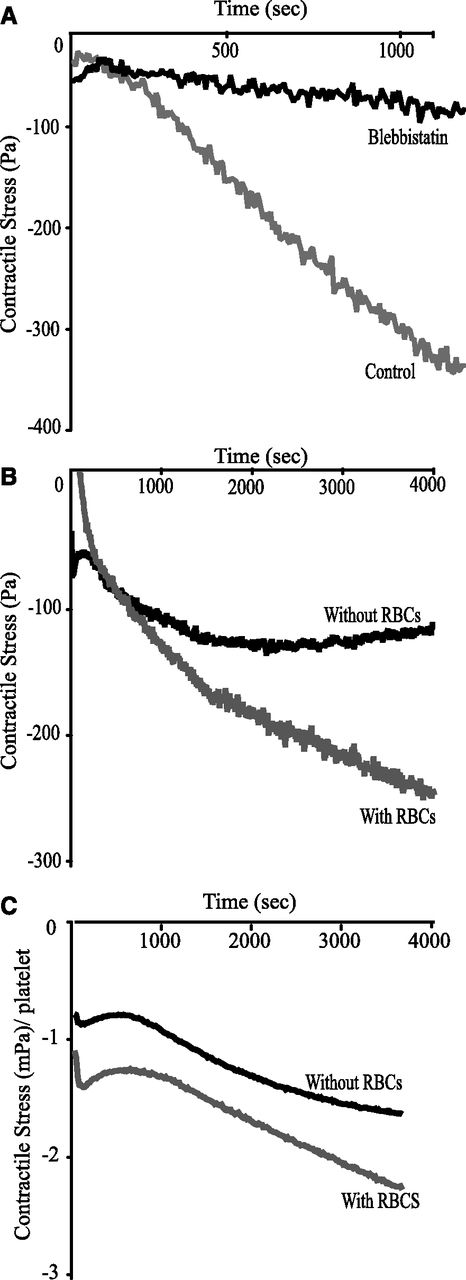
To complement the optical tracking experiments, which measured the change in clot size, the rheometer measured the contractile force generated by the clot, with clot volume constrained. Addition of 200 µM blebbistatin resulted in an eightfold reduction of the contractile force, indicating that it was attributable almost exclusively to myosin-driven contraction (Figure 6A). The presence of RBCs caused a 60% increase in the contractile force compared with samples with the same concentration of platelets in the absence of RBCs (Figure 6B). To confirm these results, we compared clots formed in whole blood (∼35% to 40% RBCs) and PRP (no RBCs) normalized based on the platelet count of each individual donor (n = 10). The contractile force per platelet was more than twofold higher when RBCs were present compared with clots formed with platelets alone (Figure 6C).
Effect of RBCs on the generation of contractile force. (A) Whole blood samples were incubated with 200 μM blebbistatin or vehicle control, and the contractile stress generated by the platelet-fibrin meshwork was measured as normal (perpendicular) stress between the rheometer plates. (B) Samples were reconstituted to the same platelet concentration (∼200 000/µL) in the absence or following the addition of RBCs to attain volume fraction of 40%. (C) The dynamics of contractile stresses generated by the clots formed in whole blood and PRP. Because the samples in panel (B) differ in platelet concentrations, the contractile stress generated in the whole blood and PRP clots was normalized to the platelet count obtained by a complete blood count (ie, presented as normal stress per platelet).
Effect of RBCs on the generation of contractile force. (A) Whole blood samples were incubated with 200 μM blebbistatin or vehicle control, and the contractile stress generated by the platelet-fibrin meshwork was measured as normal (perpendicular) stress between the rheometer plates. (B) Samples were reconstituted to the same platelet concentration (∼200 000/µL) in the absence or following the addition of RBCs to attain volume fraction of 40%. (C) The dynamics of contractile stresses generated by the clots formed in whole blood and PRP. Because the samples in panel (B) differ in platelet concentrations, the contractile stress generated in the whole blood and PRP clots was normalized to the platelet count obtained by a complete blood count (ie, presented as normal stress per platelet).
The complex kinetics of clot contraction
Three phases.
Analysis of the instantaneous derivative of the curves describing clot contraction of whole blood over time (n = 42) revealed that contraction involved 3 phases (Figure 1C). Analysis of how these phases of clot contraction respond to specific perturbations in cellular and plasma components provides insight into their mechanistic origin. Under the conditions applied in this study, the time at which the first exponential phase transitioned to the linear phase (t1) occurred at 83 ± 6 seconds and the time at which the linear phase transitioned to the second exponential phase (t2) occurred at 270 ± 12 seconds. Similarly, changes in the first derivative of the curves describing the normal force (n = 10) studied by rheometry also showed 3 distinct phases of contraction with insignificantly different critical points of change at 102 ± 10 seconds and at 226 ± 14 seconds.
Phase effects of thrombin and FXIIIa.
Lowering exogenous thrombin from 1 U/mL to 0.5 U/mL did not affect the initial rate or duration of the exponential decay phase of contraction; however, it did shorten the duration and slightly decrease the extent of contraction in phases 2 and 3 (Table 2; supplemental Figure 5A). Blocking cross-linking with 1 mM iodoacetamide decreased the rate of phase 2 and increased the overall time spent in the first 2 phases of contraction (Table 2). Similar effects were seen in the presence of 0.5 mM cystamine, where there was an increase in the duration of the first 2 phases and a slight, albeit not statistically significant, decrease in the rate of phase 2 (Table 2). It is important to note that in the presence of 2 mM cystamine, the elongation of time spent in the first 2 phases of contraction was so pronounced that it extended beyond the measured 20 minutes. Similar to the effect of iodoacetamide, the rate of phase 2 was decreased (Table 2). Collectively, these results suggest that covalent cross-linking of fibrin is critical for the last stage of clot contraction to occur (Table 2; supplemental Figure 5B).
Blocking of myosin-driven contraction by blebbistatin resulted in a dose-dependent decrease in the rate and extent of contraction in phases 2 and 3 (Table 2; supplemental Figure 5C). In the presence of 200 μM blebbistatin, the rates were so slow that it was impossible to distinguish beyond a single exponential phase of contraction. This result affirms that the generation of myosin-driven contraction within phase 1 is critical for the progression of clot contraction into phases 2 and 3 (Table 2).
Phase effects of platelets and RBCs.
Without RBCs present, a linear region (phase 2) in the contraction curve was not observed, even at higher platelet counts. It is of interest that at platelet counts <150 000/µL, the behavior of the curve was best described by a single exponential decay, whereas at platelet counts >250 000/µL, the curve was better described with 2 exponential decay curves, where the faster phase of contraction occurred in the first ∼360 seconds after platelet activation followed by a slower phase. Increasing platelet concentration increased the rate and extent of contraction in samples with 250 000 to 300 000/µL and >500 000/µL platelets (Table 2).
In the reconstituted samples with increasing concentrations of RBCs, the instantaneous derivative revealed a transition point within the first 30 seconds of contraction. However, because of its short duration, it was not possible to determine conclusively if this period followed a linear or exponential decay. At hematocrit >40%, the linear phase of contraction was not only slightly lengthened, but the rate was decreased by more than half when compared with hematocrit <10% (Table 2). The rate and extent of contraction in phase 3 was also decreased with increasing hematocrit (Table 2; supplemental Figure 5E). This further points to the major contributions of RBCs to the multiphasic clot contraction process.
To further examine the effect of RBC mechanics on the process of clot contraction, we examined the phases of contraction of samples of whole blood from patients with SCD that contained highly rigid RBCs. Samples from SCD patients exhibited on average a 30% decrease in the rate of contraction in phase 2 and a 40% decrease in the rate constant associated with phase 3 when compared with whole blood obtained from healthy controls (supplemental Figure 6).
Discussion
Clot contraction has been implicated as playing an essential role in hemostasis and the restoration of blood flow past otherwise obstructive thrombi.4 Although many thrombotic and bleeding disorders (eg, clotting factor and platelet function defects) can be diagnosed through end point assays such as clot times9 and light transmission aggregometry,36 respectively, it is quite likely that others are overlooked37 because they are best characterized by alterations in rate constants or because the defect involves platelet-fibrin interactions (eg, platelet nonmuscle myosin IIa disorders) rather than impaired platelet secretion or platelet-platelet interactions.38 There are also substantial differences between the avidity of activated platelets for fibrin vs fibrinogen, and it is fibrin, but not fibrinogen, that promotes fibronectin assembly and expression of phosphatidylserine on the platelet surface,39-41 which amplifies platelet-dependent generation of thrombin and fosters recruitment of additional platelets to sites of fibrin formation, among other differences.42 Lastly, the contribution of RBCs and other components of whole blood to contraction cannot be assessed using bulk end point assays of plasma.
The results of our study show that clot contraction is a dynamic process that is best described as following 3 kinetically discernable phases (Figure 7A): an initiation period (phase 1), followed by “linear contraction” (Phase 2), and then clot stabilization (phase 3). These phases also involve differences in requirements and contribution of fibrinogen and cellular elements for optimization. Specifically, phase 1 requires platelets and fibrinogen; phase 2 requires platelets, fibrinogen, and the additional presence of RBCs; and phase 3 requires cross-linking of fibrin by FXIIIa.
Schematic of the phase dynamics of blood clot contraction. (A) The process of clot contraction results in the shrinkage of clot volume over time. This process can be roughly separated into 3 phases: initiation of contraction, linear contraction, and mechanical stabilization. (B) Various processes involving platelets, fibrin, and/or RBCs impact the procession of clot contraction through the 3 phases. (C) Clot contraction is driven by a dynamic equilibrium between effects of the major blood components that can increase or decrease the extent of contraction.
Schematic of the phase dynamics of blood clot contraction. (A) The process of clot contraction results in the shrinkage of clot volume over time. This process can be roughly separated into 3 phases: initiation of contraction, linear contraction, and mechanical stabilization. (B) Various processes involving platelets, fibrin, and/or RBCs impact the procession of clot contraction through the 3 phases. (C) Clot contraction is driven by a dynamic equilibrium between effects of the major blood components that can increase or decrease the extent of contraction.
It is clear from many studies that platelet contractile proteins and platelet-fibrin(ogen) interactions are required for the overall process of contraction to occur.7,19,43 Here, we see that these interactions are required for phase 1 of clot contraction. Platelet counts >75 000/µL; platelet contractile proteins, as studied through inhibition of nonmuscle myosin IIa; and platelet-fibrin(ogen) interaction, as studied through addition of RGDS, are requisite to initiate clot contraction and for clot contraction to progress beyond phase 1. Increasing the platelet count from <150 000/µL to >250 000/µL increased the rate of contraction 4.75-fold, and raising the platelet count to >500 000/µL increased the rate 8.75-fold (Table 2).
What was not anticipated was the complex interaction between fibrinogen concentration, platelet count, and hematocrit. Raising the fibrinogen concentration >1 mg/mL impaired contraction of cross-linked clots, suggesting that the ratio of platelets/fibrin plays an important role, likely by providing sufficient local tension to reassemble fibrin-fibrin networks.
Additional evidence for this interpretation comes from the finding that the extent of clot contraction is inversely related to the hematocrit, as is seen in phase 2 and, therefore, the probability of inclusion of RBCs in the fibrin network. RBCs are known to be prothrombotic,44,45 and thromboembolism is a leading cause of death in some patients with elevated hematocrit (eg, polycythemia vera) and altered RBC rigidity and other mechanical properties (eg, SCD).46-48 The presence of RBCs is associated with larger thrombus volumes and increased fatality rates.49 However, the mechanism by which RBCs are incorporated into a clot, their role in clot contraction, and lytic resistance are only beginning to be appreciated.26
Our results reveal that RBCs primarily modulate phase 2 of clot contraction (Table 2). Incorporation of RBCs into the clot appears to interfere with the biphasic contraction evident in PRP, which previously had been attributed to the 2 phases of nonmuscle myosin IIa light-chain phosphorylation seen in platelets.50 Our analysis of phase 2 suggests that RBCs within the clot confer resistance to contraction, which is more pronounced with increasing hematocrit and increased RBC rigidity. This resistance leads to temporary reduction in platelet-driven contractile forces.
It appears that progression into phase 3 of contraction occurs when the contractile forces generated by platelets exceed the resistance of the RBCs, as shown by the exponential contraction. Linear contraction occurs independently of the driving force, whereas exponential contraction is proportional to the concentration of what drives contraction, in this case platelet-generated forces. Increasing the platelet count from 250 000 to 300 000/µL to >500 000/µL leads to a 2.5-fold increase in the rate and a twofold increase in the extent of phase 3 contraction, respectively (Table 2). The forces generated at higher platelet counts are thus able to overcome the resistance by RBCs, demonstrated by the reduction in extent and rate of phase 3 of contraction at higher hematocrit (Table 2).
One remarkable feature of phase 3 is that clot stabilization is most reliant on fibrin cross-linking by FXIIIa (Table 2), in addition to the presence of platelet contractile proteins and platelet-fibrin interactions that are required for the earlier phases. FXIIIa translocates fibrin to sphingomyelin-rich rafts, a process required for clot contraction to occur,19 and increases the stiffness of the clot.51 When FXIIIa cross-linking is blocked, the overall extent of contraction is reduced (Figure 2; Table 1) and the duration of time spent in phases 1 and 2 is lengthened (Table 2), showing that FXIIIa and clot stability are required for the progression into phase 3 and maintenance of phase 3 clot structure (Figure 2; Table 1), where the extent of contraction is greatest.
Clot stabilization can be disrupted by the volume of RBCs, by competition with platelets for binding to fibrin,52 or possibly by limiting the propagation of the contractile force through the fibrin network. In part, this can account for the reduced rate and extent of contraction in phase 3 with increasing hematocrit.
However, the reduction in phase 3 contraction observed at higher hematocrits was counterbalanced by an increase in the generation of contractile force when platelet counts were kept constant or normalized (Figure 6B-C). It is unlikely that this can be attributed to ADP released from RBCs,53 as inhibition of P2Y12 receptors did not affect the contraction process (supplemental Figure 4). Rather, it is known that single platelets mechanically sense the stiffness of the surrounding clot5,54 and generate differing contractile forces based on this property.11 RBCs decrease the elastic component of the clot (Figure 5D) on a timescale similar to the onset of phase 3 and might transiently increase the contractile force generated by platelets. Collectively, these results show that RBCs greatly impact the behavior of contracting clots mainly because of mechanical rather than biochemical influence.
The addition of both platelets and RBCs increases the viscous properties of the clot relative to their elastic behavior (Figures 3C and 5E). Notwithstanding similar effects on the mechanical properties of the clot, additions of RBCs and platelets have contradictory effects on the kinetics of the contraction process. This is probably because platelets, in addition to their viscoelastic properties, have active contractile machinery, whereas RBCs provide a passive viscoelastic filling of the fibrin meshwork while resisting contraction.
In sum, our studies reveal that clot contraction is a dynamic multistep and multifactorial process. By tracking the kinetics of clot contraction, we are able to gain detailed information about how individual components of the blood affect each step in the process (Figure 7B). We found that thrombin, high platelet counts, platelet-fibrin interactions, FXIIIa cross-linking, and activation of platelet myosin enhance clot contraction, whereas high fibrinogen, high hematocrit, and increased RBC rigidity limit the extent of clot contraction. The balance of these forces determines the overall extent of contraction (Figure 7C).
Endogenous or acquired factors that impair the velocity, extent, and stability of contraction might increase the propensity to hemorrhage, whereas rapid, but less extensive and more durable contraction might impair endogenous or therapeutic fibrinolysis. Our data support the possibility that RBC disorders associated with thrombosis (eg, SCD and other hereditary hemolytic anemias accompanied by alterations in RBC mechanical properties) might enhance clot formation while reducing clot contraction. Studies can be performed to see if platelets from patients with essential thrombocytosis and thrombosis show enhanced propensity to cause clot contraction with impairment of fibrinolysis when compared with platelets from patients with reactive thrombocytosis, and whether patients with essential thrombocytosis who present with a bleeding phenotype show impaired clot contraction and rapid clot dissolution. A major limitation of coagulation tests based on clotting times is that >95% of all thrombin generation occurs after the gel point.55 Therefore, some of the major sequelae of thrombin generation, including the late phases of platelet activation and fibrin formation, and the process of clot contraction, are missing. Additional studies are needed to determine if quantification of clot contraction will provide a novel and clinically important assay that permits study of hemostatic and thrombotic disorders not revealed by contemporary approaches that are predicated on end point clotting assays.
The online version of this article contains a data supplement.
The publication costs of this article were defrayed in part by page charge payment. Therefore, and solely to indicate this fact, this article is hereby marked “advertisement” in accordance with 18 USC section 1734.
Acknowledgments
The authors thank Eric Russell for providing the sickle cell patient samples, Zelda De Lange-Loots for her help with rheometry, and Sina Nassiri for his discussion of analysis techniques.
This work was supported by grants from the National Institutes of Health, National Heart, Lung, and Blood Institute (T32 H10791 and HL090774), the EPSRC(UK) to P. R. Williams, and the Program for Competitive Growth of Kazan Federal University.
Authorship
Contribution: V.T., R.I.L., D.B.C., and J.W.W. designed experiments; V.T., R.I.L., A.P.L., A.D.P., T.L., and F.I.A. performed experiments; V.T., R.I.L., A.P.L., A.D.P., K.L.S., D.B.C., and J.W.W. analyzed data; and V.T., R.I.L., D.B.C., and J.W.W. wrote the manuscript.
Conflict-of-interest disclosure: F.I.A. has been affiliated with HemaCore Ltd., Moscow, Russia. The remaining authors declare no competing financial interests.
Correspondence: John W. Weisel, Department of Cell and Developmental Biology, School of Medicine, University of Pennsylvania, 421 Curie Blvd, BRB II/III, Room 1154, Philadelphia PA 19104-6058; e-mail: weisel@mail.med.upenn.edu.

