Key Points
Before GVHD treatment, informative plasma biomarkers included TIM3, IL6, sTNFR1 (for grade 3-4 GVHD), and ST2 and sTNFR1 (for NRM at 1 year).
In a day 14 landmark analysis, plasma TIM3 was predictive of grade 3-4 GVHD.
Abstract
We identified plasma biomarkers that presaged outcomes in patients with gastrointestinal graft-versus-host disease (GVHD) by measuring 23 biomarkers in samples collected before initiation of treatment. Six analytes with the greatest accuracy in predicting grade 3-4 GVHD in the first cohort (74 patients) were then tested in a second cohort (76 patients). The same 6 analytes were also tested in samples collected at day 14 ± 3 from 167 patients free of GVHD at the time. Logistic regression and calculation of an area under a receiver-operating characteristic (ROC) curve for each analyte were used to determine associations with outcome. Best models in the GVHD onset and landmark analyses were determined by forward selection. In samples from the second cohort, collected a median of 4 days before start of treatment, levels of TIM3, IL6, and sTNFR1 had utility in predicting development of peak grade 3-4 GVHD (area under ROC curve, 0.88). Plasma ST2 and sTNFR1 predicted nonrelapse mortality within 1 year after transplantation (area under ROC curve, 0.90). In the landmark analysis, plasma TIM3 predicted subsequent grade 3-4 GVHD (area under ROC curve, 0.76). We conclude that plasma levels of TIM3, sTNFR1, ST2, and IL6 are informative in predicting more severe GVHD and nonrelapse mortality.
Introduction
The frequency of acute graft-versus-host disease (GVHD) after allogeneic hematopoietic cell transplantation (HCT) is in the 50% to 70% range, depending on the conditioning regimen, donor characteristics, and prophylaxis strategies.1 Although the overall frequency of GVHD has remained stable during the past decade, its presentation has shifted toward gastrointestinal involvement as the major cause of morbidity and away from severe damage to the skin and liver.1,2 The result of these clinical trends has been a reduction in the frequency of grade 3-4 GVHD to <10% in most centers, along with a 50% reduction in nonrelapse mortality (NRM).1
Retrospective analyses demonstrate that patients with more severe peak symptoms and especially more prolonged acute GVHD have substantially higher mortality rates than those with less severe and shorter-duration GVHD.3 Recognition of the ultimate severity of GVHD often becomes apparent within the first 2 weeks of the onset of signs and symptoms, marked by the absence of improvement during initial prednisone therapy and the development of gastrointestinal mucosal necrosis and jaundice.4,5 In patients with these adverse prognostic signs, secondary immune suppressive therapy provides suboptimal benefit, and mortality rates are high.5,6
If it were possible to predict the ultimate severity of GVHD before or at the onset of symptoms, preemptive immune suppressive therapy could be administered in an effort to blunt the intensity of tissue damage, especially in the gastrointestinal tract.2,7 Research on the predictive value of plasma biomarkers has yielded several candidate analytes that have been measured at higher levels in patients with GVHD than in allografted controls with no GVHD or less severe GVHD.2,7-13 In the study reported here, 2 cohorts of patients provided frequent blood samples after allogeneic transplantation, and we measured plasma levels of 23 analytes previously reported to be elevated in patients with GVHD. In plasma samples from patients in the first cohort, we identified 6 analytes with the greatest accuracy in predicting more severe GVHD. We then measured the levels of these 6 analytes in a second cohort of patients. Data were analyzed in 2 ways. The first analysis examined the predictive value of biomarkers in plasma samples from the onset period, before initiation of treatment of GVHD, and the second was a landmark analysis based on samples collected 11 to 17 days after HCT (day 14 ± 3 days). The purpose of this work was to identify biomarkers during the onset phase of GVHD whose sensitivity and specificity could be translated into clinical utility in predicting more severe GVHD and a higher risk of NRM.
Methods
Allogeneic hematopoietic cell transplantation
All patients except one received a myeloablative conditioning regimen followed by infusion of donor cells. Myeloablative conditioning regimens generally contained high-dose cyclophosphamide with busulfan or 12 to 13.2 Gy total body irradiation. The day of donor cell infusion was day 0. Recipients were given immunosuppressive drugs, usually a calcineurin inhibitor plus methotrexate to prevent GVHD. Prophylaxis for infections included low-dose acyclovir, trimethoprim/sulfamethoxazole or dapsone, an antifungal agent, preemptive therapy with ganciclovir for patients with cytomegalovirus antigenemia or DNAemia, and antibiotics for patients with neutropenia. Ursodiol was given as a prophylaxis against cholestasis.
Acute gastrointestinal GVHD
The peak stage of gastrointestinal GVHD, the peak grade of GVHD, and the date of onset of clinical signs and symptoms were independently scored, according to the extent of rash, the total serum bilirubin, the presence of upper gastrointestinal symptoms, and the daily stool volume.3,14 Patients were classified according to peak GVHD grade (2-4, 2b-4, or 3-4).15 NRM at 1 year after HCT was also noted.
Study design
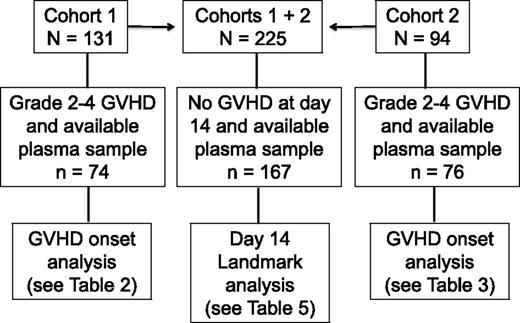
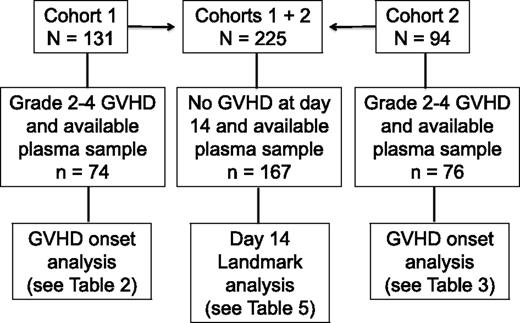
Patients gave informed consent for blood collection and for analysis of clinical data under protocols approved by the Fred Hutchinson Cancer Research Center Institutional Review Board. Blood samples were collected weekly from day 7 through day 70, from patients in 2 cohorts. Cohort 1 consisted of 131 consenting patients who received allografts from April 2003 to December 2008; 74 of 131 patients had gastrointestinal GVHD grade 2-4 and a plasma sample collected in the defined time window, and 57 of 131 had no gastrointestinal GVHD or no plasma sample collected in the defined window (Figure 1). Cohort 2 was composed of 94 patients who received allografts from August 2007 to April 201016 ; 76 of 94 patients had gastrointestinal GVHD grade 2-4 and a plasma sample collected in the defined time window, and 18 of 94 had no gastrointestinal GVHD or no plasma sample collected in the defined window (Figure 1). Plasma from samples collected before or at GVHD onset and before the initiation of systemic treatment of GVHD from cohort 1 patients was analyzed for 23 candidate biomarkers (median, 2 days before start of treatment; range, −15 to +1). After calculation of the area under receiver-operating characteristic curves (ROC), 6 analytes from cohort 1 patients that were correlated with grade 3-4 GVHD and NRM at 1 year were identified. These 6 analytes were then measured in plasma samples collected before or at onset and before initiation of treatment of GVHD from cohort 2 patients (median, 4 days before start of treatment; range −7 to −1). In addition, a landmark analysis was undertaken in which the same 6 analytes were measured in 167 plasma samples that had been collected at day 14 ± 3 days (day 11-17) after transplantation in 167 patients from cohorts 1 and 2 who had no clinical evidence of acute GVHD when blood samples were drawn (Figure 1).
Flowchart illustrating the number of patients in each analysis cohort (cohorts 1, 2, and the combined cohort landmark analysis at day 14 ± 3 days).
Flowchart illustrating the number of patients in each analysis cohort (cohorts 1, 2, and the combined cohort landmark analysis at day 14 ± 3 days).
Collection and processing of blood samples
Blood samples were collected from central venous access catheters and centrifuged, and plasma was aliquoted in 0.5-mL tubes for cryopreservation at −80°C. Plasma was collected from 48 healthy, consenting, normal adults who were free of fever or any respiratory or influenzalike symptoms for at least 7 days before phlebotomy, and who had received no nonsteroidal antiinflammatory drugs, glucocorticoid medication, or antibiotics for at least 48 hours. This normal control cohort included 29 women and 19 men, with a median age of 37 years (range, 23-67).
Assay methods for plasma proteins: Luminex microbead assay and enzyme-linked immunosorbent assay.
The Luminex microbead method (Luminex, Austin, TX) was used for measurement of 21 analytes, as previously described.12 A sandwich enzyme-linked immunosorbent assay method was used for transforming growth factor-β1 and REG3α, as previously described.17 Supplemental Table 1 lists the reagents used in these assays along with their respective lower levels of detection.
Statistical methods.
All biomarker values were log10-transformed before analysis. Values at the lower limit of detection were assigned that value. Univariate logistic regression was used to evaluate the association of each biomarker with the outcomes of interest, including the calculation of area under the ROC curve. Odds ratios from these models refer to the increase in odds of the outcome for a tenfold increase in the analyte. Best models in the cohort 2 onset analysis and the combined cohort landmark analysis were determined by forward selection at the .05 level of significance. Backward selection yielded the same model in all cases. All P values are derived from likelihood ratio statistics and are 2-sided. All statistical analysis was carried out using SAS version 8 (SAS Systems, Cary, NC).
Results
Demographics of patients analyzed from cohorts 1 and 2 and in the landmark analysis
Table 1 summarizes characteristics of patients in this study, by analysis groups. Patients selected from cohorts 1 and 2 are similar except for a greater proportion of unrelated donors and marrow as a source of donor cells in patients from cohort 2.
Biomarker concentrations before the initiation of treatment of acute GVHD
Values for analytes in plasma near to the time of symptomatic onset and before treatment of GVHD in patients from cohorts 1 and 2 are displayed in Tables 2 and 3, respectively. As judged by the area under an ROC curve of 0.70 or greater, the most informative analytes for predicting grade 3-4 vs grade 2 GVHD in cohort 1 patients were HGF, IL6, ST2, TIM3, tumor necrosis factor-alpha (TNFα), and sTNFR1 (Table 2). The most informative analytes for predicting NRM at 1 year were HGF, IL6, ST2, sTNFR1, and Reg3a (Table 2).
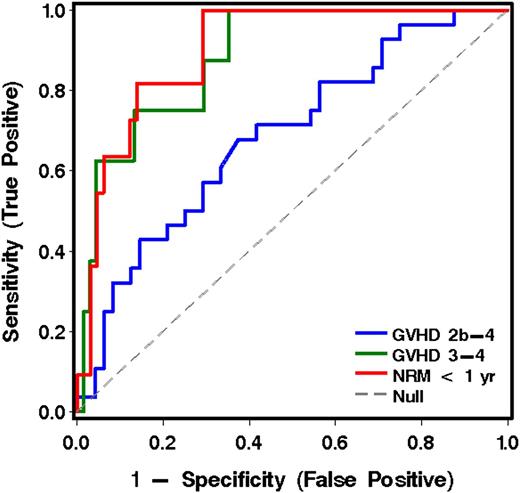
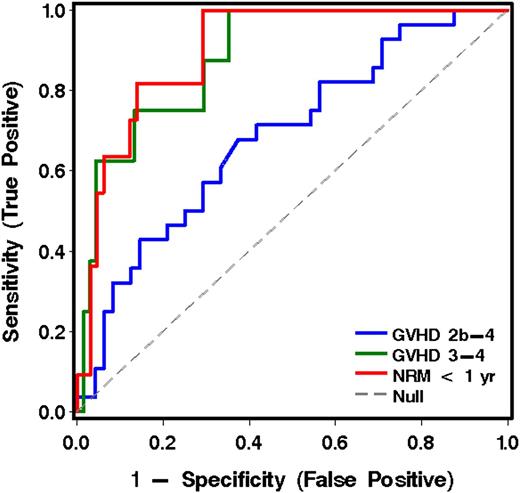
When the 6 most informative analytes derived from cohort 1 were applied to the analysis of plasma samples drawn before initiation of treatment of GVHD in patients from cohort 2, IL6 was the most informative analyte(s) for predicting grade 2b-4 GVHD vs grade 2a GVHD. IL6, TIM3, and sTNFR1 were the most informative for predicting grade 3-4 from grade 2 GVHD. ST2 and sTNFR1 were most informative for predicting NRM vs survival at 1 year (Table 3 and Figure 2).
ROC curves for analytes in plasma for the prediction of more severe acute GVHD and NRM for patients in cohort 2, using the best model analytes given in Table 3.
ROC curves for analytes in plasma for the prediction of more severe acute GVHD and NRM for patients in cohort 2, using the best model analytes given in Table 3.
Analytes in plasma at transplant day 11 to 17 (day 14 ± 3): landmark analysis
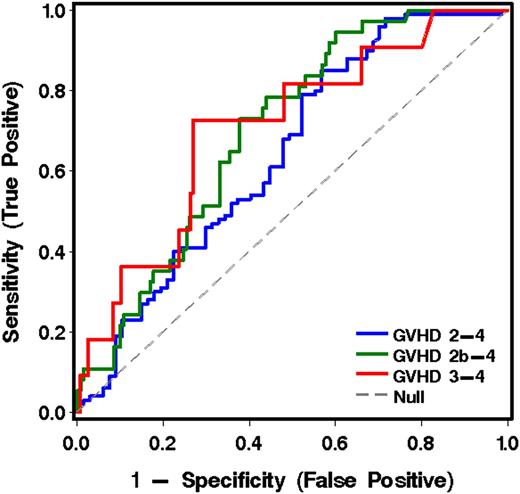
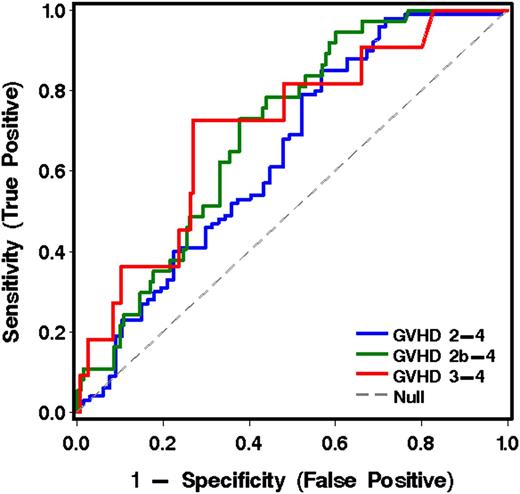
The 6 informative analytes derived from cohort 1 were measured in plasma samples collected at 11 to 17 days after transplantation from patients in both cohorts who were without symptoms of GVHD when the blood was drawn. Note that these analyses included patients who subsequently developed GVHD after transplantation and those who did not. Of the 167 patients without GVHD at the time of the landmark sample, 100 developed grade 2-4 acute GVHD. The onset of GVHD symptoms occurred at a median 26 days (range, 15-99) after HCT. The most informative analyte for predicting more severe from less severe GVHD was TIM3 (Table 5, Figure 3, and Table 4C).
ROC curves for analytes in plasma at transplant day 14 (landmark analysis, cohorts 1 and 2 combined), using the best model analytes given in Table 5 for predicting more severe from less severe GVHD to day 100.
ROC curves for analytes in plasma at transplant day 14 (landmark analysis, cohorts 1 and 2 combined), using the best model analytes given in Table 5 for predicting more severe from less severe GVHD to day 100.
Pro- and antiinflammatory cytokines and other analytes across time, by presence or absence of gastrointestinal GVHD
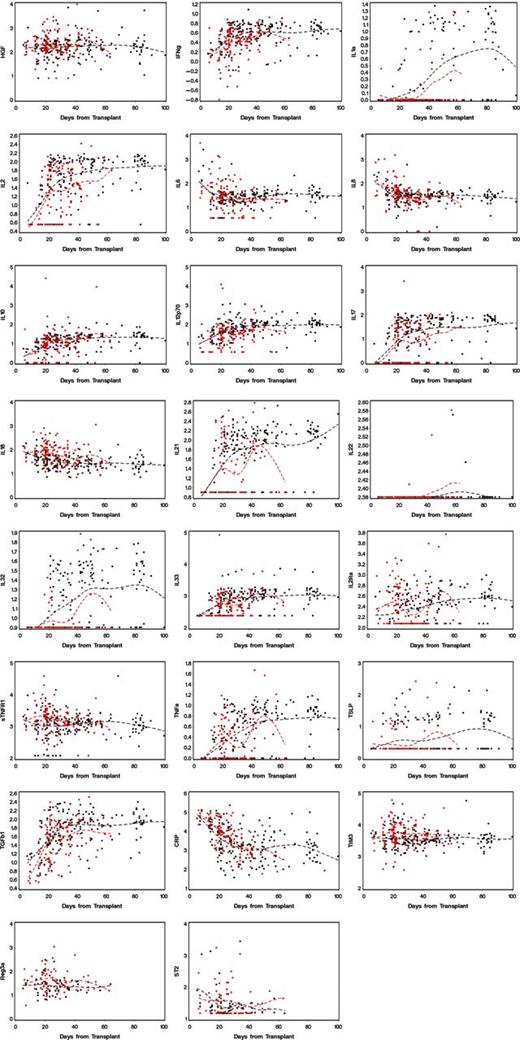
Figure 4 displays plots of values for 23 analytes in blood drawn at weekly intervals after transplant from patients in cohort 1. Patients who developed GVHD with gastrointestinal involvement are represented in red, and patients who never developed GVHD are represented in black.
Values for analytes found in blood samples from patients in cohort 1, drawn at weekly intervals. The dotted lines are cubic spline curves, for GVHD cases in red and non-GVHD cases in black.
Values for analytes found in blood samples from patients in cohort 1, drawn at weekly intervals. The dotted lines are cubic spline curves, for GVHD cases in red and non-GVHD cases in black.
Discussion
The purpose of this study was to identify biomarkers before the development of symptoms that would predict grade 3-4 GVHD and NRM with sufficient accuracy that would allow preemptive therapy. For the time period before or at the onset of symptoms of GVHD with gastrointestinal involvement (median of 4 days before start of treatment), the principal findings are that (1) measurement of plasma IL6, TIM3, and sTNFR1 has utility in predicting development of grade 3-4 vs grade 2 GVHD (area under a ROC curve, 0.88); and (2) measurement of ST2 and sTNFR1 has predictive value with regard to NRM (area under an ROC curve, 0.90). In our day, 14 landmark analyses of samples collected between day 11 and 17, measurement of TIM3 was the most useful analyte for predicting grade 3-4 vs grade 0-2 GVHD to day 100 post-transplant (area under an ROC curve, 0.76). Analysis of inflammatory cytokines and markers of inflammation across time (Figure 4) suggests that most allograft recipients experience significant systemic inflammation to day 100. Our findings are consistent with recent studies that have identified TNFR1 and ST2 as useful biomarkers for more severe GVHD2,7-9 but that are inconsistent with regard to REG3α11 (which was less predictive than other analytes) and TIM312 (which was more predictive).
Despite the statistically significant operating characteristics of the analytes that we have identified in predicting more severe GVHD and NRM, the use of these data in clinical trials designed to improve outcomes is likely to encounter difficulties. The day of onset of GVHD symptoms is unknown a priori, and thus blood samples would have to be drawn at frequent intervals and analytes measured in real time to provide data that would inform treatment decisions. Landmark data would be easier to generate in clinical practice but may not be as accurate. Most centers currently report a low incidence of more severe gastrointestinal GVHD. As can be seen in the 2 × 2 tables (Table 4), the sensitivity, specificity, and positive predictive value of our “best” analytes and combination of analytes show that the number of false positives would still outnumber the true positives, and thus some patients who were not destined to develop more severe GVHD would receive inappropriate preemptive therapy. However, the outcome in patients with more severe, protracted gastrointestinal GVHD is dismal. Therefore, multicenter clinical trials are warranted to examine the hypothesis that preemptive treatment of appropriately selected patients could alter the course of the disease and decrease the risk of mortality. The treatment that should be tested in clinical trials of preemptive therapy is an open question. More aggressive preemptive approaches—for example, using anti–T cell therapy—might be effective in improving outcomes for patients truly destined to develop more severe GVHD, but might pose the unnecessary risk of greater immune suppression among patients who were never destined to develop more severe GVHD.
The analyte TIM3 provided the most predictive utility in our landmark analysis of samples drawn at approximately day 14 after transplantation (Table 5 and Figure 3). However, the grade 3-4 GVHD–positive predictive value of TIM3 measurement at day 14 was only 16%. Our choice of day 14 for the landmark analysis was arbitrary, designed to capture the largest number of patients before clinical signs of GVHD developed. One might choose a later day if patients had received reduced-intensity conditioning regimens, because their onset of GVHD tends to be later than GVHD after myeloablative conditioning regimens.18 A recent study of cord blood recipients with a day 28 landmark showed that the analyte ST2 was predictive of transplant-related mortality and grade 3-4 GVHD.9 ST2 has been associated with more severe GVHD in another study,8 but at day 14, our data show TIM3, and not ST2, as the most useful analyte for grade 3-4 GVHD to day 100. Previous studies have not included TIM3 in the panel of analytes. A well-powered study has examined the utility of measuring 3 biomarkers (TNFR1, Reg3α, and ST2) at the time of GVHD diagnosis to create an algorithm that predicts NRM 6 months later.2 The resulting evidence-based Ann Arbor GVHD grading system addresses flaws in grading the severity of GVHD by its peak signs and symptoms. Alternative GVHD risk scoring systems for predicting outcomes, including NRM, rely solely on clinical parameters.3,19 Other potential prognostic markers of gastrointestinal GVHD at the time of initial diagnosis include fecal samples (for calprotectin and α-1-antitrypsin), falling serum albumin as a reflection of gut protein loss, endoscopic appearance, specific histologic changes, and circulating angiogenic factors.10,13,20-23 Reconciling results of studies predicting the outcome of GVHD based on clinical parameters, plasma and fecal samples, and mucosal histology—done at different centers—is difficult, because there are differences in timing, handling of specimens, storage time, analytical techniques, choice of biomarkers, and statistical methods. It is also not clear whether prognostic markers for gastrointestinal GVHD will vary with the intensity of conditioning therapy, choice of GVHD prophylaxis, and source of hematopoietic cells.
The display of longitudinal data of analytes across time (Figure 4) suggests that most allograft recipients have biochemical evidence of systemic inflammation long after the clinical effects of conditioning therapy have resolved. A prospective study of colon biopsies demonstrated restoration of mucosal epithelium at around day 16 after myeloablative conditioning therapy.24 Oral mucositis resulting from conditioning therapy also resolves in this time frame. A clinical study of eating behavior after myeloablative therapy also showed improvements in oral caloric intake at around day 20.17 The graphs in Figure 4 suggest that a systemic inflammatory milieu persists after day 20, even among patients who do not have clinical signs or symptoms of gastrointestinal GVHD. We speculate that virtually all allograft recipients experience graft-vs-host reactions as the cause of systemic inflammation, but not all will develop clinically significant disease.25
In summary, we have identified plasma levels of TIM3, IL6, sTNFR1, and ST2 as informative analytes in predicting the development of more severe GVHD and NRM among patients with gastrointestinal GVHD. Our study has several limitations. The numbers of patients in the outcome categories grade 3-4 GVHD and NRM are relatively small, reflecting current incidence rates. The study design, using consecutive cohorts of patients rather than randomizing to development and validation sets, was dictated by chronology—that is, analysis of plasma from cohort 1 patients was underway before samples from cohort 2 patients became available. Implementing a protocol that would lead to preemptive or initial therapy in those patients predicted to develop more severe GVHD will require a multicenter approach, uniform specimen handling, a central analytical laboratory, integration of clinical and biomarker parameters, and a primary end point of GVHD-related mortality, or its converse, GVHD-free survival.26
The online version of this article contains a data supplement.
The publication costs of this article were defrayed in part by page charge payment. Therefore, and solely to indicate this fact, this article is hereby marked “advertisement” in accordance with 18 USC section 1734.
Acknowledgments
This study was supported by grants from the National Institutes of Health, National Cancer Institute (CA18029, CA15704), National Institute of Allergy and Infectious Diseases (AI33484), and National Heart, Lung, and Blood Institute (HL094260).
Authorship
Contribution: G.B.M. designed the research, supervised the Cytokine Shared Resource Laboratory, analyzed data, and wrote the paper; L.T. supervised the collection and archiving of plasma samples, recorded clinical data, and assisted in the preparation of the manuscript; B.E.S. assisted in study design and served as the statistician responsible for analysis of data; R.L.L. was the lead technician in the Cytokine Shared Resources Laboratory who developed and executed Luminex and ELISA assays for this research; P.J.M. designed the study, provided plasma specimens for Cohort 2, and assisted in the analysis of data and writing of the manuscript; and J.A.H. designed the study and assisted in the analysis of data and in the writing of the manuscript.
Conflict-of-interest disclosure: The authors declare no competing financial interests.
Correspondence: George B. McDonald, Clinical Research Division (D5-114), Fred Hutchinson Cancer Research Center, 1100 Fairview Avenue North, Seattle, WA 98109-1024.

