Key Points
Well-defined miRNA signatures for normal B-cell subsets and their malignant counterparts including BL and DLBCL subgroups were identified.
In DLBCL, miRNA-155 expression is associated with R-CHOP resistance, but in vitro sensitivity to AKT pathway inhibition.
Abstract
We studied the global microRNA (miRNA) expression in diffuse large B-cell lymphoma (DLBCL; n = 79), Burkitt lymphoma (BL; n = 36), primary mediastinal B-cell lymphoma (PMBL; n = 12), B-cell lines (n = 11), and normal subsets of naïve B cells, centroblasts (CBs), and peripheral blood B cells along with their corresponding gene expression profiles (GEPs). The normal B-cell subsets have well-defined miRNA signatures. The CB miRNA signature was significantly associated with germinal center B-cell (GCB)–DLBCL compared with activated B-cell (ABC)–DLBCL (P = .002). We identified a 27-miRNA signature that included v-myc avian myelomatosis viral oncogene homolog (MYC) targets and enabled the differentiation of BL from DLBCL, a distinction comparable with the “gold standard” GEP-defined diagnosis. Distinct miRNA signatures were identified for DLBCL subgroups, including GCB-DLBCL, activated B-cell (ABC)-DLBCL, and PMBL. Interestingly, most of the unclassifiable-DLBCL by GEP showed a strong similarity to the ABC-DLBCL by miRNA expression profiling. Consistent results for BL and DLBCL subgroup classification were observed in formalin-fixed, paraffin-embedded tissue, making such tests practical for clinical use. We also identified predictive miRNA biomarker signatures in DLBCL, including high expression of miR-155, which is significantly associated with rituximab plus cyclophosphamide, doxorubicin, vincristine, and prednisone (R-CHOP) treatment failure. This finding was further supported by the observation that high expression of miR-155 sensitizes cells to v-akt murine thymoma viral oncogene homolog-1 inhibitors in vitro, suggesting a novel treatment option for resistant DLBCL.
Introduction
Diffuse large B-cell lymphoma (DLBCL) displays significant heterogeneity with regard to genetic, pathological, and clinical features.1 We have defined at least 3 molecular subgroups using gene expression profiling (GEP): germinal center B cells (GCB-DLBCL), activated B cells (ABC-DLBCL),2 and primary mediastinal B-cell lymphoma (PMBL). These subgroups show distinct oncogenic activation mechanisms, genomic abnormalities, and clinical outcome.3,4 A minor subset remains unclassifiable and is designated as “unclassifiable” (UC) DLBCL.
Burkitt lymphoma (BL) is another aggressive B-cell lymphoma, predominantly affecting children. The major genetic abnormality is t(8;14)(q24;q32), which leads to the constitutive expression of the MYC oncogene. BL shows a remarkably homogeneous GEP with significant enrichment of the germinal center (GC) and v-myc avian myelomatosis viral oncogene homolog (MYC) target gene signatures,5,6 as well as recurrent mutations in TCF3, CCND3, and ID3 genes.7,8 The distinction between DLBCL and BL may be difficult in cases exhibiting overlapping histologic and immunophenotypic patterns and the characteristic t(8;14) translocation. GEP has successfully improved the classification, but gray-zone cases still exist even after molecular profiling,1,5,6 and GEP methodology has not yet been widely translated into clinical practice. Accurate diagnostic distinction between DLBCL and BL is clinically relevant in adult patients. BL responds poorly to standard immunochemotherapy and requires intensive chemotherapy9 for better clinical outcome.
The use of immunohistochemistry (IHC) procedures in BL and in DLBCL subgroup distinction have shown inconsistent results because of subjective and technical factors affecting immunostaining.10,11 Quantitative real-time polymerase chain reaction assays for messenger RNA (mRNA) expression12 and microRNA (miRNA) expression have also been used13 for subgroup classification. In this study, we performed global miRNA expression profiling on a well-defined series of fresh-frozen and formalin-fixed, paraffin-embedded (FFPE) BL, DLBCL, and PMBL specimens with corresponding GEP and clinical-outcome data. Our goal is to identify reliable and distinctive miRNA signatures for robust classification of BL and the DLBCL subgroups and to evaluate their usefulness as prognostic biomarkers. We also attempted to identify a predictive miRNA signature associated with rituximab plus cyclophosphamide, doxorubicin, vincristine, and prednisone (R-CHOP) treatment failure and identify the mechanism of action.
Materials and methods
Detailed methods are presented in supplemental Methods (available on the Blood Web site).
Patient samples, B-cell lines, and primary B cells
A panel of hematopathologists confirmed the diagnosis of DLBCL (n = 79), BL (n = 36), and PMBL (n = 12) in accordance with the 2008 World Health Organization classification.1 The complete details about patient materials and experimental methods regarding cell lines, normal B-cell subsets, and stromal cells are presented in supplemental Methods.
Immunologic and fluorescence in situ hybridization analysis
Standard IHC procedures and fluorescence in situ hybridization for diagnosis were performed on FFPE tissue and presented in supplemental Methods.
RNA isolation for miRNA and GEP and data analysis
miRNA classifier for BL and DLBCL subgroups were constructed using a Bayesian algorithm, which estimated the probability of a case belonging to 1 subgroup vs another.14 The complete experimental and statistical methods are included in supplemental Methods.
In vitro analysis of miR-155 expression in DLBCL cell lines
The ectopic expression of miR-155 in DHL16 cell line and GEP analyses are presented in supplemental Methods.
Survival analysis
The survival risk group analyses were performed using the Bair and Tibshirani15 method, and the construction of the predictive model is presented in supplemental Methods.
Results
Patient characteristics and molecular classification by GEP
The basic clinical and pathological characteristics and molecular classification of the included patients are summarized in Table 1. Most DLBCL patients (85%; 67 of 79) were adults (≥21 years), whereas the BL patients were mostly children (<21 years; 61%, 22 of 36). The PMBL patients were predominantly young adults (median age 27 years). Adults with DLBCL or BL diagnosis had inferior overall survival and event-free survival (EFS) relative to pediatric patients, also reported previously16 (supplemental Figure 1A).
We applied GEP molecular predictors to distinguish BL5,6 and PMBL17 from DLBCL and then subdivided DLBCL cases into ABC-DLBCL and GCB-DLBCL.18 Using >90% probability as the threshold for GEP classification, we identified mBL (n = 34), mDLBCL (n = 76), and mPMBL (n = 12) out of cases diagnosed by pathology as BL (n = 36), DLBCL (n = 79), and PMBL (n = 12). Five cases had probabilities intermediate between BL and DLBCL and were molecularly unclassifiable. Of 6 high grade lymphoma-unclassifiable (HGL-UC) cases, morphologically, 3 were classified as BL and 3 as DLBCL, and all 5 T-cell-rich DLBCL cases by morphology were molecularly classified as DLBCL. Using a DLBCL subgroup predictor,18 we further classified the DLBCL cases into GCB-DLBCL (n = 32), ABC-DLBCL (n = 27), and UC-DLBCL (n = 16) subgroups (Table 2), with expected clinical outcome18 (supplemental Figure 1B).
Characterization of normal B-cell miRNA profiles and correlation to their target genes
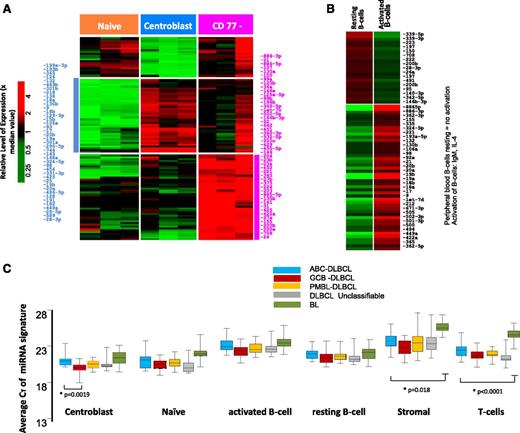
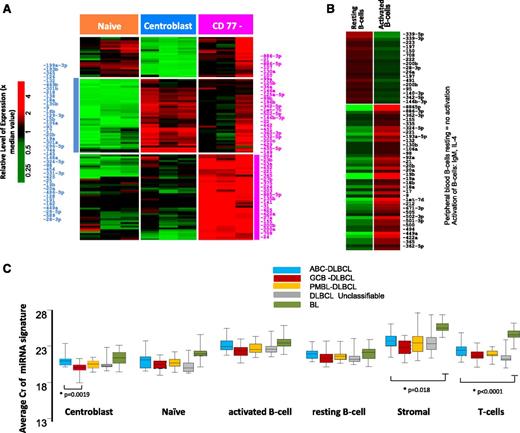
The transition of naïve B-cells to centroblasts (CBs) resulted in significant upregulation of 41 miRNAs (CT < 30, P ≤ .05 and fold ≥ 4.0), including miR-17-92 cluster members, miR-106a, miR-15b, miR-93, miR-25, and miR-28, consistent with previous studies,19-21 and newly associated miRNAs (eg, miR-34a, miR-218, miR-138) (Figure 1A). The miRNA spectrum with known function reflects the characteristic changes associated with the formation of a normal GC, namely, regulation of critical genes involved in GC B-cell differentiation, rapid proliferation, and epigenetic modifications (supplemental Table 1).
miRNA expression in normal B-cell subsets. Differential miRNA expression between naïve B-cells, CBs, and CCs (A). miRNAs were selected with CT < 30 and P < .05 and at least fourfold difference of means. (B) Peripheral B-cell resting vs activated B cell. (C) Average expression of miRNA signatures associated with normal B-cell subsets compared in different lymphoma subtypes.
miRNA expression in normal B-cell subsets. Differential miRNA expression between naïve B-cells, CBs, and CCs (A). miRNAs were selected with CT < 30 and P < .05 and at least fourfold difference of means. (B) Peripheral B-cell resting vs activated B cell. (C) Average expression of miRNA signatures associated with normal B-cell subsets compared in different lymphoma subtypes.
The CD77− B-cell subpopulation showed a varied pattern of miRNA expression reflecting heterogeneous subsets of cells within this fraction and was not analyzed further. When the in vitro activated B-cell miRNA profile was compared with resting peripheral blood B cells, miRNAs associated with proliferation (eg, miR-17-92 cluster members, miR-9, miR-98) and activation (eg, miR-155, miR-502, miR-422a) were upregulated in the activated B cells (Figure 1B).
Using correlation analysis (see “Materials and methods”) to decipher associations between miRNA signatures and the expression level of target genes in CBs, we screened the miRNA gene target database using the Probability of Interaction by Target Accessibility (PITA) algorithm.22 We identified a subset of genes with inverse correlation between expression of miRNAs and their target mRNAs (r = −0.5, P < .05) in CBs. Of the total 208 937 miRNA-mRNA pairs in the PITA database, 7428 pairs [3.5%] were significantly associated, when CBs were compared with naïve B cells. Of interest were genes that are targeted by multiple miRNAs, suggesting crucial roles in GC function. For example, 14 miRNAs target a single gene, BMPR2, which is downregulated in CBs (compared with CD77 subsets). Of these 14 miRNAs, miR-17-92 cluster members have been shown to directly repress BMPR2 expression.23 Several genes involved in nuclear factor κB (NF-κB) signaling pathway activation (MAP3K1, MAP3K14, MAPK1, and KLF3) were targets of at least 11 miRNAs, suggesting a role of miRNAs absent NF-κB signaling in normal CB cells, a finding reported previously.24 A list of CB target genes targeted by at least 5 miRNAs is shown in supplemental Table 1b, and a complete list has been included in supplemental Data.
Molecular classification of BL and DLBCL using miRNA expression
When CB miRNA signatures were compared with DLBCL, miRNAs in the CB were enriched in GCB-DLBCL, reflecting the putative cellular origin (Figure 1C and supplemental Table 2). However, discrepancies were also observed, suggesting that miRNA signatures derived from normal B-cell subsets are not sufficient for robust classification. This finding was also supported by unsupervised hierarchical clustering (HC) of the miRNA profiles, which showed that different lymphoma subtypes formed 1 or 2 major distinct subclusters (supplemental Figure 2). As expected, normal cells formed separate clusters compared with tumors, a finding very similar to GEP studies as well. However, few cases were interspersed between the DLBCL and BL subclusters when only tumors were included in HC (supplemental Figure 2B), whereas GEP-based molecular DLBCL subgroups were indistinguishable in these subclusters. Two major characteristics in HC were observed, a normal stromal miRNA signature that was significantly associated with the majority of DLBCL and a minor subset of BL, and a normal CB miRNA signature that was associated with a large subset of BL and GCB-DLBCL subgroup. Furthermore, we noted that GCB-DLBCL and PMBL formed tight subclusters, whereas ABC-DLBCL and UC-DLBCL often coclustered. The miRNA profiles of tumor cell lines and normal B-cell subsets also formed tight clusters, even although only a limited number of miRNAs were upregulated in these groups compared with tumor specimens.
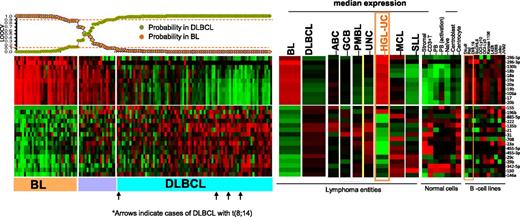
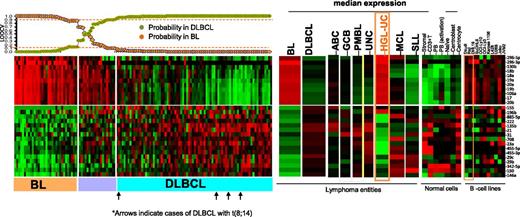
To evaluate the potential of miRNA-based diagnostic biomarkers, we derived a miRNA classifier, using a Bayesian algorithm, with a 27-miRNA signature (11 upregulated and 16 downregulated miRNAs), enabling us to separate BL from DLBCL (Figure 2). Similar to previous GEP findings,5 MYC miRNA targets included one upregulated cluster (miR-17-92 cluster members and their paralogues miR-18b, miR-20b, miR-106a) and a number of downregulated miRs (miR-23a, miR-29c, miR-29b, miR-150, miR-146a), indicating another critical role of MYC in BL oncogenesis. In addition to MYC targets, other miRNAs were also included (upregulated: miR-296-3p, miR-296-5p, miR-130b; downregulated: miR-155, miR-196b, miR-885-5p, miR-222, miR-135b, miR-21, miR-31, miR-708, miR-455-5p, miR-455-3p, miR-342-5p). Upregulated miRNAs in BL were expressed at significantly lower levels in normal B cells, T cells, and stromal cells but were noted in the BL cell lines (Daudi, Raji) and other B-cell lines (Figure 2). Analysis of known MYC-targeted miRNAs25 showed significant association with BL, but not with DLBCL cases with MYC translocation (supplemental Figure 3). Remarkably, a similar miRNA-signature expression pattern between BL and HGL-UC was observed, with the exception of miR-155 and miR-196b, suggesting marked commonality in these 2 entities. The accuracy of the diagnostic 27-miRNA-signature classification scheme was evaluated by leave one out cross validation (LOOCV).26 Three of 79 cases of GEP-defined DLBCL were misclassified as BL at ≥90% probability threshold, but none of the BL cases were defined as DLBCL, indicating high concordance with the GEP classification scheme (Figure 2). None of the 5 DLBCL cases carrying the t(8;14) were misclassified as BL using this classification scheme (Figure 2).
miRNA expression-based classification. An miRNA classifier derived using a Bayesian algorithm resulted in a 27-miRNA classifier (with 11 upregulated and 16 downregulated miRNAs) that can separate BL from DLBCL patients. The precision of the classifier was estimated by LOOCV, and a 90% probability threshold was used to differentiate the 2 entities. The expression of the miRNA classifier is compared in the DLBCL subgroups, mantle cell lymphoma (MCL), small lymphocytic lymphoma (SLL), HGL-UC, and normal B cells and cell lines. Orange boxes highlight the expression pattern in HGL-UC and BL cell lines.
miRNA expression-based classification. An miRNA classifier derived using a Bayesian algorithm resulted in a 27-miRNA classifier (with 11 upregulated and 16 downregulated miRNAs) that can separate BL from DLBCL patients. The precision of the classifier was estimated by LOOCV, and a 90% probability threshold was used to differentiate the 2 entities. The expression of the miRNA classifier is compared in the DLBCL subgroups, mantle cell lymphoma (MCL), small lymphocytic lymphoma (SLL), HGL-UC, and normal B cells and cell lines. Orange boxes highlight the expression pattern in HGL-UC and BL cell lines.
To evaluate the functional role of the BL miRNA signature, we correlated the miRNA signature with corresponding GEP data for the computationally predicted gene targets and selected miRNAs and genes with negative correlation (r < −0.5, P < 1.0 × 10⁻⁷) and obtained 0.1% (288 of 208 937 miRNA-mRNA pairs in the PITA database), which showed significant association with BL compared with DLBCL. Strikingly, BL cases with high expression of miR-17-92 cluster members showed cooccurrence of a number of target genes that were significantly repressed in BL, suggesting a critical role for miR-17-92 cluster members in BL pathogenesis (supplemental Table 3 and supplemental Data). On a similar note, we observed that a number of downregulated genes in BL (compared with DLBCL) were targets of more than 1 miRNA included in the BL miRNA signature (supplemental Figure 4).
MiRNA-signatures correlate with a GEP-based molecular classifier for DLBCL subgroups
DLBCL subgroups.
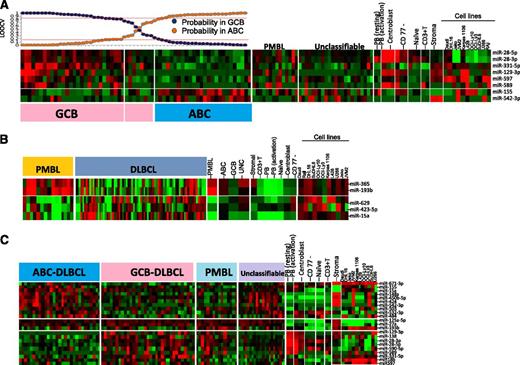
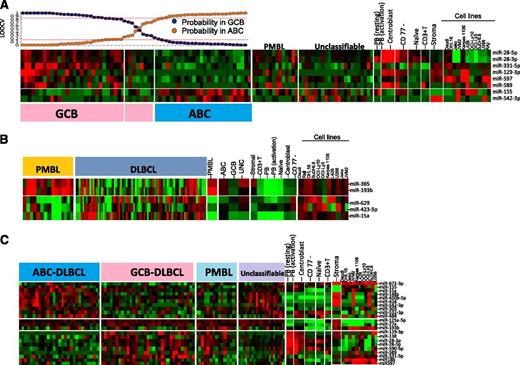
Unsupervised HC of miRNA profiles showed no significant association with the GEP-based DLBCL subgroup classification. Using a similar approach as that described previously, using a Bayesian algorithm, an 8-miRNA-classifier was derived to separate DLBCL subgroups with >80% probability (Figure 3A). However, ∼10% of GEP-defined DLBCL subgroups showed <80% probability and were unclassifiable using this miRNA classifier. The lower threshold was chosen to compensate for the heterogeneity associated with DLBCL specimens. Two of 8 miRNAs (miR-155, miR-542-3p) were upregulated in ABC-DLBCL. Of these, miR-155 was upregulated in in vitro activated B cells and ABC-DLBCL cell lines (OCI-Ly3, OCI-Ly10). The association of ABC-DLBCL with miR-155 expression is known,27 whereas miR-542-3p expression in ABC-DLCBL has not been reported. The remaining 6 miRNAs in the classifier were upregulated in GCB-DLBCL and also expressed in CB (miR-28-3p, miR-28-5p, miR-129-3p, and miR-589), GCB-DLBCL cell lines (DHL16, SuDHL6), and in stromal cells (miR-331-5p, miR-597).
miRNA signatures for DLBCL subgroups and comparative analysis in other subgroups, cell lines, and normal B-cell subsets. (A) ABC-DLBCL vs GCB-DLBCL. Eight miRNAs were able to distinguish ABC-DLBCL from GCB-DLBCL. GCB-DLBCL-related miRNAs are also expressed in CB and at least 1 GCB-DLBCL cell line, whereas only miRNA-155 from ABC-DLBCL shows association with activated B cells and ABC-DLBCL cell lines. Here, we chose an 80% probability threshold to distinguish the 2 DLBCL subgroups. (B) PMBL vs DLBCL. Five miRNAs were able to distinguish PMBL from DLBCL. (C) Differential miRNA expression between 3 subgroups of DLBCL.
miRNA signatures for DLBCL subgroups and comparative analysis in other subgroups, cell lines, and normal B-cell subsets. (A) ABC-DLBCL vs GCB-DLBCL. Eight miRNAs were able to distinguish ABC-DLBCL from GCB-DLBCL. GCB-DLBCL-related miRNAs are also expressed in CB and at least 1 GCB-DLBCL cell line, whereas only miRNA-155 from ABC-DLBCL shows association with activated B cells and ABC-DLBCL cell lines. Here, we chose an 80% probability threshold to distinguish the 2 DLBCL subgroups. (B) PMBL vs DLBCL. Five miRNAs were able to distinguish PMBL from DLBCL. (C) Differential miRNA expression between 3 subgroups of DLBCL.
Using negative correlation analysis between miRNA-signature and target gene expression as described in supplemental Methods, we obtained 0.25% (529 of 208 973) miRNA-mRNA pairs that showed association between ABC-DLBCL and GCB-DLBCL comparison. Of these, we noted that miR-28-3p appears to repress the most target genes in GCB-DLBCL, whereas miR-155 was associated with the most downregulated target genes in ABC-DLBCL, suggesting their roles in oncogenesis in the DLBCL subgroups (supplemental Figure 5).
PMBL miRNA signature.
We built a 5-miRNA classifier that separated PMBL from other DLBCL subgroups with >80% probability and shared several miRNAs with GCB (miR-28-3p, miR-28-5p, and miR-138) (Figure 3B). However, 2 miRNAs of a polycistronic cluster on 16p13 (miR-193b, miR 365) were specifically expressed in PMBL. The expression of upregulated miRNAs was largely observed in the PMBL cell line (Karpas-1106) and normal CB. Three miRNAs (miR-629, miR-423-5p, miR-15a) were downregulated in PMBL; however, their pathogenetic role is not known (Figure 3B).
Unclassifiable DLBCL by GEP.
A majority of the GEP-defined UC-DLBCL cases were defined as ABC-DLBCL (13 of 16, 80%), whereas 20% (3 of 16) were GCB-DLBCL by miRNA signature, an observation similar to our previous IHC-based classification.10 Using pan B- and T-cell-specific GEP signatures, we observed that at least 50% of these cases had low B-cell:T-cell ratios (less than twofold), suggesting low tumor content. However, these cases did show increased B-cell miRNA signatures and had a B-cell pan miRNA signature:T-cell pan miRNAsignature ratio >1.25, suggesting a higher dynamic range with miRNA expression.
In addition to miRNA in the diagnostic signature, several other miRNAs were differentially expressed between DLBCL subgroups. Further comparative analysis of these miRNAs showed association with normal B-cell subsets and also with the stromal component. For example, a number of miRNAs upregulated in GCB-DLBCL were also upregulated in CB, and number of miRNAs upregulated in ABC-DLBCL showed association with activated PB cells and with at least 1 ABC-DLBCL cell line. In this analysis, we also observed that many of the differentially expressed miRNAs in ABC-DLBCL showed a similar expression pattern in UC-DLBCL (Figure 3C).
Comparison of cryopreserved and FFPE miRNA profiles
The miRNA classifier obtained from cryopreserved tissues was evaluated in FFPE DLBCL (n = 31) and BL (n = 17) cases. Unsupervised HC of FFPE specimens showed similar results with cryopreserved fresh-frozen specimens (Figure 4A), with 1 or 2 major distinct clusters of DLBCL, and few cases of DLBCL and BL interspersed among each other. The expression of BL vs DLBCL miRNA signatures obtained from cryopreserved tissues showed concordant results with FFPE tissues, with the exception of 3 miRNAs, which were inconsistent in FFPE samples (Figure 4B). When the miRNA signature was evaluated in DLBCL FFPE tissues, we observed that 6 of 8 miRNAs showed differences in expression between ABC-DLBCL and GCB-DLBCL. However, to better differentiate the entities, additional miRNAs, as shown in Figure 4C, were also included.
miRNA expression in FFPE tissues. (A) Unsupervised HC on miRNA profiles from FFPE specimens showed distinct clusters of DLBCL and BL. (B) The miRNA classifier obtained from cryopreserved tissues showed a similar expression pattern in FFPE tissues of BL and DLBCL. (C) A similar pattern was observed in DLBCL subgroups; however, to retain high predictive power, additional miRNAs were required in FFPE tissues.
miRNA expression in FFPE tissues. (A) Unsupervised HC on miRNA profiles from FFPE specimens showed distinct clusters of DLBCL and BL. (B) The miRNA classifier obtained from cryopreserved tissues showed a similar expression pattern in FFPE tissues of BL and DLBCL. (C) A similar pattern was observed in DLBCL subgroups; however, to retain high predictive power, additional miRNAs were required in FFPE tissues.
miRNA-155 expression is associated with R-CHOP treatment failure, but in vitro sensitivity to AKT pathway inhibition
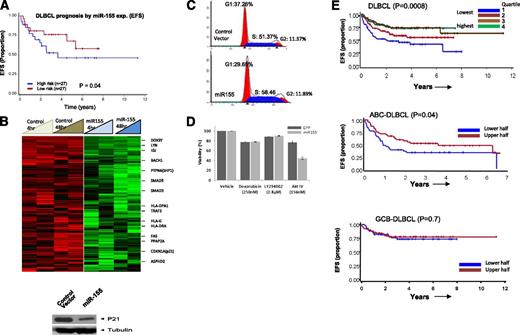
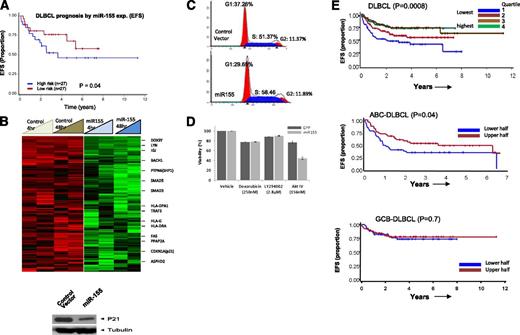
High expression of 3 miRNAs (miR-16, miR-155, miR-363) was significantly associated with R-CHOP therapy failure in DLBCL, whereas high expression of miR-24 was associated with a favorable treatment response. Of the former 3 miRNAs, miR-155 showed the highest differential expression and significantly correlated with R-CHOP treatment failure (Figure 5A), suggesting its potential as a predictive biomarker. To investigate further, we performed GEP of a cell line (DHL16, with no basal miR-155 expression) transduced with miR-155 in a doxycycline-regulated retroviral vector system and compared with control vector. Of the 278 genes downregulated at least twofold (P < .05) at both 4 and 48 hours, a key cell-cycle regulatory gene, CDKN1A (p21), was identified and further validated at the protein level (Figure 5B). Cell-cycle analysis revealed increased cell proliferation and enhanced G1-S phase transition (Figure 5C) in cells overexpressing miR-155. This was further supported by computational analysis (Ingenuity Inc.) of the differentially expressed genes, showing that several genes (negative regulators: inositol polyphosphate-5-phosphatase (INPP5D)/SHIP1, protein phosphatase 2A (PP2A)) involved in v-akt murine thymoma viral oncogene homolog-1 activation and G1-S cell cycle transition were downregulated upon ectopic miR-155 expression (supplemental Figure 6).
Association of miR-155 with rituximab resistance and target identification. (A) Association of miR-155 expression with EFS in DLBCL. (B) GEP analysis of miR-155-regulated genes and western blot detection of cyclin-dependent kinase inhibitor 1A (CDKN1A) (p21) (only downregulated genes are shown). (C) Cell-cycle analysis in miR-155 overexpressing DHL16 cells. (D) miR-155-expressing cells were more sensitive to AKT IV inhibition, compared with other inhibitors. (E) The 3-gene miR-155 signature was predictive of treatment failure in DLBCL in the entire cohort (upper) and in the ABC-DLBCL subgroup, but not in GCB-DLBCL (lower). EFS is shown using expression quartiles (Q) of the 3-gene signature in the entire cohort, but divided in halves in subgroup analysis.
Association of miR-155 with rituximab resistance and target identification. (A) Association of miR-155 expression with EFS in DLBCL. (B) GEP analysis of miR-155-regulated genes and western blot detection of cyclin-dependent kinase inhibitor 1A (CDKN1A) (p21) (only downregulated genes are shown). (C) Cell-cycle analysis in miR-155 overexpressing DHL16 cells. (D) miR-155-expressing cells were more sensitive to AKT IV inhibition, compared with other inhibitors. (E) The 3-gene miR-155 signature was predictive of treatment failure in DLBCL in the entire cohort (upper) and in the ABC-DLBCL subgroup, but not in GCB-DLBCL (lower). EFS is shown using expression quartiles (Q) of the 3-gene signature in the entire cohort, but divided in halves in subgroup analysis.
Our previous study showed that miR-155 activates the AKT pathway by targeting p85α and SHIP1 in DLBCL and indirectly enhances the phosphorylation of AKT, critical for cellular transformation.28 Also, increases in cell viability were observed in the miR-155-transduced GCB cell line, compared with control cell line, and conversely knockdown in an ABC cell line with high expression of miR-155 decreases cell viability.28 Here, we further demonstrated that a miR-155-transduced cell-line in a doxycycline-regulated retroviral vector system, as compared with a control cell line (control vector), are more sensitive to a synthetic, reversible AKT inhibitor (AKT-IV) at a low nanomolar range (156-190 nM). Akt inhibitor IV targets the adenosine triphosphate–binding site of a kinase (presumably phosphoinositide-dependent kinase 1 [PDK1]) upstream of AKT and downstream of phosphatidylinositol 3-kinase. In contrast, doxorubicin and phosphatidylinositol 3-kinase inhibitor (LY294002) treatment showed no significant differences in the transduced cell line (Figure 5D). These observations indicate that addiction to miR-155-induced AKT pathways may render cells sensitive to AKT inhibitors, a very relevant preclinical observation.
Development of a GEP-based miR-155 signature for DLBCL prognostication
To further evaluate the prognostic significance of miR-155, we constructed a GEP-based mRNA signature using (1) GEP obtained from ectopic expression of miR-155 in vitro in the DLHL16 cell line; (2) the miR-155 binding site identified by a consensus result of at least 3 of 7 computational algorithms (DIANA-microT, microRNA.org, miRDB, RNA22-HSA, TargetMiner, TargetScan and PicTar, from the hsa-mir-155 entry at the miRBase http://www.mirbase.org/); and (3) differential expression between miR-155 high- and low-expression DLBCL tumors in test set (Student t test = 0.05; fold change ≥2), an approach we previously published.29 To enrich for genes with the greatest prognostic value, we used a semisupervised prediction algorithm in a validation cohort of 222 DLBCL treated with R-CHOP and identified 6 transcripts representing 3 genes (KLHL5, PSIP1, CHD9) that were significantly correlated with EFS (Figure 5E). These transcripts showed low expression in DLHL16 cell line transduced with miR155 compared with control (supplemental Figure 8). As anticipated, low expression of these genes was associated with poor response to R-CHOP. In subsequent analyses, the average expression level of the 3 genes was used as the signature score to correlate with DLBCL EFS risk (P = .008). As anticipated, this 3-gene signature, when correlated with the DLBCL subgroups, predicted for EFS only in ABC-DLBCL (P = .04), but not in GCB-DLBCL, suggesting the robustness of the approach.
Discussion
The heterogeneity associated with B-cell lymphomas can partially be attributed in dysregulation at various B-cell developmental stages,30 which are tightly controlled by transcription factors (eg, PAX5, A-MYB, BCL6, LMO2, PRDM1).31 The crucial roles of miRNAs in B-cell maturation (miR-155, miR-181b, miR-150)32 and B-cell lymphomagenesis (miR-155, miR-150)27-33 have been demonstrated. Although specific expression of miRNA in ABC-DLBCL (miR-155, miR-221) or GCB-DLBCL (miR-125b)19,20 has been reported, only miR-155 expression was reliably associated with the ABC-DLBCL subgroup in these studies. The discrepancy in the reported miRNA signature may be either because of differences in the platforms used (eg, different variants of hybridization-based methods) or depth of deep sequencing.19-21 Additionally, their derivation using DLBCL cell lines34 or normal B cells instead of tumor specimens may also limit their potential for clinical utility. We derived miRNA signatures from de novo DLBCL or BL cases and used GEP-based classification as the “gold standard” for comparison. We further elucidated the relationship of miRNA signatures with cell lines, B-cell subsets, and stromal cells to differentiate neoplastic and tumor milieu contributions. Other than identifying aberrantly expressed miRNAs, we attempted to understand the functional consequences of their expression or dysregulation by correlating with the corresponding GEP.
The normal B-cell subsets expressed a unique repertoire of miRNAs as shown in Figure 1, with some miRNAs (eg, miR-155, miR-150) reported previously.19,21 Integrative analysis of miRNA-mRNA expression indicated that indeed miRNA expression is crucial for maintaining homeostasis of GC. The CB miRNA signature appears to regulate a multitude of functions in the GC, including cell-cycle transition, class-switch recombination, and the response to replicative stress (supplemental Table 1a,b). The importance of miRNAs is further supported by the observation that a group of miRNAs in CB target genes involved in the NF-κB pathway (MAP3K1, MAP3K14, MAPK1, KLF3), Janus kinase/signal transducer and activator of transcription pathway (negative regulator, SOCS5), or transforming growth factor β pathway (BMPR2).23 A group of 10 miRNAs in CB also targets genes involved in miRNA-mediated translational repression and protein translation/mRNA stability (TNRC6B and QKI), which also drives proliferation. It will be challenging to elucidate the functional relevance of individual miRNAs, and further investigation using novel methodologies like photoactivatable-ribonucleoside-enhanced crosslinking and immunoprecipitation (PAR-CLIP) is warranted.35
The correlation of miRNA profiles from normal B-cell subsets with their malignant counterparts revealed potential oncomiRs. For example, the expression analysis of miR-17-92 cluster members in B-cell subsets and their malignant counterparts showed remarkable dysregulation. We noted moderate upregulation (approximately fourfold) during the transition from naïve B cells to CB, but that was significantly higher (>10- to 20-fold) in BL compared with CB. This is likely because of constitutive MYC expression and frequent amplification of the 13q31.3 locus encompassing the miR-17-92 cluster in BL,36 thus demonstrating 2 distinct genetic aberrations with similar functional consequences and highlighting the critical role of miR-17-92 in BL pathogenesis. This was also further supported by integrative analysis of miRNA-mRNA expression in BL, which showed that at least 40-50 genes were targeted by 3 members of the miR-17-92 cluster in BL. These cluster members, being MYC-regulated, were a major component of the BL miRNA classifier. Another major characteristic of the classifier was low expression of miR-155 and miR-196b; the latter is often hypermethylated in tumors37 and known to target MYC.38 On the other hand, miR-155 suppresses activation induced-deaminase (AID) activities39 and may serve as a good marker to distinguish it from other GCB-derived tumors. Other upregulated miRNAs in BL miRNA-classifier (miR-296-3p, miR-296-5p, miR-130b) target genes involved in angiogenesis (VEGFR2, PDGFRβ),40 apoptosis (TP53INP1),41 and tumor suppression (RUNX3).42 The potential clinical utility of the BL classifier derives from the need to quantify fewer transcripts, which can be multiplexed5,6 and can be measured in FFPE specimens with equal precision.
The DLBCL miRNA profiles showed heterogeneous expression patterns consistent with GEP findings.36,43 Distinct from BL, DLBCL has prominent expression of miRNAs associated with stromal cells; however, clear association with normal B-cell subsets was also observed, especially CB-related miRNA profile with GCB-DLBCL. Not surprisingly, PMBL and GCB-DLBCL formed tight clusters, whereas ABC-DLBCL and UC-DLBCL also tend to cluster together. Because GEP-defined molecular DLBCL subgroups were interspersed, we derived an 8-miRNA classifier to distinguish among DLBCL subgroups. Of these, miR-155 is significantly associated with ABC-DLBCL, an observation reported previously,27 whereas miR-28-3p and miR-28-5p were upregulated in GCB-DLBCL. miR-155 was upregulated in in vitro activated B cells and ABC-DLBCL cell lines (OCI-Ly10, OCI-Ly3), but not in CBs and GCB-DLBCL cell lines. The constitutive expression of miR-155 in transgenic mice leads to the development of lymphoma, suggesting a crucial role in ABC-DLBCL tumorigenesis.44 The GEP analysis of miR-155 targets in ABC-DLBCL showed significant downregulation of genes regulating transforming growth factor β signaling (CSNK1G2, SMAD1) and cell cycle (CUTL1, DACH1, FOS, MYB, IGF1). Another miRNA upregulated in ABC-DLBCL (miR-542-3p) appears to be stroma-related from comparative analysis, but its function is not known. In contrast, many miRNAs upregulated in GCB-DLBCL appear to be contributed by the neoplastic B cells from comparative analysis of normal B cells and cell lines. Interestingly, most of the GEP-defined UC-DLBCLs were classified as ABC-DLBCL, as anticipated from unsupervised HC analysis, and also consistent with IHC-based classification.11 The miRNA classification of DLBCL was 90% concordant with the GEP-based classification and was reproducible in FFPE tissues. The discrepancy with the GEP-based classification may be because of the limitation of our quantitative real-time polymerase chain reaction platform, and addition of recently identified miRNAs may improve our classification in the future.
Several miRNAs have shown prognostic significance in DLCBL in both prerituximab45,46 and postrituximab eras.43,47 Consistent with these findings, miR-222 expression shows significant association with poor overall survival (data not shown). However, we investigated miRNA association with R-CHOP therapy failure and identified significant correlation of miR-155 expression with therapy failure. This observation is therapeutically relevant, as miR-155 antigomirs, when delivered in the form of nanoparticles, were able to reduce explant-derived tumors expressing high miR-155 levels in mice within a week.48 Our and other studies suggest that therapy resistance in DLBCL49,50 may be because of the constitutive activation of the AKT pathway, possibly regulated by miR-155 in ABC-DCBCL.28 Such chemoresistance has been observed in breast cancer with high miR-155 expression.51 Our experimental and in silico analyses suggest that miR-155 expression may directly or indirectly target the G1-S cell cycle transition, and AKT inhibitors may be pharmacologically effective and improve the survival of DLBCL patients with high miR-155 expression. The miR-155 target gene risk predictor could be used in future clinical trials, especially in the ABC-DLBCL subgroup. It may also provide useful insights into the therapeutic response in DLBCL.
In summary, we have shown that miRNAs can be used for diagnostic and prognostic evaluation, as well as serve as predictors of treatment effectiveness.
Presented in part at the 51st annual meeting of the American Society of Hematology, New Orleans, LA, December 5-8, 2009.
The publication costs of this article were defrayed in part by page charge payment. Therefore, and solely to indicate this fact, this article is hereby marked “advertisement” in accordance with 18 USC section 1734.
Acknowledgments
The authors wish to thank Martin Bast for clinical data collection and Greg Cochran for technical assistance.
This work was supported by a grant from the National Institutes of Health National Cancer Institute (1U01CA157581-01 [W.C.C.]) and is part of the Lymphoma/Leukemia Molecular profiling project (LLMPP). J.I. has received support from the Lymphoma Research Foundation, the Leukemia & Lymphoma Society, and the University of Nebraska Medical Center (UNMC)-Clinical and Translational Research mentored Scholars program pilot grant.
Authorship
Contribution: J.I., X.H., Y.S., and W.C.C. designed and performed the study and supervised all aspects of the research and analysis; J.I. finalized the manuscript; Y.L., C.L., K. Deffenbacher, K. Dybkaer, C.M.L., C.W., J.R., S.B., and T.W.M. assisted in research, data analysis, and interpretation; L.W., D.D.W., S.G., T.C.G., K.F., E.J., L.R., A.R., G.O., J.D., E.C., R.M.B., J.R.C., R.R.T., R.D.G., and L.M. Staudt were responsible for design of the study, pathology review, and scoring immunohistochemical stains and for the final approval of the manuscript; L.M. Smith and G.W. were responsible for the statistical analysis involved in the study; and J.M.V. and J.O.A. reviewed the clinical aspects and writing of manuscript.
Conflict-of-interest disclosure: The authors declare no competing financial interests.
The current affiliation for Y.L. is Department of Internal Medicine, Institute of Lymphoma, Henan Cancer Hospital, Zhengzhou, China.
Raymond R. Tubbs died on April 19, 2014.
Correspondence: Javeed Iqbal, Department of Pathology and Microbiology, LTC-11714, Zip 7760, University of Nebraska Medical Center, Omaha, NE 68105; e-mail: jiqbal@unmc.edu; and Wing C. Chan, City of Hope National Medical Center, Department of Pathology, Familian Science Building, Room 1215, 1500 East Duarte Rd, Duarte, CA 91010; e-mail: jochan@coh.org.
References
Author notes
J.I., Y.S., and X.H. contributed equally to this study.

