Abstract
We developed a murine model of CNS disease to obtain a better understanding of the pathogenesis of CNS involvement in pre-B-cell acute lymphoblastic leukemia (ALL). Semiquantitative proteomic discovery–based approaches identified unique expression of asparaginyl endopeptidase (AEP), intercellular adhesion molecule 1 (ICAM1), and ras-related C3 botulinum toxin substrate 2 (RAC2), among others, in an invasive pre-B-cell line that produced CNS leukemia in NOD-SCID mice. Targeting RAC2 significantly inhibited in vitro invasion and delayed disease onset in mice. Induced expression of RAC2 in cell lines with low/absent expression of AEP and ICAM1 did not result in an invasive phenotype or murine CNS disease. Flow cytometric analysis identified an enriched population of blast cells expressing ICAM1/lymphocyte function associated antigen-1 (LFA-1)/CD70 in the CD10+/CD19+ fraction of bone marrow aspirates obtained from relapsed compared with normal controls and those with primary disease. CD10+/CD19+ fractions obtained from relapsed patients also express RAC2 and give rise to CNS disease in mice. Our data suggest that combinations of processes are involved in the pathogenesis of CNS disease in pre-B-cell ALL, support a model in which CNS disease occurs as a result of external invasion, and suggest that targeting the processes of adhesion and invasion unique to pre-B cells may prevent recurrences within the CNS.
Introduction
Modern therapeutic protocols cure > 80% of children with acute lymphoblastic leukemia (ALL). The duration and complexity of therapy make it difficult to be precise about the exact mechanisms of relapse, and the means by which the leukemic cell survives both during and after chemotherapy remain unknown. Relapsed ALL is characterized by disease recurrence at extramedullary (EM) sites such as the CNS. At diagnosis, < 2% of children have CNS disease, but at relapse, > 30% have recurrence at this site. In fact, over the past 2 decades, although overall relapse rates have decreased, relapses within the CNS have proportionately increased in the United Kingdom.1 It is possible that the drugs used do not target the CNS effectively, giving rise to relapse at this site. However, apparently isolated EM disease is almost always associated with the presence of submicroscopic disease in the marrow,2 and in most cases relapses result from minor subclones present at the original diagnosis.3 This suggests that subclones with the innate ability to migrate and/or invade into EM compartments may in some way obtain a survival advantage and predispose to disease recurrence at a later date. The processes by which pre-B cells are able to transgress the blood-brain and blood–cerebrospinal fluid (CSF) barriers in the absence of inflammation remain unclear.
We have previously reported on the aberrant expression of the lysosomal cysteine protease asparaginyl endopeptidase (AEP) in cytogenetic subsets of childhood ALL with a high risk of relapse.4 AEP expression in epithelial cancers has been associated with increased migration, invasion, metastases, and recurrence.5,6 AEP was shown to be present extracellularly in the tumor microenvironment and its expression was linked to in vitro invasion.7 Matrix metalloproteinase 2, which participates in tumor invasion, is activated by AEP.8 Therefore, AEP may directly or indirectly (or both) facilitate tumor extension. Intracellular AEP expression is heterogeneous and active AEP lies within a discrete vesicular compartment that appears to be contiguous with the plasma membrane at the periphery of the cell.9 We speculated that, analogous to the phenomenon described for epithelial cancers, AEP-expressing pre-B cells invade the blood-brain and blood-CSF barriers, giving rise to CNS disease. Clearly, such a process would require changes in the cytoskeleton and plasma membrane, and AEP localizes adjacent to the plasma membrane in these cells. An AEP-mediated process is likely to involve plasma membrane remodeling and alterations in the plasma membrane proteome. The ability to investigate global proteomic changes has been greatly facilitated by the advent of relative quantitation approaches using mass spectrometry (MS). We report herein the use of relative quantification proteomic analyses of the lymphoblast plasma membrane in a murine model of CNS leukemia to identify putative mechanisms by which pre-B lymphoblasts are able to invade the CNS.
Methods
Cell lines
SD1 and REH were obtained from the Cancer Research UK Central Cell Service Department. SupB15 was obtained from DSMZ (the German Collection of Microorganisms and Cell cultures, Braunschweig, Germany). All cell lines were cultured at 37°C, 5% CO2 in RPMI-1640 GlutaMAX (Invitrogen) with 10% FBS (Sera Laboratories International).
Lentiviral expression/silencing and transduction of AEP/RAC2
AEP and ras-related C3 botulinum toxin substrate 2 (RAC2) were expressed using the pLNT/Sffv-MCS/ccdB lentiviral vector. Silencing was achieved using Pol II miR RNAi expression kits (Invitrogen). AEP- and RAC2-specific silencing oligonucleotides (Hmi413804-413807 for AEP and Hmi414444-414447 for RAC2) and negative control oligonucleotides (Invitrogen) were cloned into pLENTI6/V5-DEST. Cells were transduced and sorted by flow cytometry for green fluorescent protein (GFP) after 72 hours. Clones were obtained by single-cell sorting and analyzed for expression by Western blotting as described previously.
AEP activity assay
The fluorometric assay for AEP was carried out as described previously8 with slight modifications (supplemental Methods, available on the Blood Web site; see the Supplemental Materials link at the top of the online article).
In vitro invasion assay
Twenty-four-well, 6.5-mm, 5-micron Transwell plates (Corning) were coated with 80 μL/well Matrigel (BD Biosciences) diluted 1:10 with RPMI 1640. Cells (1 × 10⁵) were washed and resuspended in serum-free medium, plated into the upper chamber, and 0.5 mL of complete medium was added to the lower chamber. Plates were incubated for 24 hours at 37°, 5% vol/vol CO2, and cell counts in the lower chamber were determined with a coulter counter (Beckman Coulter). For inhibition assays, NSC23766 (RACi; Tocris Bioscience)10 or AEP inhibitor (AEPi; MVO26630) were added to the Matrigel and cells at a nonlethal final concentration of 100μM; control Matrigel/cells were treated with PBS.
Plasma membrane enrichment
Plasma membrane enrichment was carried out as described previously11 with slight modifications (supplemental Methods).
Western blotting
Western blotting was performed as described previously.9 Details of antibodies used are given in supplemental Methods.
Gel walks and MS
Gel walks and MS were carried out as described previously.12 Full experimental procedures are given in supplemental Methods.
SILAC and quantitative MS on plasma membrane fractions
For stable isotope labeling with amino acids in cell culture (SILAC), SD1, REH, and SupB15 cells were grown for a minimum of 5 passages according to the manufacturer's instructions in RPMI, 10% FBS medium (Invitrogen). SD1 cells were grown in heavy (H) lysine medium, whereas REH and SupB15 were grown independently in light (L) lysine medium. Full experimental procedures are given in supplemental Methods.
iTRAQ labeling of plasma membrane fractions and MS
For isobaric tag for relative and absolute quantification (iTRAQ), plasma membrane extracts from SD1, REH, and SupB15 were reduced, alkylated, digested, and labeled with iTRAQ reagents. The database searched was Uniprot version 15.9. Full experimental procedures are given in supplemental Methods.
Proteomic data analysis
Proteins identified from gel walks by MS were classified by Gene Ontology (www.ebi.ac.uk/GOA) into plasma membrane/associated, cytoplasmic, cytoskeletal, nuclear, endoplasmic reticulum/Golgi, mitochondrial, and unknown. All dataset comparisons were based on Uniprot accession comparisons and were performed using the R/BioConductor statistical package.13 The fold change cutoffs used are given in supplemental Methods. Scoring of proteins from the comparison of SILAC and iTRAQ data (see “Semiquantitative analyses of the plasma membrane proteome of the SD1, REH, and SupB15 cell lines”) were based on the number of observations of that protein from all 3 experiments: 2 SILAC and 1 iTRAQ.
Flow cytometry
Multiparameter analysis of single-cell suspensions from patient/healthy control bone marrow/leukemic cell lines was carried out using an LSRII flow cytometer (BD Biosciences). Cell lines/patient samples were stained with Alexa Fluor 700–conjugated anti–human CD19 (MHCD1929; Invitrogen) and Qdot 605–conjugated anti–human CD10 (Q10153; Invitrogen) to identify human B-lineage ALL cells. Dead cells were excluded based on 7-aminoactinomycin (Cambridge Bioscience) staining. Cells were stained for intercellular adhesion molecule 1 (ICAM1), lymphocyte function associated antigen-1 (LFA-1), CD44, CD38, and CD70. Details of the antibodies used are given in supplemental Methods.
RAC1/2 activity assays
Activation of RAC1 and RAC2 was determined using the EZ-Detect Rac Activation kit (Thermo Fisher Scientific) according to the manufacturer's protocol (supplemental Methods).
Fluorescence microscopy
For visualization of filamentous actin, washed cell pellets were embedded in Tissue-Tek O. C. T compound (Sakura Finetek) before being sectioned at 7 μm in a cryostat. Slides were fixed in ice-cold acetone for 15 minutes and washed 3 times in TBS. Filamentous actin (F-actin) was stained using Alexa Fluor 555 phalloidin (Invitrogen). DNA was counterstained and cells were mounted using ProLong Gold antifade reagent with DAPI (Invitrogen). Images were acquired using an epifluorescence microscope (Olympus BX51) equipped with a Coolsnap HQ CCD (Photometrics) and processed using Metamorph software Version 7.6.5.0 (Molecular Devices).
For visualization of lipid rafts, cytospins of cell lines were fixed with 3.7% formalin for 15 minutes at 4°C, and incubated with cholera toxin subunit B CTB-FITC at 2 μg/mL (Sigma-Aldrich) for 30 minutes at 4°C. Slides were counterstained with DAPI (Prolong Gold Antifade; Invitrogen).
Three-dimensional imaging was performed using an Olympus IX81 spinning disc confocal microscope equipped with a QuantEM CCD camera (Photometrics), and analyzed with Imaris software Version 7.2.3 (Bitplane).
Generation of GFP/Luc–positive leukemic cell lines
The retroviral vector rKat coexpressing firefly luciferase (Luc2) upstream of IRES.GFP,14 rKat.Luc2.IRES.GFP (kindly gifted by Dr David Gilham, University of Manchester, United Kingdom) was transfected into 293T cells using calcium phosphate (supplemental Methods). Cells were transduced by centrifugation in viral supernatant at 1200g for 3-4 hours in the presence of 4 μg/mL polybrene. After 14 days of culture, GFP-positive cells were sorted using flow cytometry (FACSAria sorter; BD Biosciences).
Primary human leukemia samples
Excess bone marrow aspirate was obtained at diagnosis from children with de novo and relapsed pre-B-cell ALL. Material from healthy sibling bone marrow donors served as controls. Consent was specifically sought for the storage and use of excess material for ethically approved research in accordance with the Declaration of Helsinki. The studies were approved by the Trent (East Midlands, United Kingdom; Reference 03/04/076) and Tameside and Glossop (Manchester, United Kingdom; Reference 07/Q1402/56) research ethics committees. Mononuclear cells were isolated from marrow samples by density centrifugation (Lymphoprep; Axis-Shield) and cryopreserved in RPMI 1640 with 20% FBS and 10% DMSO.
Live in vivo bioluminescence imaging of engrafted leukemic cells
All in vivo studies were carried out under the auspices of the 1986 Animals Scientific Procedures Act and under United Kingdom Coordinating Committee on Cancer Research guidelines, and animals were housed under strict pathogen-free conditions. Animal experiments were approved by the ethics review committee for the Paterson Institute for Cancer Research. Six- to 8-week-old severe SCID/beige (SCID/bg) or NOD/Lt-SCID/IL2Rγnull (NSG) mice (Harlan) received intravenous injections of GFP-Luc–positive leukemic cells at various doses (supplemental Figure 4). Engraftment and growth of the GFP-Luc–transduced cell lines was assessed at various time points by bioluminescent imaging monitored using the IVIS system 100 (Caliper Life Sciences). Mice were imaged while under 2% isoflurane anesthesia. Image acquisition of whole animals and tissues was done for 60 seconds of exposure time at a medium binning level. Dorsal and ventral views were obtained on all animals. Living Image software Version 3 (Caliper Life Sciences) was used to analyze the bioluminescence signals (in terms of photons/cm2/s/steradian). The pseudocolor scale was normalized (minimum = 20 000 and maximum = 70 000) to allow direct comparison between groups engrafted with different cell lines independently of the photon counts. All animals were killed after 25 days and tissues were collected for immunohistochemistry analysis using a panel of antibodies as described in “Flow cytometry.”
In vivo inhibition of RAC activity with NSC23766
NSG mice were intravenously injected with 3 × 10⁵ GFP/Luc SD1 cells. Cells were pretreated with either the RACi or PBS for 1 hour at 37°C before injection. Daily intraperitoneal injections of PBS or RACi (5 mg/kg) were given to the control (n = 6) and treatment groups (n = 7), respectively. Engraftment of leukemic cells was assessed by bioluminescence as described in “Live in vivo bioluminescence imaging of engrafted leukemic cells.” Total counts were calculated as the sum of average photon counts from both dorsal and ventral viewings. For head counts, Living Image software Version 3 (Caliper Life Sciences) was used to specify the region of interest used to calculate the average photon counts in all animals.
Immunohistochemistry
Tissue samples were fixed in 4% neutral-buffered formalin overnight and processed on a routine overnight program before being embedded in wax. Whole head specimens were fixed and processed as described previously.15
Epitope retrieval was performed using target retrieval solution (Dako) pH 6 (S2369) at 98°C for 12 minutes, followed by 15 minutes of cooling. All subsequent steps were performed on the Biogenex i6000 platform.
Statistical analysis
Data were analyzed with the unpaired Student t test using Prism software Version 5.0.3 (GraphPad).
Results
Invasiveness of SD1 and REH cells is partially facilitated by AEP activity
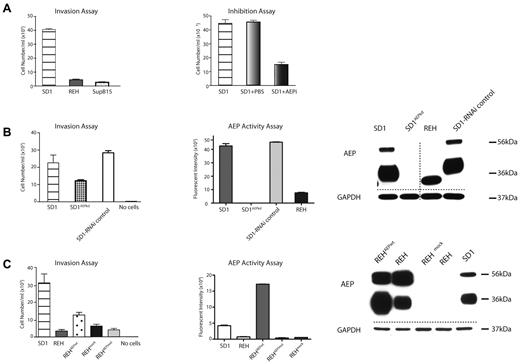
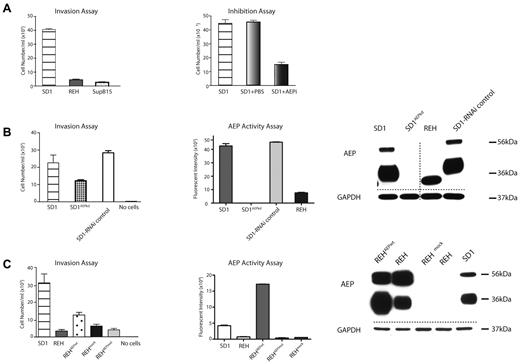
We showed previously that the Philadelphia-positive (Ph+) pre-B-cell ALL cell line SD1 expresses active AEP, whereas the SupB15 (Ph+) and REH (ETV6-RUNX1) cell lines do not.9 SD1 cells exhibited significantly increased invasion compared with REH and SupB15 cells in a Boyden chamber invasion assay (Figure 1A). Preincubating SD1 cells with the cell-permeable acyloxymethylketone AEP-specific inhibitor (AEPi)9,16 reduced invasion (Figure 1A). AEP expression in SD1 was targeted by transducing with a specific microRNA cloned into a lentiviral vector to generate a SD1AEPkd stable cell line. Western analyses and enzymatic assay confirmed that AEP expression was comparable to that observed for REH in SD1AEPkd cells, but the invasive ability of SD1AEPkd, though reduced, was not abolished (Figure 1B). REH cells were then transduced using lentivirus-expressing wild-type AEP (REHAEPwt). As a control, a H148A catalytically inert mutant, REHAEPmut, was used.17 Western analyses showed that both REHAEPwt and REHAEPmut expressed AEP in mature and processed forms; enzyme assays confirmed activity in REHAEPwt and that REHAEPmut was catalytically inactive (Figure 1C). REHAEPwt expresses high levels of active AEP and is significantly more invasive than mock-transduced REH, but is significantly less invasive compared with SD1 (Figure 1C). Overall, our results suggest that the process of invasion by pre-B-cell ALL cell lines is only partially facilitated by AEP. As we have previously noted, active AEP is enclosed in a discrete vesicle contiguous with the plasma membrane. One possibility is that AEP indirectly facilitates invasion by the modulation of other proteins on the plasma membrane. Alternatively, AEP and other unknown proteins cooperate in the invasive process. To investigate this, we next examined the quantitative differences in the plasma membrane proteome of SD1, REH, and SupB15 cells.
AEP partially facilitates cell invasion. (A) SD1 cells demonstrate increased invasion compared with REH and SupB15 (P < .0001; left panel) and invasion is significantly (P < .0001) inhibited by the AEP inhibitor AEPi (100μM; right panel). (B) AEP transcript knockdown (SD1AEPkd) results in a marked decrease in AEP expression (right panel) and activity (middle panel) and a decrease but not complete inhibition of invasion (P = .003; left panel). (C) Expression of AEP in REH (REHAEPwt) results in a marked increase in AEP expression (right panel) and activity (middle panel) but only a modest increase in invasion (P = .01; left panel). All assays were performed in triplicate and the data shown summarize results of 3 separate experiments. For invasion assays, error bars represent SEM. Activity assay results are shown as fluorescent intensity per well ± SEM. AEP precursor (56 kDa) and activity (36 kDa) are detected. Dashed lines denote spliced noncontiguous lines within gels.
AEP partially facilitates cell invasion. (A) SD1 cells demonstrate increased invasion compared with REH and SupB15 (P < .0001; left panel) and invasion is significantly (P < .0001) inhibited by the AEP inhibitor AEPi (100μM; right panel). (B) AEP transcript knockdown (SD1AEPkd) results in a marked decrease in AEP expression (right panel) and activity (middle panel) and a decrease but not complete inhibition of invasion (P = .003; left panel). (C) Expression of AEP in REH (REHAEPwt) results in a marked increase in AEP expression (right panel) and activity (middle panel) but only a modest increase in invasion (P = .01; left panel). All assays were performed in triplicate and the data shown summarize results of 3 separate experiments. For invasion assays, error bars represent SEM. Activity assay results are shown as fluorescent intensity per well ± SEM. AEP precursor (56 kDa) and activity (36 kDa) are detected. Dashed lines denote spliced noncontiguous lines within gels.
Semiquantitative analyses of the plasma membrane proteome of the SD1, REH, and SupB15 cell lines
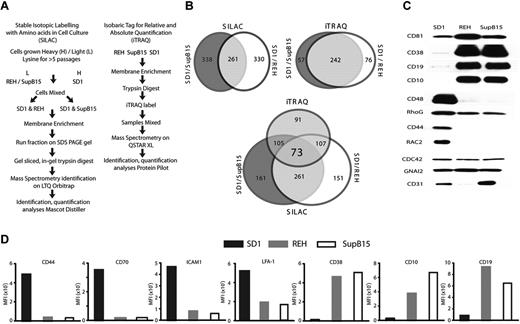
A sucrose density gradient technique was optimized for plasma membrane fraction extraction (supplemental Methods, supplemental Figure 1A, and supplemental Table 1) and a discovery approach was used to identify proteins unique to the SD1 plasma membrane. Complementary approaches were taken for semiquantitative analyses of the plasma membrane proteome: iTRAQ18,19 and an in vivo technique using SILAC.20,21 The work flows for the 2 techniques are shown in Figure 2A. The SILAC technique used 12C- and 13C-labeled lysine and generated 2 datasets, SD1 compared with SupB15 and SD1 compared with REH. Using 4 channels, the iTRAQ experiment generated a multiplex dataset. The 2 techniques differed not only in the way the proteins were labeled, but also in the instrumentation and software used for analyses (supplemental Results and supplemental Figure 1B). Therefore, the data obtained from both SILAC and iTRAQ experiments (supplemental Tables 2-4) were combined to identify proteins differentially expressed in both datasets (Figure 2B and supplemental Figure 2A). Seventy-three proteins were commonly identified to be present in all datasets; of these, 57 were discordant with regard to the direction of expression between SILAC and iTRAQ. Eleven proteins were overexpressed, 4 were underexpressed, and 1 was unchanged in SD1 in both the SILAC experiments and in iTRAQ.
SILAC and iTRAQ datasets identify common proteins differentially expressed on the plasma membrane of SD1 cells. (A) Summary of SILAC and iTRAQ workflows. (B) Proportionate Venn diagrams showing overlap in identification of proteins between SILAC, iTRAQ, and all datasets. (C) Western blot analysis of plasma membrane fractions of proteins identified as differentially expressed in SD1 cells compared with both REH and SupB15 by SILAC and iTRAQ. CD81, CD38, CD19, and CD10 were underexpressed by SD1 in both SILAC and iTRAQ. CD48, RHOG, CD44, and RAC2 were overexpressed by SD1 in both SILAC and iTRAQ, and CD31 was identified to be overexpressed in only the SILAC data. All lanes were loaded with equal amounts of protein. Because these are plasma membrane extracts, traditional loading controls were not available. However, CDC42 and GNAI2 proteins were identified as equally expressed in all 3 cell lines by MS and Western analyses. (D) Flow cytometric analysis confirmed that CD44, CD70, ICAM1, and LFA-1 were overexpressed and CD38, CD10, and CD19 were underexpressed in SD1 compared with REH and SupB15 cells.
SILAC and iTRAQ datasets identify common proteins differentially expressed on the plasma membrane of SD1 cells. (A) Summary of SILAC and iTRAQ workflows. (B) Proportionate Venn diagrams showing overlap in identification of proteins between SILAC, iTRAQ, and all datasets. (C) Western blot analysis of plasma membrane fractions of proteins identified as differentially expressed in SD1 cells compared with both REH and SupB15 by SILAC and iTRAQ. CD81, CD38, CD19, and CD10 were underexpressed by SD1 in both SILAC and iTRAQ. CD48, RHOG, CD44, and RAC2 were overexpressed by SD1 in both SILAC and iTRAQ, and CD31 was identified to be overexpressed in only the SILAC data. All lanes were loaded with equal amounts of protein. Because these are plasma membrane extracts, traditional loading controls were not available. However, CDC42 and GNAI2 proteins were identified as equally expressed in all 3 cell lines by MS and Western analyses. (D) Flow cytometric analysis confirmed that CD44, CD70, ICAM1, and LFA-1 were overexpressed and CD38, CD10, and CD19 were underexpressed in SD1 compared with REH and SupB15 cells.
Because only 16 proteins were found to be present and shared similar changes in all analyses, less stringent parameters were used to expand the dataset. Proteins were scored based on the number of experiments in which they were identified, and these were required to show a consistent change. Proteins identified in both SILAC experiments and iTRAQ were given a score of 5; proteins seen in iTRAQ and 1 SILAC experiment were scored as 4, proteins seen in either iTRAQ or both SILAC experiments were scored as 3, and proteins unique to a single SILAC experiment were scored as 2. After scoring, proteins identified as MHC or HLA or not classified as plasma membrane/membrane–associated by Gene Ontology classification22 were removed. Using this method, 94, 81, and 41 proteins, overexpressed, underexpressed, or showed no change compared with the less-invasive cell lines identified on the SD1 plasma membrane (supplemental Table 5).
For the purposes of this study, the 94 up-regulated proteins were classified into the following biologic processes: cytoskeletal organization, migration, adhesion, and invasion (32%); signaling (24%); endocytosis and vesicle formation (24%); and differentiation/others (20%; Table 1). These data were confirmed using Western and flow cytometric analyses (Figure 2C-D). SD1 cells expressed lower surface levels of CD10, CD19, and CD38 compared with REH and SupB15 cells. In contrast, CD44, CD70, LFA-1, and ICAM1 were relatively overexpressed on SD1 cells (Figure 2D). Whereas AEP expression was identified in only one iTRAQ analysis, it was detected by Western blotting of plasma membrane protein extracts of SD1 cells (supplemental Figure 2B). We have subsequently discovered that trypsin digestion of AEP is an inefficient process and creates peptides not easily detected by MS. Alternative digestion methods can be used to identify AEP, but these approaches limit the use of MS as a discovery tool for other proteins.
SD1 plasma membrane proteome is indicative of a RAC2-mediated invasive process
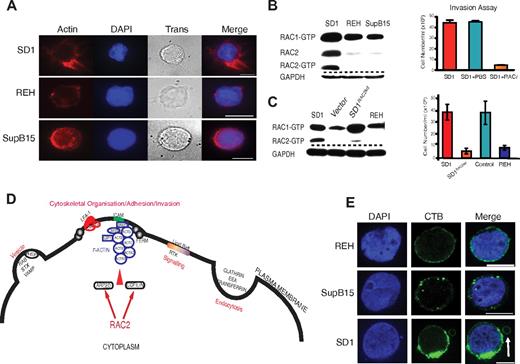
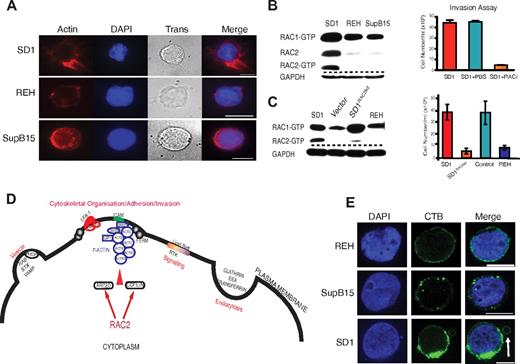
The proteins discussed in this paragraph refer to those listed in Table 1. Because SD1 has active lysosomes and demonstrates aberrant perimembranous vesicular location,9 it was not surprising to find proteins involved in endocytosis and vesicle formation (Table 1). Further, the presence of actin proteins, ARP2/3, and F-actin–capping protein in the plasma membrane–enriched fraction suggested the presence of F-actin nucleation, a prerequisite for cellular interactions and invasion. FERM proteins (band 4.1, EZRIN, RADIXIN, and MOESIN) link F-actin to membrane proteins.23 LSP1,24 LCP1,25 and BASP126 interact with F-actin. Phalloidin staining confirmed the presence of organized F-actin in SD1 (Figure 3A). αL and β2 integrins were identified in the analysis complex to form LFA-1. Both ILK and LCP127 are associated with integrin-mediated cell adhesion. Activation of LFA-1 in mature B cells leads to cell adhesion via interaction with stromal cell ICAM1.28 SD1 cells show high expression of LFA-1 and ICAM1 on their membranes and also show homotypic adhesions in suspension culture conditions. Antibody blockade of ICAM1, but not LFA-1, interferes with homotypic adherence (supplemental Figure 2C), but does not influence in vitro invasion (supplemental Figure 2D). RAC2, identified in both SILAC and iTRAQ analyses, is critical for the adhesion to ICAM1 by mature B cells29 and is also implicated in ARP2/3–mediated generation of F-actin.30 When probed for levels of active RAC1 and RAC2, SD1 cells have higher levels of active RAC2 protein compared with REH and SupB15 (Figure 3B). To investigate the role of RAC2, SD1 cells were preincubated with the RAC inhibitor NSC23766 (RACi)10 before an invasion assay. The treated cells showed a 90% reduction in invasion (Figure 3B). RAC2 transcript–depleted SD1 cells (SD1RAC2kd) showed similar proliferation (supplemental Figure 5C) to the parent cell line, but significantly decreased invasion compared with the empty vector control that was comparable to that seen in REH cells (Figure 3C). RAC2 transduced REH (REHRAC2) cells do not show increased transwell invasiveness compared with the parent cell line. However, SupB15RAC2 cells were moderately invasive compared with the parental cells (supplemental Figure 3A). Flow cytometric data showed that the expression of ICAM1 was significantly down-regulated in REHRAC2 but up-regulated in SupB15RAC2–expressing cells (supplemental Figure 3B), providing a possible explanation for the differences in phenotypes. A conceptual model of the possible role of RAC2 in cytoskeletal reorganization based on the proteins described in Table 1 is shown in Figure 3D.
RAC2 is associated with cytoskeletal reorganization and invasion by SD1 cells. (A) Organized filamentous actin is present in SD1 cells compared with REH and SupB15. Cells were stained with Alexa Fluor 555 phalloidin (red); DAPI stains the nuclei. Trans refers to bright-field images. Original magnification is ×100. Scale bar indicates 5 μm. (B) Whereas all cell lines expressed RAC1, SD1 alone expressed detectable active RAC2 (left panel). Invasion by SD1 cells was significantly (P < .0001) inhibited by preincubation with a RAC inhibitor (RACi, 100μM; right panel). (C) SD1RAC2kd cells expressed RAC1 but not RAC2 (left panel) and exhibited significantly decreased in vitro invasion compared with SD1 (P = .009; right panel). Dashed lines denote spliced noncontiguous lines within gels. (D) Conceptual model of proteins identified in Table 1 suggesting that adhesion is mediated by ICAM1 and LFA-1 as part of a RAC2-initiated invasion process. (E) All 3 cell line membranes were enriched in lipid rafts, most prominently in SD1. In addition, in SD1, lipid raft–enriched peripheral vesicles are seen (arrow). Lipid rafts were labeled with the fluorophore-tagged cholera toxin B subunit (green); DAPI stains the nucleus. Original magnification is ×100. Scale bar indicates 10μm. For panels A and E, data were viewed and captured using a low light imaging system based around a Zeiss Axiovert 200M microscope using a Zeiss α Plan-Fluor 100×/1.45 numerical aperture (NA) objective lens and an Andor iXon3 EMCCD 888 camera. Using Applied Scientific Imaging MS2000, stage focus and volume imaging were attained. The system illumination was controlled via Sutter λ 10-3 and associated filter wheels and light sources were a Sutter Lambda-LS 300W Xenon UV light source and a Thorlabs white light LED for transmitted light. UV filters used were the Chroma ET-Sedat filter set. The equipment was enclosed in an environmental chamber and for fixed cell imaging, all work was carried out at 25°C. The equipment was controlled via Metamorph software (Molecular Devices).
RAC2 is associated with cytoskeletal reorganization and invasion by SD1 cells. (A) Organized filamentous actin is present in SD1 cells compared with REH and SupB15. Cells were stained with Alexa Fluor 555 phalloidin (red); DAPI stains the nuclei. Trans refers to bright-field images. Original magnification is ×100. Scale bar indicates 5 μm. (B) Whereas all cell lines expressed RAC1, SD1 alone expressed detectable active RAC2 (left panel). Invasion by SD1 cells was significantly (P < .0001) inhibited by preincubation with a RAC inhibitor (RACi, 100μM; right panel). (C) SD1RAC2kd cells expressed RAC1 but not RAC2 (left panel) and exhibited significantly decreased in vitro invasion compared with SD1 (P = .009; right panel). Dashed lines denote spliced noncontiguous lines within gels. (D) Conceptual model of proteins identified in Table 1 suggesting that adhesion is mediated by ICAM1 and LFA-1 as part of a RAC2-initiated invasion process. (E) All 3 cell line membranes were enriched in lipid rafts, most prominently in SD1. In addition, in SD1, lipid raft–enriched peripheral vesicles are seen (arrow). Lipid rafts were labeled with the fluorophore-tagged cholera toxin B subunit (green); DAPI stains the nucleus. Original magnification is ×100. Scale bar indicates 10μm. For panels A and E, data were viewed and captured using a low light imaging system based around a Zeiss Axiovert 200M microscope using a Zeiss α Plan-Fluor 100×/1.45 numerical aperture (NA) objective lens and an Andor iXon3 EMCCD 888 camera. Using Applied Scientific Imaging MS2000, stage focus and volume imaging were attained. The system illumination was controlled via Sutter λ 10-3 and associated filter wheels and light sources were a Sutter Lambda-LS 300W Xenon UV light source and a Thorlabs white light LED for transmitted light. UV filters used were the Chroma ET-Sedat filter set. The equipment was enclosed in an environmental chamber and for fixed cell imaging, all work was carried out at 25°C. The equipment was controlled via Metamorph software (Molecular Devices).
The previous report of RAC2-mediated cell adhesion was described in normal mature B cells downstream of signaling cascades initiated by activation of the BCR.29 Although SD1 is a pre-B-lymphoblast cell line, the presence of lysosomes and proteins associated with lipid raft formation (which include the Src kinases CSK, LYN, FGR, and LCK) suggested the possibility that RAC2 activation was being initiated by BCR signaling. Staining of the plasma membrane with the cholera toxin B subunit demonstrates that all 3 cell lines, including SD1, were enriched in lipid rafts (Figure 3E). In addition, the peripheral vesicle has a discrete lipid raft–enriched membrane. We were unable to detect the presence of a mature BCR on the surface of any of the 3 cell lines (data not shown). All 3 lines expressed CD179a (pre-BCR) on their surface, confirming they are not mature B cells (supplemental Figure 3C). Down-regulation of CD10, CD19 with expression of Igλ, and CD48 suggest that SD1 arises from neoplastic transformation of a more differentiated progenitor precursor. Therefore, activation of RAC2 in SD1 appears to be independent of BCR signaling.
RAC2-expressing cells produce CNS disease in a mouse model of childhood ALL
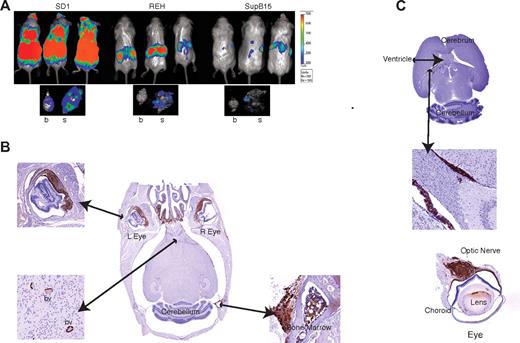
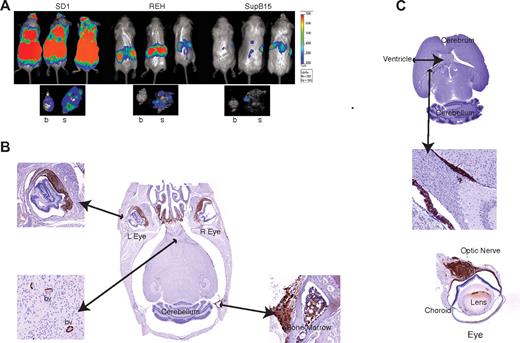
The cell lines were transduced with retrovirus coexpressing the firefly Luc gene upstream of IRES-GFP and transplanted intravenously into SCID/beige mice. Engraftment was monitored in vivo by monitoring Luc activity. Mice engrafted with SD1 cells had a higher overall tumor burden with increased Luc activity in the cranium (8 of 10) at day 25 compared with those engrafted with REH (2 of 9) or SupB15 (6 of 10; Figure 4A and supplemental Figure 4). After killing the mice, Luc activity was still detectable in the brains and skulls of SD1-engrafted mice but predominantly in the skulls of REH and SupB15-engrafted mice (Figure 4A). Histopathologic examination confirmed that SD1, but not REH or SupB15, caused invasive CNS disease (Figure 4B-C and supplemental Figure 5A-B). As shown in Figure 4B, SD1 breaches the blood-brain barrier to infiltrate the brain parenchyma and optic nerve. The cells also traverse the blood-CSF barrier because they are detected within the cerebral ventricles (Figure 4C).
SD1 cells produce CNS disease in a mouse model. (A) Representative images of 3 mice from a cohort of 10 animals/cell line are shown. SD1, REH, and SupB15 cause disease in SCID-Beige mice, with SD1 producing the highest disease burden as measured by bioluminescence. The lower panel shows the representative luminescence activity in brain (b) and skull (s) for each cell line. Bioluminescence values are indicated as photons/cm2/s. (B) Histological sections of the brain of a representative SD1-engrafted SCID-Beige mouse. Sections were stained with anti-GFP antibody and show infiltration in the nasal region and cranial marrow cavity. Cells can be seen within blood vessels (bv) of the brain parenchyma and within the choroid layer of the eye. (C) Section through the brain of a representative mouse transplanted with SD1 cells showing cells within the lateral ventricles (top and middle panels) and infiltrating along the optic nerve (bottom panel). Images were captured on a Mirax scanner (3Dhistech) using a Zeiss Fluor 20×/0.75 NA objective lens and a Marlin (Allied Vision Technologies) color camera. The system uses the 3DHistech scan software, and images were viewed and exported using 3DHistech panoramic viewer software.
SD1 cells produce CNS disease in a mouse model. (A) Representative images of 3 mice from a cohort of 10 animals/cell line are shown. SD1, REH, and SupB15 cause disease in SCID-Beige mice, with SD1 producing the highest disease burden as measured by bioluminescence. The lower panel shows the representative luminescence activity in brain (b) and skull (s) for each cell line. Bioluminescence values are indicated as photons/cm2/s. (B) Histological sections of the brain of a representative SD1-engrafted SCID-Beige mouse. Sections were stained with anti-GFP antibody and show infiltration in the nasal region and cranial marrow cavity. Cells can be seen within blood vessels (bv) of the brain parenchyma and within the choroid layer of the eye. (C) Section through the brain of a representative mouse transplanted with SD1 cells showing cells within the lateral ventricles (top and middle panels) and infiltrating along the optic nerve (bottom panel). Images were captured on a Mirax scanner (3Dhistech) using a Zeiss Fluor 20×/0.75 NA objective lens and a Marlin (Allied Vision Technologies) color camera. The system uses the 3DHistech scan software, and images were viewed and exported using 3DHistech panoramic viewer software.
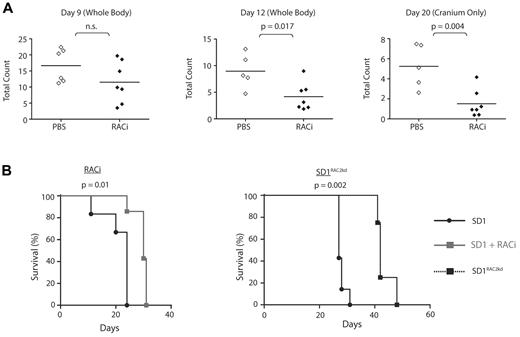
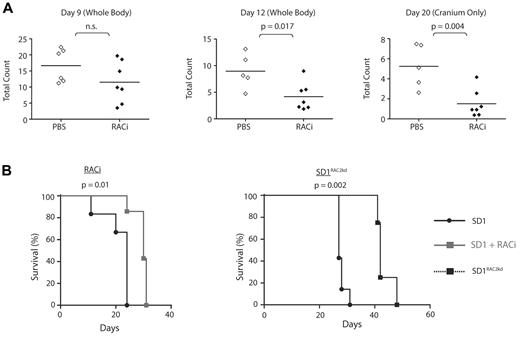
Our proteomic investigations showed a major difference between these cell lines in the status of motile response proteins and RAC2. To evaluate the in vivo role of RAC2, we pretreated SD1 Luc-GFP cells with RACi (supplemental Figure 5D). Engraftment was delayed after treatment (Figure 5A). From days 12-20, the animals treated with the inhibitor showed significantly less tumor burden in extramedullary organs and cranium (Figure 5A), and this translated to a difference in survival. (Figure 5B left panel). Mice were injected with control SD1 or SD1RAC2kd cells and their survival monitored. Both cell lines showed similar proliferation profiles (supplemental Figure 5C). SD1RAC2kd mice demonstrated a significant increase in median survival (27 vs 42 days, P < .002; Figure 5B right panel). Although significantly delayed, infiltration of the CNS and liver were detectable at the time of culling in SD1RAC2kd mice though none developed optic nerve infiltration. (supplemental Figure 6D). Histopathologic examination of infiltrated CNS tissue confirmed that the cells expressed ICAM1 and LFA-1 (supplemental Figure 6E-F). Because of cross-reaction of RAC2 antibodies with mouse tissue, we were unable to confirm RAC2 expression in histologic sections. REHRAC2 and SupB15-engrafted mice survived longer than REH- and SupB15RAC2-engrafted mice (supplemental Figure 7A-B). None of these mice developed CNS disease. Therefore, our analyses suggest that the invasive phenotype of SD1 requires the combined expression of RAC2, AEP, and possibly ICAM1/LFA-1, among other factors.
Engraftment, migration to cranium, and overall disease burden after transplantation with SD1 is decreased by the concomitant administration of RACi or microRNA silencing of RAC2 (RAC2kd). (A) Bioluminescence signal intensity measured as photons/cm2/s in mice transplanted with SD1 cells with or without RACi. Horizontal lines denote mean intensity. (B) Survival of mice engrafted with SD1 was significantly improved with the concomitant administration of the RACi (left panel) as was the survival of SD1RAC2kd engrafted mice (right panel).
Engraftment, migration to cranium, and overall disease burden after transplantation with SD1 is decreased by the concomitant administration of RACi or microRNA silencing of RAC2 (RAC2kd). (A) Bioluminescence signal intensity measured as photons/cm2/s in mice transplanted with SD1 cells with or without RACi. Horizontal lines denote mean intensity. (B) Survival of mice engrafted with SD1 was significantly improved with the concomitant administration of the RACi (left panel) as was the survival of SD1RAC2kd engrafted mice (right panel).
Subpopulations of pre-B-cell ALL blast cells express ICAM1 and RAC2
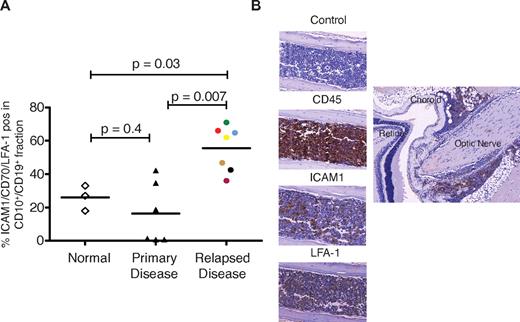
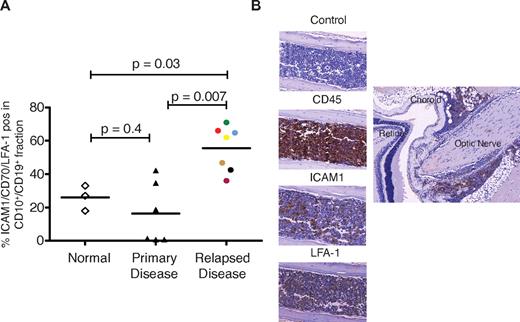
Recurrent disease localized to the extramedullary compartment is likely to arise from a minor subclone present at original diagnosis but enriched at relapse. We examined the expression of selected plasma membrane proteins identified by the proteomic analysis in CD10+/CD19+ fractions of mononuclear cells obtained from bone marrow of healthy donors and patients with de novo and relapsed ALL. Both LFA-131 and ICAM132 have been previously identified to be expressed by subsets of pre-B lymphoblasts. We also chose to investigate the expression of CD44 and CD70 because both scored 5 in the comparative proteomic analysis. CD44 expression has been associated with disease recurrence and CD70 identified as a potential therapeutic target in childhood ALL.33 Moreover, signaling through CD70 appears crucial to B-cell activation.34 Single staining of these markers failed to show a difference between normal and relapsed ALL. However, the proportion of CD10+/CD19+ cells positive for ICAM1/CD70/LFA-1 were significantly higher in bone marrow samples from relapsed ALL (n = 7) patients compared with healthy individuals and de novo disease (Figure 6A). Active RAC2 was detected in 4 patients (supplemental Figure 8). Bone marrow isolates obtained from 5 relapsed patients were successfully engrafted into NSG mice, and the median survival was 100 days. CNS disease, as verified by histopathology, occurred in a proportion of mice transplanted with cells from 4 patients. The patient whose cells did not produce CNS disease had the lowest expression of ICAM1. Sections through mouse skull and brain from a mouse transplanted with cells from 1 patient (6 mice transplanted, 1 died of unknown causes, and 5 developed CNS disease) is shown in Figure 6B.
Subsets of CD10+/CD19+ lymphoblasts express ICAM1, LFA-1, and cause CNS disease in mice. (A) The CD10+/CD19+ cell population of patients with relapsed ALL significantly overexpress LFA-1/ICAM1/CD70 compared with the CD10+/CD19+ cell populations of normal volunteers (controls) and those with de novo disease. Horizontal lines denote mean values. (B) Histopathological sections obtained from a representative mouse transplanted with cells from patient 36 (purple circle in panel A). The left panel shows infiltration of cranial bone marrow by ICAM1- and LFA-1–positive leukemic cells. The right panel shows infiltration of CD45-positive cells along the optic nerve. Images were captured on a Mirax scanner (3Dhistech) using a Zeiss Fluor 20×/0.75 NA objective lens and a Marlin (Allied Vision Technologies) color camera. The system uses the 3DHistech scan software, and images were viewed and exported using 3DHistech panoramic viewer software.
Subsets of CD10+/CD19+ lymphoblasts express ICAM1, LFA-1, and cause CNS disease in mice. (A) The CD10+/CD19+ cell population of patients with relapsed ALL significantly overexpress LFA-1/ICAM1/CD70 compared with the CD10+/CD19+ cell populations of normal volunteers (controls) and those with de novo disease. Horizontal lines denote mean values. (B) Histopathological sections obtained from a representative mouse transplanted with cells from patient 36 (purple circle in panel A). The left panel shows infiltration of cranial bone marrow by ICAM1- and LFA-1–positive leukemic cells. The right panel shows infiltration of CD45-positive cells along the optic nerve. Images were captured on a Mirax scanner (3Dhistech) using a Zeiss Fluor 20×/0.75 NA objective lens and a Marlin (Allied Vision Technologies) color camera. The system uses the 3DHistech scan software, and images were viewed and exported using 3DHistech panoramic viewer software.
Discussion
Whereas AEP expression facilitates invasion by pre-B cells, our analyses did not identify a direct mechanism. The analytical methods used may not have permitted this. Density-gradient enrichment of plasma membrane fractions could result in the loss of membrane-associated proteins, those attached via lipids and proteins that are secreted, limiting identification to integral membrane proteins. Therefore, proteins involved in an AEP-mediated process may have been lost in processing. Tryptic digestion is not optimal for AEP detection by MS and limits the number of proteins that can be accurately identified. Nevertheless, whereas we cannot comment on proteins not detected, we can be reasonably confident that the proteins listed in Table 1 are overexpressed on the plasma membrane of SD1 cells; these have now been validated by Western analyses and flow cytometry.
Disease recurrence within the CNS in children with ALL is associated with a poor prognosis. In the absence of a clear understanding of the pathogenesis of the disease, designing effective therapies remains a major challenge. We propose a model that can be exploited using a systems biology approach to develop better clinical strategies. Our experiments show that compared with the REH and SupB15 cell lines, SD1 shows in vitro invasion. Mice transplanted with SD1 cells developed leukemia with organ infiltration and CNS disease. The latter was characterized by breaches in both the blood-brain and blood-CSF barriers. Whereas in vitro invasion is reduced by inhibition of or knockdown of AEP in SD1, overexpression of active AEP did not produce the same phenomenon in REH cells. This suggested that although AEP contributes, it is simply one facet of the invasive process. Cell adhesion precedes invasion. In SD1, ICAM1 and possibly LFA-1 participate in this process. Proteomic and microscopic analyses suggested that the invasive phenotype of the SD1 cell line is initiated by RAC2 activation, which results in filamentous actin organization. Therefore, inhibition or knockdown of RAC2 expression considerably reduces in vitro invasion, delays onset of disease in mice, and decreases the degree of CNS infiltration. In hematopoietic cells, RAC2 regulates actin assembly through the activation of cofilin and the ARP2/3 complex30 and is critical for F-actin assembly.35 These downstream elements are identifiable in SD1 (Table 1 and Figure 3A) and are a prerequisite for cytoskeletal reorganization before invasion. Whereas RAC1 has been implicated in tumor cell invasion,36 little is known about the role of RAC2 in this process. This may reflect the fact that RAC2 expression is restricted to the hematopoietic system. Murine models suggest that RAC2 is not required for engraftment but for the retention of hematopoietic stem cells in the bone marrow,37,38 and this may be an explanation for the increased survival of the REHRAC2 mice. In mature B cells, RAC2 is activated via BCR signaling, leading to inside-out activation of LFA-1, cellular adhesion, and immunologic synapse formation.29 SD1 cells do not have BCR (supplemental Figure 3C), but upstream effectors of RAC2, the Src kinases, were identified29,39 (Table 1), suggesting an active, BCR-independent signaling pathway. Overall, our data suggest a model by which lymphoblasts, which express ICAM1 and LFA1, adhere to endothelial cells. We propose that the activation of RAC2 via signaling molecules embedded within lipid rafts leads to actin polymerization and peripheral trafficking of AEP-positive lysosomes. This process facilitates the extravasation of lymphoblasts into extramedullary compartments. Indeed, subpopulations of native pre-B lymphoblasts obtained from patients show expression of LFA-1, ICAM1, RAC2, and AEP. ICAM1- and LFA-1–positive cells from these patients produce leukemia and CNS disease in mice. Clearly, this is a streamlined hypothesis; other factors are likely to be involved. For example, proteases may act in concert with AEP in the active lysosomes and the role of the number of signaling molecules identified in the invasive process remains to be clarified. Nevertheless, potential therapeutic targets for the treatment or prevention of CNS disease identified here are CD70,40 lysosomal proteases,41 adhesion molecules,42 and RAC2.43
CNS disease is primarily seen in children with ALL who are treated with chemotherapy1 and less frequently in adults who receive transplantation.44,45 A similar phenomenon has been reported in rodent xenograft models.46,47 This suggests a complex model of interactions between leukemic and host cells in a cytotoxic environment that first facilitates leukemic cell survival and then invasion into extramedullary sites. The processes described in the preceding paragraph lead to cell adhesion and presumably long-term survival, including protection from chemotherapy.48 The mechanisms by which this happens may be different for T-cell and pre-B-cell ALL. In a recent murine model of T-cell leukemia, expression of the chemokine receptor CCR7 was shown to be essential for CNS infiltration,49 suggesting that inhibition of CCR7 be considered as an adjunct to primary therapy. Our data in pre-B-cell ALL suggest that cell adhesion and invasion is via nonligand signaling, which activates RAC2. This may be initiated either by heterotypic (stromal cells) or homotypic interactions. Such a signaling pathway may be via SRC, the guanine nucleotide exchange factors Vav1 and Vav2, or PI3K. These signals may also promote cell survival. Whereas our data show that subpopulations of pre-B-cell ALL blasts indeed express LFA-1 and ICAM1, further work is required to understand precisely which subpopulation of lymphoblasts is capable of giving rise to CNS disease and the actual mechanisms by which the lymphoblasts transgress the blood-brain and blood-CSF barriers and persist in the CNS. Only then will we be able to devise therapies to prevent or treat recurrence of disease in childhood ALL. Current therapeutic strategy relies on CNS-directed therapy such as radiotherapy and/or intrathecal cytotoxics to eradicate leukemic cells thought to be resident within the brain. The models described in the present study suggest that CNS disease occurs as a result of external invasion. Therefore, a more effective strategy to prevent/treat CNS disease may well be to target the adhesion invasion process itself.
The online version of this article contains a data supplement.
The publication costs of this article were defrayed in part by page charge payment. Therefore, and solely to indicate this fact, this article is hereby marked “advertisement” in accordance with 18 USC section 1734.
Acknowledgments
The authors thank Tim Somervaille for the NSG mice; the biologic research unit at the Paterson Institute for Cancer Research for all in vivo studies; Colin Watts, Thomas Southgate, and David Gilham for reagents and technical advice; and Angeliki Malliri for critical evaluation of the manuscript.
This work was supported by program grants from Cancer Research UK (V.S.) and the Leukemia Lymphoma Research Fund (A.W.).
Authorship
Contribution: M.H., A.W., and V.S. designed the study; M.H., F.V.C., S.A., D.S., J.L., M.W., D.B., K.M., G.A., M.B., S.B., Y.C., J.B., S.K., C.D., and A.M. performed the experiments; M.H., F.V.C., C.M., P.S., A.W., and V.S. interpreted the data; and M.H. and V.S. wrote the paper.
Conflict-of-interest disclosure: The authors declare no competing financial interests.
Correspondence: Vaskar Saha, CRUK Children's Cancer Group, School of Cancer & Enabling Sciences, Paterson Institute for Cancer Research, The University of Manchester, Manchester Academic Health Science Centre, Manchester M20 4BX United Kingdom; e-mail: vaskar.saha@manchester.ac.uk.
References
Author notes
M.H., F.V.C., and S.A. contributed equally to this study.

