Abstract
Gene therapy has proven its potential to cure diseases of the hematopoietic system. However, severe adverse events observed in clinical trials have demanded improved gene-transfer conditions. Whereas progress has been made to reduce the genotoxicity of integrating gene vectors, the role of pretransplantation cultivation is less well investigated. We observed that the STIF (stem cell factor [SCF], thrombopoietin [TPO], insulin-like growth factor-2 [IGF-2], and fibroblast growth factor-1 [FGF-1]) cytokine cocktail developed to effectively expand murine hematopoietic stem cells (HSCs) also supports the expansion of leukemia-initiating insertional mutants caused by gammaretroviral gene transfer. We compared 4 protocols to examine the impact of prestimulation and posttransduction culture in STIF in the context of lentiviral gene transfer. Observing 56 transplanted mice for up to 9.5 months, we found consistent engraftment and gene-marking rates after prolonged ex vivo expansion. Although a lentiviral vector with a validated insertional-mutagenic potential was used, longitudinal analysis identifying > 7000 integration sites revealed polyclonal fluctuations, especially in “expanded” groups, with de novo detection of clones even at late time points. Posttransduction expansion in STIF did not enrich clones with insertions in proto-oncogenes but rather increased clonal diversity. Our data indicate that lentiviral transduction in optimized media mediates intact polyclonal hematopoiesis without selection for growth-promoting hits by posttransduction expansion.
Introduction
Hematopoietic stem cells (HSCs) are characterized by their ability to self-renew and differentiate into all cell types of the hematopoietic system. At physiologic steady-state conditions, only a limited number of HSCs are active at any given time, thus preserving a large fraction of quiescent cells as a reservoir for long-term regeneration.1 As demonstrated by retroviral gene marking in transplanted mice or nonhuman primates, cycling HSCs are either periodically replaced (clonal succession), maintained as a constant minor pool (clonal maintenance), or follow a mixture of succession, maintenance, and cyclic reactivation (clonal fluctuation).2-5 The latter depends on a rich HSC pool and thus requires optimized HSC culture and gene-transfer conditions to be maintained in gene-therapy protocols.
Targeting HSCs with integrating gene vectors guarantees lifelong expression of the therapeutic transgene in all progeny cells, and has been effective for the cure of monogenetic diseases such as X-linked severe combined immunodeficiency, chronic granulomatous disease, adenosine deaminase deficiency, and adrenoleukodystrophy.6-9 In the first 2 conditions, murine leukemia virus–derived gammaretroviral vector integrations in the vicinity of proto-oncogenes have led to premalignant clonal dominance and malignant transformation,7,8 and similar observations have been made in murine models.10,11 Some of the integration sites that mediate malignant transformation in humans (eg, EVI1, CCND2, and LMO2) can also be found in the Retroviral Tagged Cancer Gene Database,12 a collection of integration sites of mouse tumors induced by replicating murine leukemia virus. Genes identified in multiple independent tumors are referred to as common insertion sites and are potentially linked to tumor initiation.
To improve transduction of quiescent HSCs, HIV-1–derived lentiviral vectors have been developed and evaluated in preclinical and clinical studies.9,13,14 In contrast to gammaretroviral vectors, which preferentially integrate close to transcription start sites, CpG islands, and DNaseI-hypersensitive sites, lentiviral vectors preferentially integrate within active transcription units.15,16 In assays detecting transformed mutants, this pattern was found to be 3- to 10-fold safer than the gammaretroviral preferences,17,18 most likely related to a reduced frequency of enhancer-mediated gene activation.
The ability of lentiviral vectors to transduce nondividing cells allows for the use of short, “stemness”-preserving protocols for genetic modification of HSCs.19 Interestingly, recently described cytokine cocktails such as STIF (stem cell factor [SCF], thrombopoietin [TPO], insulin-like growth factor-2 [IGF-2], and fibroblast growth factor-1 [FGF-1]), which mimic conditions found in fetal liver, support efficient in vitro amplification of murine and human HSCs.20 Increasing the number of transplantable HSCs in vitro should promote therapeutic outcome by accelerated engraftment and multilineage reconstitution, and may create a basis for pretransplantation quality control. Because differences have been discovered in the lentiviral integration pattern between cycling and arrested cells,21,22 implications for therapeutic applications need to be investigated.
Preclinical gammaretroviral and lentiviral gene-marking experiments, mostly performed under suboptimal cytokine conditions, resulted in clonal selection in vivo with or without insertional transformation.23,24 Conversely, prolonged ex vivo cultivation of gammaretroviral vector–transduced hematopoietic cells has been associated with an increased risk of clonal outgrowth and malignant transformation in mice and nonhuman primates.25,26
In the present study, we aimed to test the impact of ex vivo HSC expansion in STIF conditions on the induction of clonal dominance in the context of efficient lentiviral gene transfer. We first demonstrate the potential of STIF conditions to expand gammaretroviral vector insertional mutants with a leukemogenic potential. We next investigated the impact of short and extended ex vivo cultivation of murine HSCs before and after transduction with a lentiviral vector. To this end, we chose a lentiviral vector design that may transform hematopoietic cells by insertional mutagenesis if they are cultivated under suboptimal cytokine conditions.18 After transplantation into lethally irradiated mice, gene-marked cells were tracked for up to 9.5 months for vector copy number, transgene expression, clonality, and integration site distribution by longitudinal 454 high-throughput sequencing using bar-coded primers to assess specimen identity. Analysis of > 7000 unique integration sites revealed a polyclonal, fluctuating repopulation pattern without obvious selection of insertional mutants by posttransduction expansion. Clonal diversity at late time points was highest in recipients of cells that were transduced after short prestimulation with subsequent prolonged ex vivo expansion.
Methods
Lentiviral vector production
Third-generation vector stocks of the “self-inactivating” (SIN) lentiviral vector (pRRL.PPT.SF.eGFP.wPRE) containing an internal spleen focus-forming virus (SFFV) promoter, the enhanced green fluorescent protein (eGFP) cDNA, and the posttranscriptional regulatory element of woodchuck hepatitis virus (wPRE) devoid of X-protein sequences were produced by cotransfecting 4 plasmids (5 μg of transfer vector, 12 μg of gag/pol, 6 μg of Rev, and 1.5 μg of MD.G encoding vesicular stomatitis virus glycoprotein) into 293T cells.27 Titers of lentiviral particles were determined on SC-1 fibroblasts, and supernatants with unconcentrated titers > 1 × 10⁷ infectious particles/mL were stored at −80°C.
Animal housing and irradiation procedure
Animal experiments were approved by the supervising animal research review board at Hannover Medical School. C57Bl/6J mice were obtained from Charles River Laboratories and kept in specific pathogen-free conditions in the animal facility of Hannover Medical School. Female C57Bl/6J CD45.2 mice were used as recipients. In the first experiment, they also served as donors, whereas in the second experiment bone marrow cells from congenital C57BL/6J PeP3b (CD45.1-positive) male and female donor mice were mixed before purification and subsequent transduction. Recipient CD45.2 mice were conditioned < 24 hours before transplantation by myeloablative irradiation (10 Gy), and during the first 3 weeks thereafter were given ciprofloxacin (Bayer) at 100 mg/mL in the drinking water for antimicrobial protection.
Lineage depletion of bone marrow cells and transduction and cultivation of Lin− cells
Bone marrow cells of C57Bl/6J mice were flushed out of femurs and tibias, and lineage-negative (Lin−) cells were isolated by magnetic sorting using lineage-specific antibodies (lineage cell depletion kit; Miltenyi Biotec). Lin− cells were subsequently cultured in a standard medium (StemSpan serum-free medium; StemCell Technologies) supplemented with 2% penicillin/streptomycin and 1% glutamine (both from PAA Laboratories), 100 ng/mL of murine SCF (mSCF), 100 ng/mL of human FMS-like tyrosine kinase 3 ligand (hFlt3L), 20 ng/mL of murine interleukin 3 (mIL3), and 100 ng/mL of human interleukin 11 (hIL11) at 5 × 10⁵ cells/mL. Alternatively, cells were cultured in STIF medium20 (StemSpan serum-free medium supplemented with 2% penicillin/streptomycin, 1% glutamine, 10 ng/mL of mSCF, 20 ng/mL of murine TPO [mTPO], 20 ng/mL of murine IGF-2 [mIGF-2], and 10 ng/mL of human FGF-1 [hFGF-1] at 1 × 10⁶ cells/mL). All cytokines were purchased from Peprotech, with the exception of mIGF-2, which was purchased from R&D Systems. For overnight transduction of Lin− cells in STIF medium, vectors were preloaded with a multiplicity of infectious units of 20 on tissue-culture plates coated with RetroNectin (TaKaRa), as described previously.28 Transductions were performed separately for each recipient mouse. For long-term expansion, STIF medium was additionally supplemented with heparin (Liquemin in a 1:1000 dilution; Roche) 24-48 hours after transduction. Transduction efficiency as indicated by eGFP+ cells was measured before bone marrow transplantation or after additional expansion of cells by fluorescence-activated cell sorting and quantitative polymerase chain reaction (PCR) on genomic DNA samples.
Flow cytometry
Freshly isolated and in vitro–expanded cells were stained with CD3, B220, Gr-1, Ter119, and CD11b (all eFluor450 labeled) antibodies against lineage markers, and with cKit-allophycocyanin, Sca1-peridinin chlorophyll A protein-Cy5.5, and CD48-fluorescein isothiocyanate for stem-cell markers. Dead cells were excluded by 4′,6-diamidino-2-phenylindole staining. To analyze transgene expression in erythrocytes and platelets, blood was diluted in phosphate-buffered saline and populations were gated by forward/sideward scatter. To analyze leukocytes from peripheral blood, bone marrow, and spleen, erythrocytes were lysed using PharmLyse (BD Pharmingen) 1× concentrated for 10 minutes at room temperature. Leukocytes were stained with allophycocyanin- or phycoerythrin-labeled antibodies against CD45.2, CD3, CD19, and CD11b. CD45.1 was either detected by CD45.1-phycoerythrin or CD45.1 streptavidin and biotin-phycoerythrin antibodies. Antibodies were purchased from eBioscience or BD Pharmingen.
LM-PCR and 454 pyrosequencing
Lentiviral integration sites were determined in peripheral blood genomic DNA purified with the QIAamp DNA Blood Mini Kit (QIAGEN) using ligation-mediated PCR (LM-PCR), as described previously.29 In brief, up to 100 ng of template DNA was digested with Tsp509I (New England BioLabs), products of the restriction digest containing lentiviral integrations were extended from biotinylated primers, captured with streptavidin-coated magnetic beads (Invitrogen), and the junctions of 3′ long terminal repeat (3′LTR) and genomic DNA were amplified by standard primers and 2 consecutive exponential PCRs. In addition, vector sequences were amplified to a 234-bp internal control product. Band pattern was analyzed by agarose gel electrophoresis.
In LM-PCR samples designated for 454 pyrosequencing, the internal control band was removed by SacI (New England BioLabs) digest after the first exponential PCR (M. Grez, personal communication, October 2008). Bar-coded primers,30 providing unique identity tags to LM-PCR products, were used for the second exponential PCR. Equal amounts of PCR products purified via QIAquick PCR Purification Kit (QIAGEN) were used for sequencing. Sequencing was performed at GATC Biotech (Konstanz, Germany) or in the Department of Medicinal Microbiology at Hannover Medical School using GS FLX reagents (Roche). LM-PCRs of gammaretroviral integration sites in leukemic mice were performed with gammaretroviral-specific primers amplifying the 5′LTR genomic DNA junction and splenocyte genomic DNA as a template. Integration site identity was confirmed by repetition of LM-PCR on MseI-digested template DNA.
Sequence analysis
The raw reads from the 454 sequencer were sorted according to bar code, clustered using CD-HIT software,31 trimmed to remove linker sequences, and submitted to BLAST alignment.32 Common insertion sites were determined using the kernel density permutation approach.33 To rule out accumulation of small reads near identical sites that could be caused by misread sequences, we considered every BLAST hit within 20 bp to originate from the same vector insertion. This approach resulted in removal of 1192 sequences from the input dataset. Genes closest to insertion sites were annotated with functions using PantherDB software34 level 2 biologic pathway annotations. We also used annotations of previous integration studies.35,36 In addition, the retrieved integrations were compared with those in the Retroviral Tagged Cancer Gene Database.12 For more details, see supplemental Methods (available on the Blood Web site; see the Supplemental Materials link at the top of the online article).
Results
STIF medium expands gammaretroviral insertional mutants with leukemogenic potential
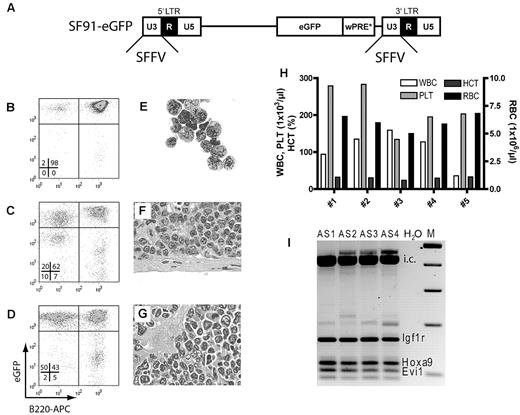
We first wanted to test the potential of the STIF cocktail by mediating expansion of HSCs during prolonged ex vivo culture20 to promote the engraftment of insertional mutants in recipient mice. Because heparin in the STIF cocktail interferes with retroviral gene transfer, Lin− cells were prestimulated for 2 days in a standard cytokine cocktail (mSCF, hFl3L, and hIL11, all at 100 ng/mL, and mIL3 at 20 ng/mL; SF311), transduced with an LTR-driven gammaretroviral vector (SF91-eGFP, Figure 1A) that is known to be a strong insertional mutagen,10,11,18 and then transferred into STIF medium. Transduced cells were expanded for 10 days and then transplanted into 5 lethally irradiated mice.
Prolonged ex vivo cultivation (13 days) of murine HSCs in combination with gammaretroviral insertional mutagenesis triggers leukemogenesis. (A) Schematic representation of an integrated gammaretroviral LTR-driven SF91-eGFP vector. Indicated are the 5′ and 3′ LTRs consisting of U3, R, and U5 regions. The SFFV promoter is located in both U3 regions and drives the expression of eGFP. (B-D) Representative fluorescence-activated cell sorting analysis for eGFP and B cell–specific B220 expression in leukemic mouse bone marrow (B), spleen (C), and peripheral blood leukocytes (D). (E) Cytospin of bone marrow, (F) histology of spleen, and (G) liver sections showing blasts and infiltrates of leukemic cells (all at 1000× magnification). (H) Blood counts of 5 mice transplanted with the aforementioned leukemia. WBC indicates white cell count; PLT, platelet count; HCT, hematocrit; and RBC, red blood cell count. (I) LM-PCRs on genomic DNA of splenocytes from mice AS1, AS2, AS3, and AS4. Vector integration sites identified by sequencing are indicated. i.c. indicates internal control; and M, marker.
Prolonged ex vivo cultivation (13 days) of murine HSCs in combination with gammaretroviral insertional mutagenesis triggers leukemogenesis. (A) Schematic representation of an integrated gammaretroviral LTR-driven SF91-eGFP vector. Indicated are the 5′ and 3′ LTRs consisting of U3, R, and U5 regions. The SFFV promoter is located in both U3 regions and drives the expression of eGFP. (B-D) Representative fluorescence-activated cell sorting analysis for eGFP and B cell–specific B220 expression in leukemic mouse bone marrow (B), spleen (C), and peripheral blood leukocytes (D). (E) Cytospin of bone marrow, (F) histology of spleen, and (G) liver sections showing blasts and infiltrates of leukemic cells (all at 1000× magnification). (H) Blood counts of 5 mice transplanted with the aforementioned leukemia. WBC indicates white cell count; PLT, platelet count; HCT, hematocrit; and RBC, red blood cell count. (I) LM-PCRs on genomic DNA of splenocytes from mice AS1, AS2, AS3, and AS4. Vector integration sites identified by sequencing are indicated. i.c. indicates internal control; and M, marker.
The recipients showed efficient gene marking (∼ 50%) in the peripheral blood 4 months after transplantation (data not shown) and started to develop leukemia 3-4 months later. When the first mouse died undiagnosed, the next 4 were put to death. Flow cytometry of bone marrow, spleen, and peripheral blood leukocytes revealed an overrepresentation of eGFP+/B220+ cells (Figure 1B-D). Blasts infiltrated multiple organs, had a lymphoid morphology (Figure 1E-G), and induced acute leukemia with extensive leukocytosis in secondary recipients (Figure 1H). LM-PCR revealed identical vector integrations in all 4 primary recipients within or in the vicinity of 3 proto-oncogenes: insulin-like growth factor receptor-1 (Igf1r; 118514 bp downstream of the transcriptional start site [TSS] located in intron 2 in forward orientation), homeobox A9 (Hoxa9; 812 bp downstream of TSS in forward orientation), and ecotropic viral integration site 1 (Evi1; 105376 bp upstream of TSS in the reverse orientation; Figure 1I). In our previous studies using a similar vector expressing a neutral transgene but without posttransduction expansion, leukemic transformation was only observed in 2% of primary recipients.25,28 These experiments demonstrated that when initially culturing cells under suboptimal conditions and transducing cells with an LTR-driven gammaretroviral vector, posttransduction expansion in STIF medium supports engraftment of gene-modified cells, including leukemia-initiating insertional mutants.
STIF conditions expand cells with an HSC-like phenotype
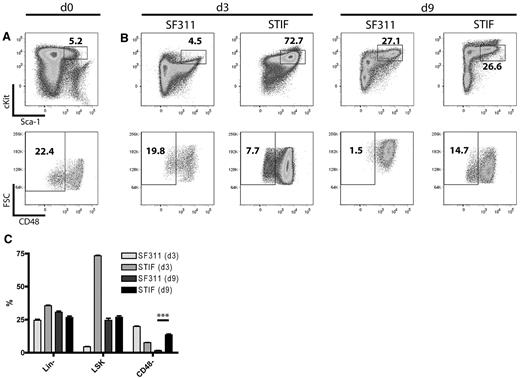
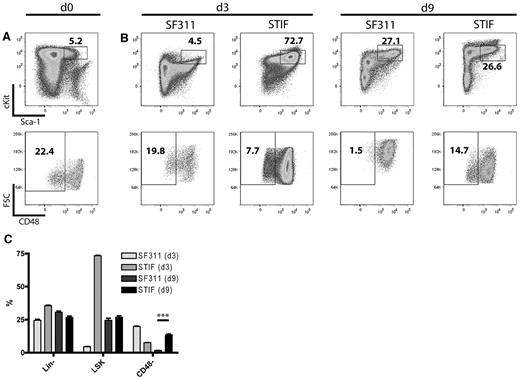
Previous studies have shown that cultivated HSCs reside in the Lin−Sca1+c-Kit+ (LSK) CD48− gate.37,38 Because we noticed that cultured bone marrow cells undergo major phenotypic changes when exposed to the standard cytokine cocktail used for prestimulation in the above experiment, we performed serial flow cytometry of Lin− cells cultured with SF311 versus STIF conditions. This revealed significant differences in their putative HSC compartment after 3 and 9 days of cultivation. Whereas STIF-cultured cells expanded only 8-fold, with preservation of a predominantly small LSK CD48− population, standard conditions induced a 440-fold cell expansion with a concomitant increase in cell size (as indicated by the forward scatter) and almost complete loss of CD48− cells after 9 days (Figure 2). Although we did not reproduce the quantitative repopulation assays described by Zhang et al,20 these data indicate that STIF conditions support the expansion of a population with a primitive, HSC-like phenotype.
In vitro expansion of HSCs in STIF cytokines. (A) Freshly purified murine lineage-negative cells in the LSK gate (top panel) were analyzed for CD48 expression (bottom panel). (B) Cells expanded for 3 or 9 days in SF311 or STIF cytokines were analyzed as in panel A. (C) Percentage of stem cell markers present on SF311- and STIF-expanded cells after 3 and 9 days of cultivation. Data represent the mean of 3 cultures. Significance was tested with the Student 2-sided t test, and significance was reached with P < .001.
In vitro expansion of HSCs in STIF cytokines. (A) Freshly purified murine lineage-negative cells in the LSK gate (top panel) were analyzed for CD48 expression (bottom panel). (B) Cells expanded for 3 or 9 days in SF311 or STIF cytokines were analyzed as in panel A. (C) Percentage of stem cell markers present on SF311- and STIF-expanded cells after 3 and 9 days of cultivation. Data represent the mean of 3 cultures. Significance was tested with the Student 2-sided t test, and significance was reached with P < .001.
STIF conditions do not lead to preferential survival of insertional mutants in vitro
Having observed the engraftment of gammaretroviral vector–transduced leukemia-initiating cells after culture in STIF, we then tested the impact of culture conditions on the recovery of insertional mutants in an in vitro immortalization assay. These experimental conditions select for gammaretroviral or lentiviral insertional mutants with up-regulation of Evi1, which show a robust replating phenotype in limiting dilution when prestimulated, transduced, and expanded in medium supplemented with mSCF, hFlt3L, hIL11, and mIL3 (SF311).18,39,40 Lin− cells transduced with SF91-eGFP produced a high frequency of replating clones (76 of 96 positive wells), as is typically observed in this assay. This frequency was reduced when introducing serum-free conditions in the transduction phase (10 of 96 positive wells), and was further diminished when TPO was added or IL3 was left out of the culture (supplemental Table 1). Consistently, in 2 experiments, no mutants could be recovered when using STIF before replating. These data indicate that the interplay of IL3 and FCS is required to mediate strong progenitor-cell proliferation41 and subsequently a high recovery rate of insertional mutants in the in vitro immortalization assay (supplemental Table 1). In contrast to our previously used standard conditions (SF311), STIF conditions do not support preferential survival of insertional mutants.
Testing the impact of the STIF medium on reconstitution by lentivirally marked HSCs
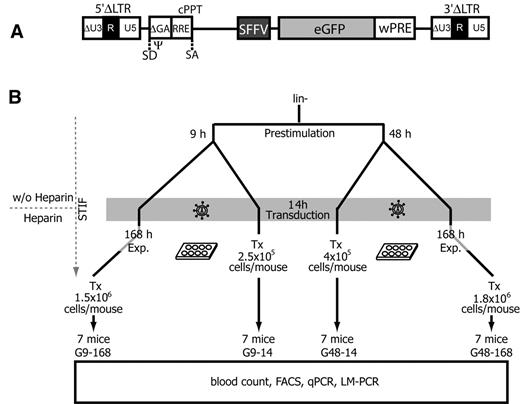
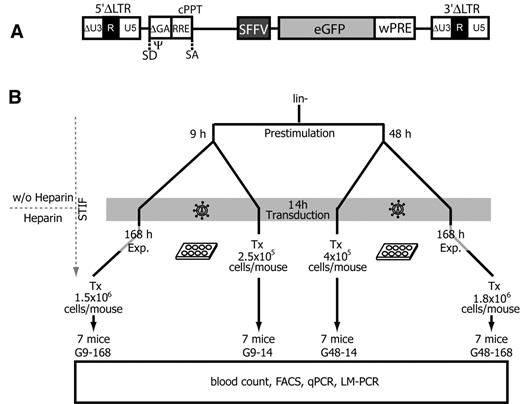
Based on the above findings, we developed experimental conditions to determine the consequences of lentiviral gene transfer in the STIF medium, and addressed the effects of prestimulation and posttransduction culture on the engraftment, persistence, and expansion of gene-marked cells. We chose a state-of-the-art, third-generation lentiviral-SIN vector expressing eGFP under control of the internal SFFV promoter (Figure 3A). This vector represents the strongest insertional mutagen among all lentiviral-SIN vectors we have tested to date, and is able to transform hematopoietic cells by insertional activation of proto-oncogenes such as Evi1 (in analogy to the leukemia described in Figure 1).18 In contrast to the experimental conditions used for gammaretroviral transduction in Figure 1, STIF conditions were also applied during prestimulation before gene transfer, and in one arm of the experiment a short prestimulation time was used because of the potential of lentiviral vectors to transduce nondividing cells. As in experiments with gammaretroviral vector, we added heparin only after transduction. We thus transplanted lentiviral vector–transduced Lin− cells treated with 4 different protocols (Figure 3B). In the first setting, the impact of culture conditions was minimal: cells were prestimulated for 9 hours in STIF, transduced overnight (14 hours), and transplanted (group G9-14). In the second condition, cells were expanded for 7 days (168 hours) after 9 hours of prestimulation and overnight transduction (group G9-168; minimal effect of prestimulation, maximal effect of expansion). In other arms, we prestimulated for 48 hours in STIF, transduced overnight, and transplanted directly (group G48-14; maximal effect of prestimulation, minimal effect of expansion) or after 7 days of cultivation (group G48-168; maximal effects of prestimulation and expansion, conditions equivalent to the experiments shown in Figure 2). To include the majority of the HSC clones expanding in vitro, the number of transplanted cells per mouse was increased from 2.5 × 10⁵ in the G9-14 group up to 1.8 × 10⁶ in the G48-168 group. These differences in cell number reflect the 7-fold amplification in 1 week. Each of the 7 mice per group was transplanted with an independently transduced and cultivated batch of cells to test the reproducibility of the experimental conditions and to avoid the spread of dominant mutants across different recipients.
Experimental design. (A) Schematic diagram of a lentiviral SIN provirus integrated into the genome of a target cell. Virus boundaries are represented by the 5′ and 3′ LTRs, consisting of a minimal U3 (ΔU3) as well as the R and U5 regions. Transgene expression is driven by the internal SFFV promoter located upstream of eGFP and wPRE. SD indicates splice donor; SA, splice acceptor; Ψ, extended packaging signal encompassing residual gag sequences (ΔGA); RRE, Rev-responsive element; and cPPT, central polypurin tract. (B) Murine Lin− cells were purified and prestimulated for 9-48 hours in STIF medium without heparin. Cells were transduced overnight, and either directly transplanted (Tx) or expanded (Exp.) for another 7 days (168 hours) in STIF medium containing heparin. Each of the 7 mice per group was transplanted with an independently transduced and cultivated batch of cells. Group names (G9-14, G48-14, G9-168, and G48-168) indicate the duration of prestimulation and posttransduction expansion times (in hours). Tx, number of transplanted cells per mouse.
Experimental design. (A) Schematic diagram of a lentiviral SIN provirus integrated into the genome of a target cell. Virus boundaries are represented by the 5′ and 3′ LTRs, consisting of a minimal U3 (ΔU3) as well as the R and U5 regions. Transgene expression is driven by the internal SFFV promoter located upstream of eGFP and wPRE. SD indicates splice donor; SA, splice acceptor; Ψ, extended packaging signal encompassing residual gag sequences (ΔGA); RRE, Rev-responsive element; and cPPT, central polypurin tract. (B) Murine Lin− cells were purified and prestimulated for 9-48 hours in STIF medium without heparin. Cells were transduced overnight, and either directly transplanted (Tx) or expanded (Exp.) for another 7 days (168 hours) in STIF medium containing heparin. Each of the 7 mice per group was transplanted with an independently transduced and cultivated batch of cells. Group names (G9-14, G48-14, G9-168, and G48-168) indicate the duration of prestimulation and posttransduction expansion times (in hours). Tx, number of transplanted cells per mouse.
Most consistent lentiviral gene marking after expansion posttransduction
Two experiments were conducted in the way described in Figure 3B. In the first, mice were observed for 6 months with bimonthly bleedings. A normal multilineage reconstitution with gene-marked cells was detected by blood counts (supplemental Figure 1A-D) and flow cytometry (supplemental Figure 2). One mouse of group G9-14 (#4) and one of G9-168 (#1) died without obvious signs of illness 18 and 22 weeks after transplantation, respectively. Histology revealed no signs of malignant hematologic disorders. Mean eGFP marking in the peripheral blood declined in groups G9-14 (55.55% ± 10.60% to 35.95% ± 18.94%; mean ± SD) and G48-14 (50.43% ± 12.62% to 21.86% ± 14.26%) between 2 and 6 months. Because mean vector copy numbers remained stable (supplemental Figure 3A), transgene silencing may explain this decline. Marking was relatively stable in both groups receiving cells after prolonged posttransduction cultivation: G9-168 (41.78% ± 10.44% to 46.11% ± 13.86%) and G48-168 (21.50% ± 7.27% to 20.78% ± 22.64%; supplemental Figure 2A). In spleen (supplemental Figure 2B) and bone marrow (supplemental Figure 2C) analyzed 6 months after transplantation, the shorter prestimulation (G9-168) gave higher marking rates. Corresponding differences in transduction rates (42.32% ± 1.98% for G9-168 and 19.39% ± 0.55% for G48-168, respectively) already existed before transplantation (data not shown), consistent with vector copy number in the peripheral blood (supplemental Figure 3A). Extended cultivation of lentiviral-transduced Lin− cells in STIF medium supported long-term engraftment, and none of the transplanted mice developed symptoms of leukemia (blood cell counts are shown in supplemental Figure 1A-D and organ status in supplemental Figure 4).
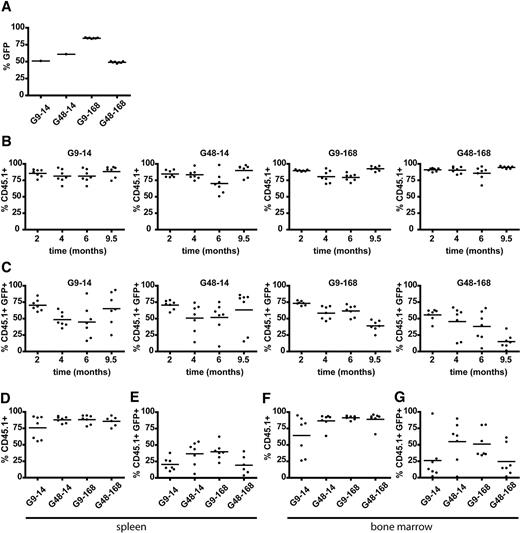
In the second experiment, we transplanted CD45.1+ cells into CD45.2+ recipients and extended the observation time to 9.5 months, thus increasing the sensitivity to detect putative donor cell–derived transformation events. Culture and transduction conditions were the same as in the first experiment, again with separate cultures for each recipient. Mean eGFP expression in pretransplantation samples was in the range of 50% to 85% (Figure 4A). Donor chimerism remained high and stable (Figure 4B), blood counts and organ weights indicated normal hematopoiesis (supplemental Figure 1E-H and Figure 4B), and eGFP+ cells constituted > 50% of donor cells in most animals until 6 months after transplantation (Figure 4C). In end-point samples, the distribution of gene-modified CD45.1+/eGFP+ double-positive donor cells within the different organs was most consistent in group G9-168 (39.02% ± 8.07%), and eGFP+ cells were more frequent but also more variable in groups transplanted without expansion after transduction: G9-14, 65.16% ± 24.68% and G48-14, 63.23% ± 31.05% (Figure 4C). Interestingly, the 2 short-term culture groups (G9-14 and G48-14) but not the 2 groups receiving expanded cells (G9-168 and G48-168) had a lower rate of eGFP+ cells in the bone marrow and spleen (Figure 4E,G) compared with peripheral blood at month 9.5 (Figure 4C). This can be taken as a sign of more robust long-term engraftment after cell expansion. Whereas the vector copy number in the peripheral blood did not indicate exhaustion of gene-marked hematopoiesis, some animals showed a reduced vector copy number in bone marrow at this late time point (supplemental Figure 3C). However, this discrepancy of gene marking in central and peripheral hematopoiesis was observed in animals of all groups and thus cannot be ascribed to variations in the culture conditions. As in the first experiment, the lower transduction rate obtained with the combination of longer prestimulation and posttransduction expansion (G48-168, Figure 4A) was reflected in the final analysis. Again, in both central and peripheral hematopoietic cells, eGFP expression was least variable in group G9-168. These data show that extended cultivation of lentiviral-transduced hematopoietic cells in STIF medium supports engraftment and long-term reconstitution.
Chimerism and gene marking of donor-derived CD45.1+ peripheral blood leukocytes, splenocytes, and bone marrow cells. (A) eGFP-marking rates in STIF-cultivated Lin− cells of pretransplantation samples. Because of limited cell numbers, data of G9-14 and G48-14 represent pooled samples 4-5 days after transduction. Individual data points in G9-168 and G48-168 represent eGFP marking in individually transduced and transplanted batches of cells at the day of transplantation. (B) Chimerism analysis of peripheral blood by staining donor-derived CD45.1 (2, 4, 6, and 9.5 months after transplantation). (C) Percentage of donor-derived (CD45.1+) eGFP-expressing cells in peripheral blood leukocytes over time. (D-E) Chimerism (D) and gene marking rate (E) in donor-derived splenocytes 9.5 months after transplantation. (F-G) Chimerism (F) and gene marking rate (G) in donor-derived bone marrow cells 9.5 months after transplantation.
Chimerism and gene marking of donor-derived CD45.1+ peripheral blood leukocytes, splenocytes, and bone marrow cells. (A) eGFP-marking rates in STIF-cultivated Lin− cells of pretransplantation samples. Because of limited cell numbers, data of G9-14 and G48-14 represent pooled samples 4-5 days after transduction. Individual data points in G9-168 and G48-168 represent eGFP marking in individually transduced and transplanted batches of cells at the day of transplantation. (B) Chimerism analysis of peripheral blood by staining donor-derived CD45.1 (2, 4, 6, and 9.5 months after transplantation). (C) Percentage of donor-derived (CD45.1+) eGFP-expressing cells in peripheral blood leukocytes over time. (D-E) Chimerism (D) and gene marking rate (E) in donor-derived splenocytes 9.5 months after transplantation. (F-G) Chimerism (F) and gene marking rate (G) in donor-derived bone marrow cells 9.5 months after transplantation.
Lentiviral gene transfer into STIF-cultivated HSCs facilitates polyclonal reconstitution
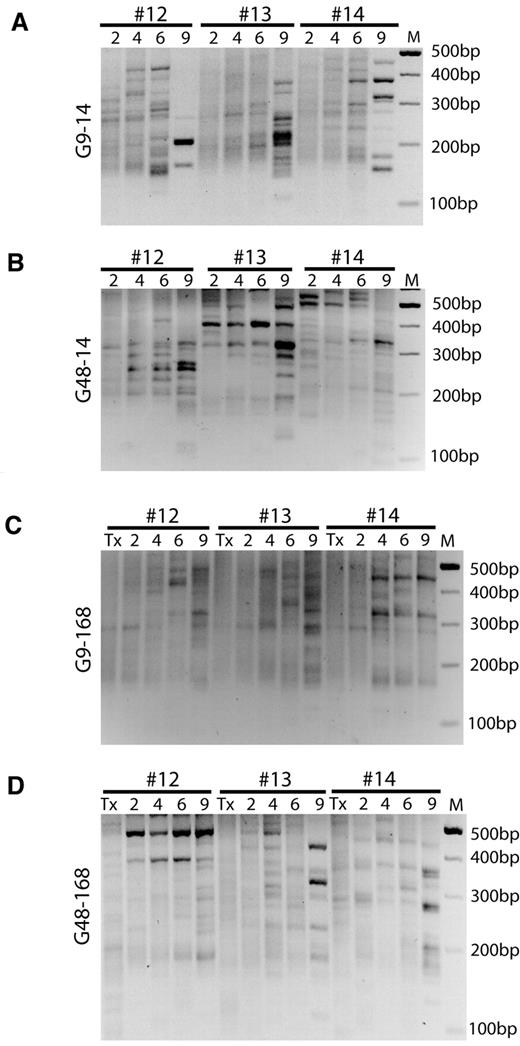
Using longitudinal LM-PCR analysis, we assessed clonal diversity and searched for progressive clonal development that would manifest in long-term persistence and a gradual reduction of diversity. Gel analyses of LM-PCRs performed on peripheral blood samples revealed a polyclonal pattern that was most obvious in group G9-168 (Figure 5 and supplemental Figure 5). However, dominant bands, as typically observed under conditions of clonal dominance (Figure 1I),35,36 could be identified in several samples, and especially at the late time points of groups G9-14, G48-14, and G48-168. Based on the automated annotation of sequence data, the highest complexity of lentiviral insertion sites was noted at month 2, with the recovery of up to 195 in a single peripheral blood sample. Underlining the increased sensitivity of the pyrosequencing approach,35,36 we mapped > 7000 lentiviral insertion sites in this study, among which 4793 were in the peripheral blood of transplanted mice (supplemental Table 2).
Longitudinal surveillance of clonal dynamics by LM-PCR. (A-D) LM-PCR on peripheral blood genomic DNA of 3 representative mice (#12, #13, and #14) from groups G9-14(A), G48-14(B), G9-168(C), and G48-168(D). Exponential PCR was first digested with SacI to remove internal control and then was used for nested PCR with bar-coded primers. In cases for which digest was not complete, a faint but persisting band of 280 bp was generated. M, marker; Tx, pretransplantation sample; numbers indicate the time after transplantation in months. Samples of the remaining mice are shown in supplemental Figure 5.
Longitudinal surveillance of clonal dynamics by LM-PCR. (A-D) LM-PCR on peripheral blood genomic DNA of 3 representative mice (#12, #13, and #14) from groups G9-14(A), G48-14(B), G9-168(C), and G48-168(D). Exponential PCR was first digested with SacI to remove internal control and then was used for nested PCR with bar-coded primers. In cases for which digest was not complete, a faint but persisting band of 280 bp was generated. M, marker; Tx, pretransplantation sample; numbers indicate the time after transplantation in months. Samples of the remaining mice are shown in supplemental Figure 5.
To understand the dynamics of repopulation, we identified sets of recurrent lentiviral insertion sites detectable at different time points (supplemental Figure 6). A high number occurred only once, and only 4% to 9% were shared by 3 to 4 different time points (framed area in supplemental Figure 6), which is indicative of fluctuating polyclonal hematopoiesis. Further supporting polyclonal fluctuation, novel lentiviral insertion sites were constantly found at a rather high rate, even at late time points (supplemental Figure 6). The data were quantified in supplemental Table 3, revealing that at months 6 and 9.5, new lentiviral insertion sites comprised 32% to 59% of the annotated sites. The rate of novel appearances was high irrespective of the size of the dataset at any given time point, which together with the power of the deep-sequencing approach (> 190 lentiviral insertion sites detected in a single sample; supplemental Table 2) argues against sampling issues introducing a major bias in our analysis of the clonal dynamics. Interestingly, the fraction of clones detectable at early and late time points (months 2 and 9.5), but not in the intermediate analyses (months 4 and 6), was highest for the groups receiving expanded cells (supplemental Table 4). This suggested that clonal fluctuation occurring in the context of polyclonal hematopoiesis was supported by posttransduction expansion in STIF.
Short prestimulation enhances selection for hits in oncogenes
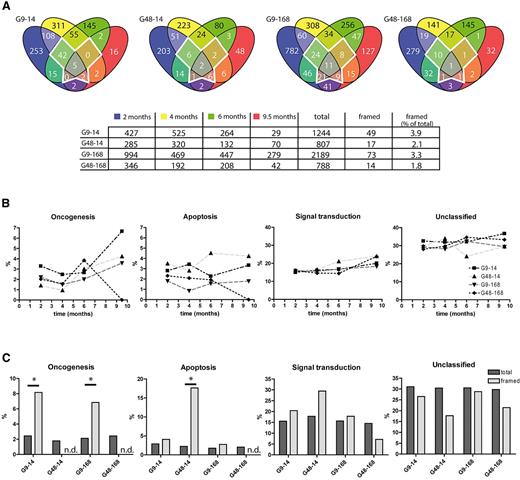
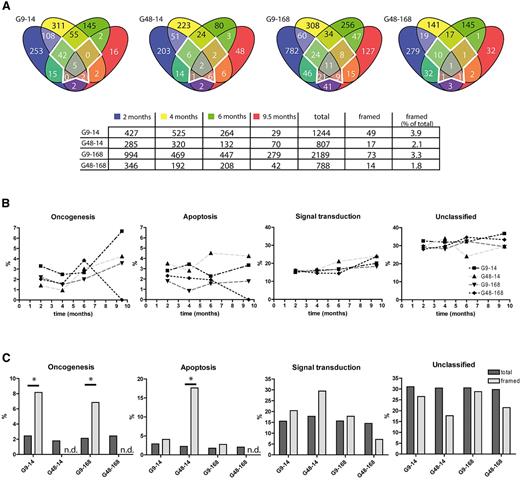
Although cells from all 4 groups seemed to promote polyclonal repopulation, it remained to be tested whether and to what extent differences in prestimulation (9 vs. 48 hours) or cell expansion (14 vs 168 hours) influenced clonal selection. To address this issue, we analyzed the distribution of gene functions associated with integration sites. Because only a subset of the mouse genome is annotated in PantherDB, we removed sequences without entry in this database from our collection, which reduced the fraction of persisting lentiviral insertion sites to 2% to 4% (framed area in Figure 6A).
Integration site analysis by 454 high-throughput sequencing. Results of high-throughput sequencing of integration sites in samples taken 2, 4, 6, and 9.5 months after transplantation are shown. (A) Integration sites from posttransplantation samples were assigned to their closest gene function as annotated in PantherDB and checked for repetitive detection. The framed area in the middle of each diagram represents a highly persisting fraction of integration sites that was detected in 3 to 4 different time points. (B) Integration sites from panel A were analyzed according to their biologic function (“apoptosis,” “oncogenesis,” “signal transduction,” and “unclassified”), and their distribution plotted over time. (C) Comparison of the group-specific distribution of gene functions (“apoptosis,” “oncogenesis,” “signal transduction,” and “unclassified”) in the framed area and in the whole dataset from panel A. * P < .05 by Fisher exact test. n.d. indicates not detected.
Integration site analysis by 454 high-throughput sequencing. Results of high-throughput sequencing of integration sites in samples taken 2, 4, 6, and 9.5 months after transplantation are shown. (A) Integration sites from posttransplantation samples were assigned to their closest gene function as annotated in PantherDB and checked for repetitive detection. The framed area in the middle of each diagram represents a highly persisting fraction of integration sites that was detected in 3 to 4 different time points. (B) Integration sites from panel A were analyzed according to their biologic function (“apoptosis,” “oncogenesis,” “signal transduction,” and “unclassified”), and their distribution plotted over time. (C) Comparison of the group-specific distribution of gene functions (“apoptosis,” “oncogenesis,” “signal transduction,” and “unclassified”) in the framed area and in the whole dataset from panel A. * P < .05 by Fisher exact test. n.d. indicates not detected.
All 4 groups showed a similar frequency in the classifications “apoptosis,” “signal transduction,” and “unclassified” over time (Figure 6B). Lentiviral insertion sites associated with “oncogenesis” were found most frequently in G9-14, with an increase over time (from 3.3% to 6.7%). A similar trend was observed for G48-14 and G9-168, with peak values of ∼ 4% at 9.5 months after transplantation.
We also investigated whether the highly persisting fraction of integration sites (framed in Figure 6A; details in supplemental Table 5) showed an overrepresentation of putative growth-promoting insertions (Figure 6C). All 4 groups contained ∼ 2% of hits associated with “oncogenesis,” 2% “apoptosis,” 15% “signal transduction,” and 30% “unclassified.” In contrast, G9-14 and G9-168 showed 8% and 7% of “oncogenic” hits in their persisting clones, respectively, which is significantly higher (Fisher exact test, P = .038 and P = .022 for G9-14 and G9-168, respectively) than in the total dataset, and was not observed in G48-14 and G48-168. Short prestimulation thus posed an increased risk to enrich for potentially oncogenic clones in a polyclonal population, whereas, consistent with the above observations made in the immortalization assay, posttransduction expansion in STIF did not select transformed clones.
Culture-induced formation of lentiviral common insertion sites
Recurrent genomic loci, named common insertion sites, have been found in independent retrovirally induced tumors. One such locus is Evi1, which is associated with leukemogenesis in humans and mice (Figure 1), and also with lentiviral vector–mediated immortalization in vitro.18 In our large dataset, we observed 6 clones with insertions in Evi1, 2 of which were located downstream of the TSS and only detected in preinfusion samples; the other 4 were found 60-115 kb upstream of the TSS. Only one of these clones (from G48-168) was recurrently detected (at months 2 and 9.5; supplemental Table 6), suggesting that posttransduction expansion had no major effect on the selection of clones with Evi1 insertions.
Surprisingly, when we compared the distribution of lentiviral common insertion sites between the different groups, there was only limited overlap, and the only 2 common insertion sites that were common to all groups (Eif4enif, eukaryotic translation initiation factor 4E nuclear import factor 1; Sfi1, Sfi1 homolog spindle assembly associated) are not known to be involved in growth promotion (supplemental Figure 7A). These genes are located next to each other on chromosome 11, and together harbored 38 independent insertions (supplemental Figure 7B). A few more common insertion sites were retrieved in multiple experimental groups. Although one of these encoded a growth factor (Hgf), these loci may also represent “hot spots” that occur independently of culture duration (supplemental Figure 7A).
Approximately 14% of common insertion sites in G9-14, G48-14, and G14-168 have functions in “cell cycle” regulation and “oncogenesis.“ These common insertion sites were not overrepresented in the persisting clones, again indicating that most of them reflect integration preferences rather than selection.
Posttransduction expansion increases clonal complexity of long-term hematopoiesis
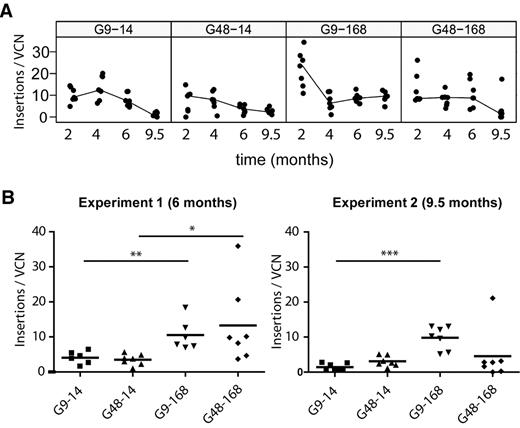
As indicated in Figure 6, de novo appearances of cell clones were a relatively frequent event, even at late time points of reconstitution (supplemental Table 3A). Following the traditional approach to examine clonal complexity, we performed Southern blots of genomic DNA of bone marrow cells harvested at 9.5 months (supplemental Figure 8). The identification of distinct vector bands in the Southern blot typically requires a clonal contribution exceeding 10% of the population, similar to the sensitivity of the detection of dominant bands in our LM-PCR conditions.35 Southern band counts were positively correlated with the number of lentiviral insertion sites mapped by LM-PCR from peripheral blood cells (data not shown), but lentiviral insertion sites mapped by LM-PCR typically exceeded the number of distinct bands detectable by Southern blot. The Southern blot data indicated oligoclonal dominance in the majority of mice receiving cells from short posttransduction protocols (G9-14 and G48-14), whereas an increased diversity was observed in the G9-168 group (supplemental Figure 8). This increased clonal inventory in mice receiving expanded cells was confirmed by plotting the time course of lentiviral insertion sites detected by pyrosequencing after correction for vector copy number (Figure 7; P < .001 at 9.5 months for G9-168 vs. G9-14, a 7-fold increase). Using the same correction for average vector copy number, posttransduction expansion also increased clonal complexity at late time points of the first experiment, which had generally lower marking rates than the second one (P < .01 for G9-14 vs G9-168; data from Figure 7B and supplemental Table 2). Because LM-PCR performed with a single restriction enzyme systematically underestimates the number of insertions,42 clonal diversity should be even higher than is indicated by our dataset. Our study reveals that posttransduction of lentivirally transduced hematopoietic cells in STIF medium supports polyclonal fluctuation with increased clonal complexity in long-term hematopoiesis.
Correlation of lentiviral insertion sites and vector copy number. (A) For each animal of the second experiment, the relation of unique insertions per time point versus vector copy number in peripheral blood samples was determined. (B) For all animals of the first and second experiment, the relation of unique insertions per time point versus vector copy number in end-point peripheral blood samples was determined. Statistical testing was done with the Mann-Whitney 2-sided test. *P < .05; **P < .01; ***P < .001.
Correlation of lentiviral insertion sites and vector copy number. (A) For each animal of the second experiment, the relation of unique insertions per time point versus vector copy number in peripheral blood samples was determined. (B) For all animals of the first and second experiment, the relation of unique insertions per time point versus vector copy number in end-point peripheral blood samples was determined. Statistical testing was done with the Mann-Whitney 2-sided test. *P < .05; **P < .01; ***P < .001.
Discussion
In the present study, we investigated the impact of improved cell-culture conditions on the establishment of insertional mutants and in vivo clonal competition of lentiviral vector–transduced murine HSCs. First we demonstrated that cells transduced with an LTR-driven gammaretroviral vector and subsequently with an expanded STIF cocktail induced clonal B-lymphoblastic leukemia. In this case, a collaborative effect of integrations in the Igf1r, Hoxa9, and Evi1 loci likely initiated leukemogenesis. HoxA9 expression up-regulated Igf1r in a B-lineage acute lymphoblastic leukemia model.43 Moreover, IGF-receptor signaling itself is important for HSC expansion, overexpression is associated with poor prognosis in multiple myeloma, and its ligand IGF-2 was present in the STIF medium.20,43-45 Whereas we clearly demonstrated a potent amplification of gammaretroviral insertional mutants during prolonged ex vivo cultivation, our subsequent experiments using the in vitro immortalization assay provided no evidence that the HSC-supportive STIF conditions lead to preferential survival of insertional mutants in vitro.
These results prompted us to address a potential impact of prolonged pretransduction stimulation and posttransduction expansion in STIF conditions on the frequency of insertional mutants. Using our established in vitro immortalization assay, in which cells are cultured in myeloid-differentiation inducing cytokines (mSCF, hFl3L, hIL11, and mIL3), insertions into Evi1 reproducibly trigger rapid clonal outgrowth.18 Interestingly, when we cultured cells in STIF conditions, which we here demonstrate to maintain a primitive HSC-like phenotype in contrast to the above “myeloid” cocktail (Figure 2), no preferential outgrowth of insertional mutants could be detected. To investigate the impact of STIF-mediated expansion on the potential selection of insertional mutants obtained after lentiviral vector transduction, we switched to a sensitive in vivo readout with long-term observation of transplanted cells. The lentiviral vector chosen for these studies has a documented potential to transform hematopoietic cells by insertional mutagenesis.18 We also adjusted transduction conditions to achieve an average marking rate exceeding one copy per cell to allow for combinatorial collaborative insertional events, as in the case of the gammaretroviral vector–induced leukemia described in Figure 1.
Transplantation of 56 mice did not result in vector-related mortality, and longitudinal LM-PCR revealed a highly polyclonal pattern, especially at early time points of repopulation, which was best preserved in mice receiving cells that were expanded for 1 week after transduction after a short period of prestimulation. This indicated that gene-marked long-term repopulating cells were preserved and even expanded during in vitro culture. Sequencing of LM-PCR products identified more than 7000 unique integration sites (∼ 5000 obtained after transplantation), but did not deliver evidence for a major role of fitness-enhancing insertional mutagenesis. Although integration-site analysis was not limited to short-lived granulocytes, a good indicator of clonal succession,4,46 only 4%–9% of unique integrations were frequently recovered over time (persisting integrations; supplemental Figure 6). This is supportive of a highly dynamic hematopoietic “clonal succession” model with recurrent activation of only a subset of stem cell clones,47 most likely with infrequent cycling rates.1 Conceivably, polyclonal fluctuation is only possible under conditions of a rich stem cell repertoire, and can hardly be observed when using suboptimal cytokines for ex vivo culture, as in previous studies by us and others.23,24,35,36,46 Many previous studies used less advanced cytokine cocktails for ex vivo culture, and oligoclonal dominance of gammaretroviral or lentiviral vector–transduced HSCs occurred even in the absence of insertional lesions.23,24 Interestingly, although Southern blot analysis of DNA harvested from bone marrow cells indicated oligoclonal dominance, the more sensitive integrome analyses still revealed polyclonal fluctuation, with detection of previously hidden clones even at late time points. The use of optimized cytokine cocktails for in vitro amplification of HSCs may thus help to maintain homeostatic mechanisms by supporting polyclonal engraftment and delaying clonal restriction. It remains to be investigated whether even better expansion conditions further increase polyclonality, and whether this pattern will be maintained under conditions of stress hematopoiesis, as caused by increased cell loss, inflammatory conditions, or experimentally by serial transplantation.
Despite little differences in the integromes of all 4 groups, the 2 groups with short prestimulation yielded the highest number of integration sites, and the combination of short prestimulation with long expansion (G9-168) seemed best suited to ensuring the most consistent engraftment and maintenance of gene-modified cells. However, these groups showed an overrepresentation of “oncogenic” insertions in their persisting cell clones. Given the known bias of lentiviral insertions into transcriptionally active genes, our data suggest that the early response to ex vivo culture involves the transcriptional induction of proto-oncogenes, whereas compensatory signaling may reduce the probability of proto-oncogene insertions in cells that are adapted to ex vivo culture.
Remarkably, 5% of all lentiviral integrations clustered in common insertion sites (supplemental Figure 7), which is comparable to the detection of lentiviral “hot spots” in human CD34+ cells.48 Nevertheless, only 4% of our common insertion sites were shared between 2 or more groups, and most were unique for independent groups, again supporting the concept that culture conditions might have influenced the transcriptome and thus target site selection of the lentiviral integrase. Although serial analyses did not show a strong trend for proto-oncogene enrichment, the reduced risk of lentiviral vectors for enhancer-mediated up-regulation of adjacent genes compared with gammaretroviral LTR vectors17,18 does not guarantee event-free gene therapy because it cannot prevent uncontrolled splicing or termination events that may also trigger a selective advantage.
Having established the importance of culture conditions and vector backbones for insertional mutagenesis, it is tempting to conclude that the aggressive lymphoblastic leukemia we observed after gammaretroviral transduction was promoted by ex vivo expansion in STIF medium. In this experiment, cells were initially cultured for 3 days in a cytokine cocktail that does not expand HSCs, but rather triggers myeloid differentiation. The subsequent expansion in STIF cytokines may have promoted engraftment, which was further facilitated by the initial loss of intact competitors. In contrast, when STIF cytokines that had been supplemented with heparin early after lentiviral transduction were used during the whole ex vivo culture, selection for persisting clonal dominance associated with proto-oncogene insertions was not observed. This argues for the presence of a homeostatic mechanism that suppresses the outgrowth of fitness-enhanced mutants, most likely by occupation of limiting niche factors.49,50
In a study performed in nonhuman primates, prolonged in vitro cultivation of gammaretroviral vector–transduced CD34+ cells induced a strong reduction in gene marking and long-term clonal dominance of Evi1 mutants.26 The lack of predominant selection of insertional mutants in our study, which was observed using an in vitro immortalization assay and in vivo, was not because of the absence of mutants (supplemental Tables 5 and 6), but more likely reflected a joint effect of an improved HSC-supportive cytokine cocktail present in the entire cultivation phase and a SIN lentiviral vector with a reduced potential to establish aggressive mutants. Indeed, when we “contaminated” primary cells after expansion in STIF or differentiating cytokine conditions with overtly leukemic cells, as described in Figure 1, both conditions could not suppress the establishment of leukemia in secondary recipients (supplemental Figure 9).
A synopsis of our data is not compatible with a deterministic model that would predict a linear increase of dominant insertional mutants with the number of gene-modified HSCs. It rather supports the conclusion that culture in HSC-expanding cytokine conditions can prevent or at least delay the outgrowth of insertional mutants through their competitive suppression by an excessive number of intact HSCs. Even extended ex vivo culture established polyclonal fluctuating hematopoiesis with limited interindividual variation, which will not only support rapid and sustained engraftment, but may also allow reviving strategies for pretransplantation selection and detailed quality control of gene-modified HSCs.
The online version of this article contains a data supplement.
The publication costs of this article were defrayed in part by page charge payment. Therefore, and solely to indicate this fact, this article is hereby marked “advertisement” in accordance with 18 USC section 1734.
Acknowledgments
We thank the SFB900 (Sebastian Suerbaum, Department of Microbiology, Hannover Medical School) for support with pyrosequencing; Thomas Neumann, Ivonne Fernandez, Maimona Id, and Girmay Asgedom for technical assistance; the Department of Radiotherapy for irradiation of mice; and Cindy Elfers, Rena Struss, Maike Stahlhut, and Martin Hapke for help with animal work.
This study was supported by grants from the Deutsche Forschungsgemeinschaft (DFG, SPP1230, SFB738 and Excellence Cluster REBIRTH), the German Ministry for Research and Education (CB-Hermes and PIDMET), the DAAD (German-Chinese junior research groups), the European Union (CliniGene, LSHB-CT-2006-018933, Persist), and the German National Merit foundation (stipend to T.M.).
Authorship
Contribution: T.M. performed research, collected, analyzed, and interpreted data, and wrote the manuscript; M.H.B. performed research, analyzed and interpreted data, and wrote the manuscript; S.B. and Z.L. analyzed data; N.H., O.S.K., and U.M. performed research and collected and analyzed data; M.G. performed research; B.S. designed and performed research; A.S. designed and performed research, collected, analyzed, and interpreted data, and wrote the manuscript; and C.B. designed research, interpreted data, and wrote the manuscript.
Conflict-of-interest disclosure: The authors declare no competing financial interests.
Correspondence: Christopher Baum, MD, and Axel Schambach, MD/PhD, Department of Experimental Hematology, Hannover Medical School, 30625 Hannover, Germany; e-mail: baum.christopher@mh-hannover.de or schambach.axel@mhhannover.de.
References
Author notes
T.M. and M.H.B. contributed equally to this study.

