Abstract
T-cell acute lymphoblastic leukemia (T-ALL) is a hematologic neoplasm characterized by malignant expansion of immature T cells. Activated NOTCH (NotchIC) and c-MYC expression are increased in a large percentage of human T-ALL tumors. Furthermore, c-MYC has been shown to be a NOTCH target gene. Although activating mutations of Notch have been found in human T-ALL tumors, there is little evidence that the c-MYC locus is altered in this neoplasm. It was previously demonstrated that Notch and c-Myc–regulated genes have a broadly overlapping profile, including genes involved in cell cycle progression and metabolism. Given that Notch and c-Myc appear to function similarly in T-ALL, we sought to determine whether these two oncogenes could substitute for each other in T-ALL tumors. Here we report that NOTCHIC is able to maintain T-ALL tumors formed in the presence of exogenous NOTCHIC and c-MYC when exogenous c-MYC expression is extinguished. In contrast, c-MYC is incapable of maintaining these tumors in the absence of NOTCHIC. We propose that failure of c-MYC to maintain these tumors is the result of p53-mediated apoptosis. These results demonstrate that T-ALL maintenance is dependent on NOTCHIC, but not c-MYC, demonstrating that NOTCH is oncogenic dominant in T-ALL tumors.
Introduction
Acute lymphoblastic leukemia (ALL) is a neoplasm characterized by malignant expansion of immature lymphoblasts committed to the T-cell lineage (T-ALL) or the B-cell lineage (B-ALL). T-ALL accounts for approximately 10% to 15% of adult and 25% of childhood ALL cases.1-3 Mortality rates of T-ALL patients have significantly decreased over the last 20 years because of advances in the treatment of this aggressive subset of ALL.4 T-ALL and B-ALL patients have approximately the same 5-year overall survival rates: 35% to 40% in adults and 75% to 85% for children and adolescents.1 However, T-ALL is a more aggressive disease with a poorer clinical outcome than B-ALL. T-ALL patients have a higher percentage of induction failure, rate of relapse, and invasion into the central nervous system compared with B-ALL patients.5 In addition, a subset of T-ALL patients (20%-25%) is refractory to initial treatment or relapse after a short remission period because of drug resistance.
Several oncogenes and tumor suppressors have been implicated in T-ALL etiology. Expression of the proto-oncogenes c-MYC, NOTCH, LMO1/2, LYL1, TAL1/2, HOX11, and HOX11L2 in murine hematopoietic progenitors leads to development of a heterogeneous population of T-ALL subtypes. Loss of the tumor suppressors p53 or Ikaros also results in the development of lymphoma in knockout mouse models.6-8 Human tumors are characterized into subtypes based on the expression of LMO1/2, LYL1, TAL1/2, HOX11, and HOX11L2. Interestingly, activating NOTCH1 mutations have been found in all subtypes of T-ALL.9 We have suggested that Notch activation is a dominant event necessary for leukemogenesis, even in the presence of other T-ALL-associated genes.10 It is clear that activated NOTCH (NOTCHIC) is capable of inducing cellular transformation and plays a central role in T-ALL progression.9,11-16 Numerous Notch target genes have been identified, including the Hes and Hey family of transcriptional repressors, cyclin D1, and c-Myc.9,17-21 Both Notch and c-Myc regulate cell-cycle progression by inducing expression of cyclins and reducing p27 expression.17,18,20,22-25 However, unlike most oncogenes, including c-MYC, NOTCH is capable of inhibiting p53-mediated apoptosis.13 Specifically, it was demonstrated that the p53 pathway is intact in a NOTCHIC-induced T-ALL tumor model; when NOTCHIC expression is extinguished, the p53 pathway is activated leading to tumor regression.13 A recent publication demonstrates that NOTCH and c-MTC–induced gene expression profiles are broadly overlapping in leukemia cells, as determined by microarray analysis, including multiple genes regulating cell cycle progression, protein biosynthesis, and metabolism.26 These data suggest that the c-MYC and NOTCH oncogenes may be able to compensate for each other in maintaining tumors because they appear to have similar functions and indicate that c-MYC may be the major downstream mediator of NOTCH function.
We sought to address the issue of oncogenic compensation using inducible mouse model systems and forming tumors by expressing T-ALL–inducing levels of both NOTCHIC and c-MYC, and then extinguishing the expression of only one oncogene at a time to determine whether c-MYC or NOTCHIC, alone, could maintain the tumor. Our results demonstrate that NOTCHIC, but not c-MYC, can maintain a T-ALL tumor and that regression is associated with loss of NOTCHIC activity.
Methods
Bone marrow reconstitutions
All animal procedures were approved by the Wistar Institute Animal Care and Use Committee. To generate tumors, Top-NOTCH or Tet-o-MYC mice were injected intraperitoneally with 300 μL of 100 μg/mL 5-fluorouracil. Five days after 5-fluorouracil injection, bone marrow was collected. Mice were euthanized by CO2 asphyxiation, and the long bones of the leg (femur and tibia) were removed from the animal. Bone marrow was then flushed out into a tissue culture dish using phosphate buffered saline (PBS). Bone marrow cells were pelleted at 311g, and then red blood cells were lysed using a hemolysis buffer (154mM NH4Cl, 10mM KHCO3, 0.1mM ethylenediaminetetraacetic acid). Cells were pelleted and resuspended in RPMI (10% fetal bovine serum, penicillin/streptomycin) with 100 ng/mL of stem cell factor, interleukin-6, and interleukin-3 at a concentration of 2.0 × 10⁶ cells/mL and cultured overnight at 37°C in a humidified atmosphere with 5% CO2. The next day, bone marrow cells were pelleted at 311g, resuspended in PBS, and counted. Cells were resuspended at a concentration of 2 × 10⁶ cells/mL, and 1 × 10⁶ cells (500 μL) were then infected in culture using 1 mL of viral supernatant containing packaged retroviral vectors (MIT-green fluorescent protein [GFP], MIT-c-MYC, or MIT-NOTCHIC) at 1950g for 2 hours at room temperature. Lethally irradiated recipient mice (2 doses of 550 rads from a sealed Cs-source irradiator with a 4-hour relaxation period in between) were then reconstituted with 1.0 × 10⁶ bone marrow derived cells by tail vein injection. Mice were then monitored for onset of disease.
Mouse tumor regressions
Tumor cells were transplanted into syngeneic mice to maintain live tumor tissue and to obtain multiple mice with the same primary tumor tissue for time point regression studies. Single-cell suspensions were generated from spleen or lymph nodes from the primary tumor source. Tissue was added to a culture dish containing sterile PBS. Single-cell suspensions were generated under sterile conditions. Tissue was crushed to release cells, and PBS-containing cells were then filtered through a .45-μm cell strainer to remove contaminating tissue and pelleted at 311g. Red blood cells were lysed using hemolysis buffer, pelleted, washed with PBS, and resuspended in PBS. Single cells (1 × 10⁶) were injected into recipient host animals via intravenous (tail vein) injection. Mice were monitored for signs of disease. When mice were moribund (ie, enlarged spleen as evidenced by palpation, visibly enlarged lymph nodes, as shown in Figure 1D; difficulty breathing; and slow movement and response to stimulation), doxycycline (Dox; 100 mg/mL) was administered into the drinking water.
Plasmids
The MIT vector was derived from the MIG-RX vector, which is a modification of the MIGR1 vector obtained from Dr Warren Pear, University of Pennsylvania,27 as previously reported.28 MIT-c-MYC and MIT-NOTCHIC vectors were generated by cloning c-MYC or NOTCHIC, respectively, into the EcoR1 and Xho1 sites of MIT.
Retroviral generation
Retroviral vectors are packaged into recombinant virions by transfection of vector DNA and helper virus DNA (SV40ψ-E) into HEK-293T cells with Lipofectamine-2000 (Invitrogen) according to the manufacturer's instructions. Media was changed 4 and 24 hours after transfection. Tissue culture supernatants were collected 48 hours after transfection and filtered using a .45-μm filter to remove cell debris. Filtered viral containing supernatant was used to infect isolated bone marrow cells.
Antibodies
Notch-specific antibody (α-Nic-927) was previously characterized29 ; antitubulin (B-5-1-2; Sigma-Aldrich), p53, and c-Myc (N-262; Santa Cruz Biotechnology) antibodies were used to perform Western blot analysis. C-Myc antibody (9E10; Santa Cruz Biotechnology) was used for immunoprecipitation.
Primers
Reverse-transcribed polymerase chain reaction (RT-PCR) primers were as follows: human-NOTCH: forward, GGCAGCCTCAAGCCCGGCGTG; reverse, GCTGGCAGCAAGGCTACTGTGC; human-c-MYC: forward, GCGCGAATTCACCATGCCCCT; reverse, GCGCCTCGAGTTACGCACAAG; mus-c-Myc: forward, AGATCCCCTGAATTGGAAAACAA; reverse, AGGTTGTGAGGTTAGGCTTTGA; mus-Hes1: forward, ATGCCAGCTGATATAATGGAG; reverse, GGCGTTGATCTGGGTCATGCAG; mus-HeyL: forward, GCGCGGATCCACCATGAAGCGGCCCA; reverse, GCGCCTCGAGGAAAGCCCCAATTTCA; and mus-β-actin: forward, CGATATCGCTGCGCTCGTCGTCGAC; reverse, GGCCAGGATAGAGCCACCAATCCAC. TaqMan Gene Expression Array primers were obtained from Applied Biosystems and used for real-time RT-PCR analysis, human NOTCH1 (Hs01062014), human c-MYC (Hs00905030), mouse c-Myc (Mm00487803), and mus-GAPDH (Mm99999915).
Statistics
Wilcoxon rank-sum test was used to compare the average tumor formation times of the 2 groups. Student t test was used to determine statistical significance for spleen sizes and immature T cells in the spleen. P less than .05 was considered statistically significant.
Results
C-MYC expression cannot rescue a T-ALL tumor when NOTCH expression is extinguished
Previous reports demonstrated that c-MYC is a direct target of NOTCH in T-ALL cell lines and in a mouse model of breast cancer.9,17,20 Both activated NOTCH and c-MYC are oncogenes capable of inducing T-ALL when expressed in murine hematopoietic stem cells, although expression of c-Myc also leads to the development of B-cell lymphoma.13,16,30-32 However, an important question remains: are NOTCH and c-MYC codependent in T-ALL?
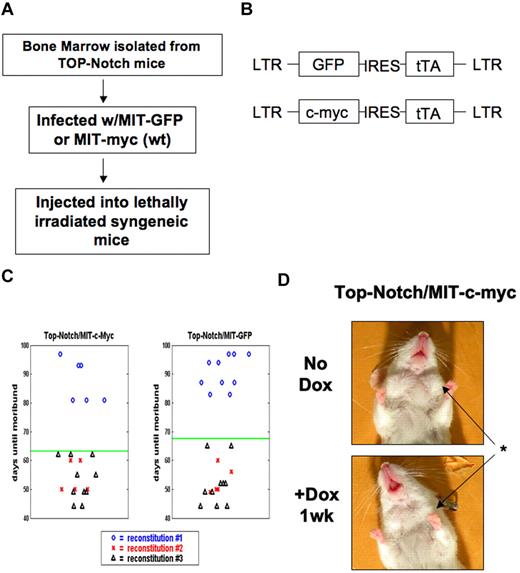
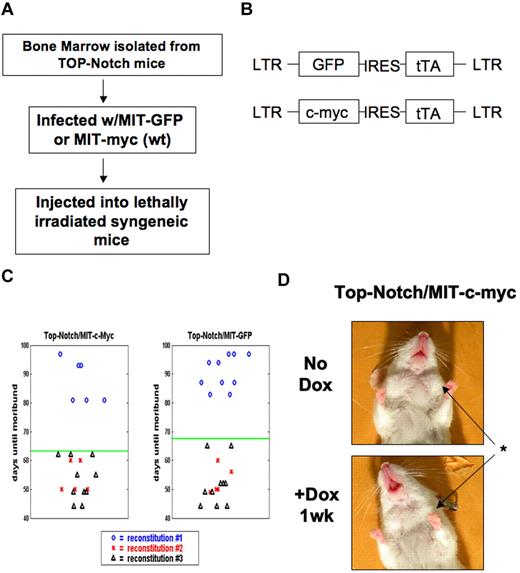
To investigate the role that Notch and c-Myc play in T-ALL in vivo, we developed a strategy based on the Tet-operator transgenic mouse model. To generate mice in which one gene could be modulated and one gene could remain expressed, we combined the Tet-model with a retroviral vector system. We generated a retroviral vector that drives the expression of the Tet-Transactivator and a gene of interest via the long terminal repeat (LTR) and an internal ribosome entry site element (IRES) (Figure 1B; see Figure 5B). Tumors were then generated by retroviral transduction of bone marrow cells derived from the transgenic mouse lines (Top-Notch or Tet-o-MYC) and reconstitution into recipient mice. Mice develop tumors in which expression from the Tet-operator controlled locus is extinguished on treatment with Dox administered in the drinking water, whereas expression from the LTR is remains constitutive (Figure 1A; see Figure 5A).
Coexpression of ectopic c-MYC does not cooperate in Top-NOTCH tumor formation or prevent tumor regression. (A) Schematic of the tumor formation protocol. (B) Diagram of retroviral constructs. (C) Death curve of mice reconstituted with Top-NOTCH bone marrow infected with MIT-c-MYC (left panel) and MIT-GFP (right panel). (D) Top-NOTCH/MIT-c-MYC mouse before and after treatment with Dox. *Reduction of lymph nodes.
Coexpression of ectopic c-MYC does not cooperate in Top-NOTCH tumor formation or prevent tumor regression. (A) Schematic of the tumor formation protocol. (B) Diagram of retroviral constructs. (C) Death curve of mice reconstituted with Top-NOTCH bone marrow infected with MIT-c-MYC (left panel) and MIT-GFP (right panel). (D) Top-NOTCH/MIT-c-MYC mouse before and after treatment with Dox. *Reduction of lymph nodes.
Both the Top-Notch and Tet-o-Myc models have been described previously.13,30 In both models, when the Eμ-SRα expression driver is used to induce transgene expression, mice develop a characteristic T-ALL-like disease.13,16,30 On administration of Dox in the drinking water, exogenous NOTCHIC or c-MYC expression is suppressed (in the respective model), resulting in tumor regression and a state of disease remission.13,30
To generate T-ALL tumors in which NOTCHIC expression could be modulated, bone marrow was isolated from Top-Notch donor mice and spin-infected with either MIT-GFP or MIT-c-MYC virus (Figure 1B). The MIT-GFP virus expresses the GFP and Tet-Transactivator, whereas the MIT-c-MYC vector expresses human c-MYC and Tet-Transactivator. Infected bone marrow-derived stem cells were injected into the tail vein of lethally irradiated syngeneic mice and observed for tumor formation (Figure 1A).
Expression of exogenous c-MYC had no effect on tumor latency in Top-NOTCH mice. Tumors expressing only NOTCHIC formed in an average of 67.48 days, whereas tumors formed in the presence of both NOTCHIC and c-MYC formed in an average of 63.19 days (Figure 1C), which was not statistically significant (P = .5068). To determine whether ecotopic c-MYC expression can rescue a c-MYC and NOTCH-induced T-ALL tumor after NOTCHIC expression is suppressed, Dox (100 μg/mL) was added to the drinking water of moribund mice. In all cases, ectopic c-MYC expression was not sufficient to maintain the tumor after NOTCH expression was extinguished (Figure 1D).
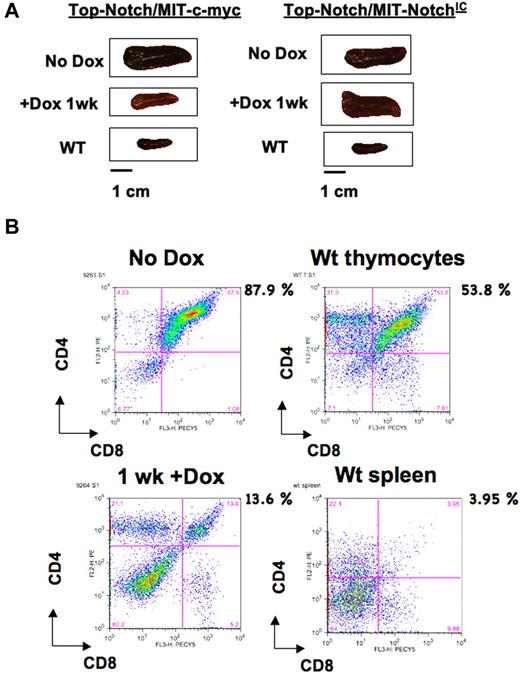
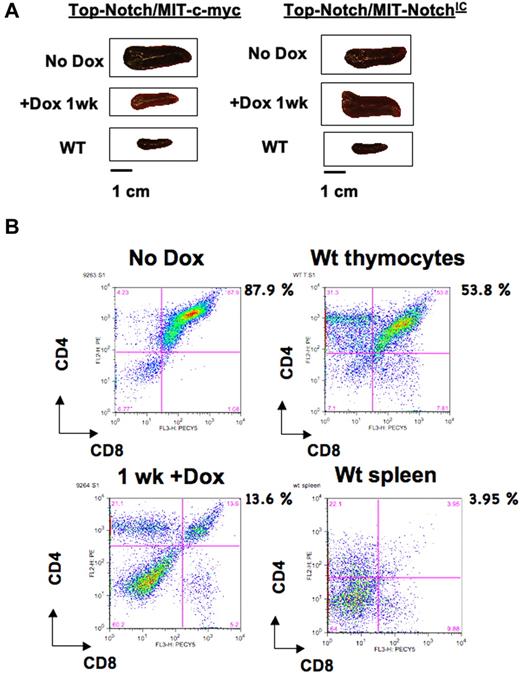
Gross dissection of untreated and Dox-treated Top-NOTCH/MIT-c-MYC moribund mice showed that spleens were greatly reduced in size by 1 week after Dox treatment (Figure 2A left panel). To verify that c-MYC expression levels from the MIT vector are sufficient to maintain the tumor and that regression does not occur as a consequence of experimental design, we reconstituted mice with Top-NOTCH bone marrow infected with MIT-NOTCHIC. Top-NOTCH/MIT-NOTCHIC tumors should not regress when Dox is added. Indeed, spleens remained enlarged in Top-NOTCH/MIT-NOTCHIC control mice after Dox treatment (Figure 2A right panel), validating our model system.
T-ALL tumors are not maintained by c-MYC in the absence of NOTCHIC. (A) Spleens from Top-NOTCH/MIT-c-MYC (left panel) and Top-NOTCH/MIT-NOTCHIC (right panel) tumors treated for the indicated times with Dox. (B) FACS analysis using anti-CD4-PE and anti-CD8-PerCP-Cy5.5 antibodies to detect double-positive tumor cells in the spleen before and after Dox treatment of mice reconstituted with Top-NOTCH/MIT-c-MYC bone marrow (upper and lower left panels, respectively), wild-type (WT) thymus, and wild-type spleen (upper and lower right panels, respectively).
T-ALL tumors are not maintained by c-MYC in the absence of NOTCHIC. (A) Spleens from Top-NOTCH/MIT-c-MYC (left panel) and Top-NOTCH/MIT-NOTCHIC (right panel) tumors treated for the indicated times with Dox. (B) FACS analysis using anti-CD4-PE and anti-CD8-PerCP-Cy5.5 antibodies to detect double-positive tumor cells in the spleen before and after Dox treatment of mice reconstituted with Top-NOTCH/MIT-c-MYC bone marrow (upper and lower left panels, respectively), wild-type (WT) thymus, and wild-type spleen (upper and lower right panels, respectively).
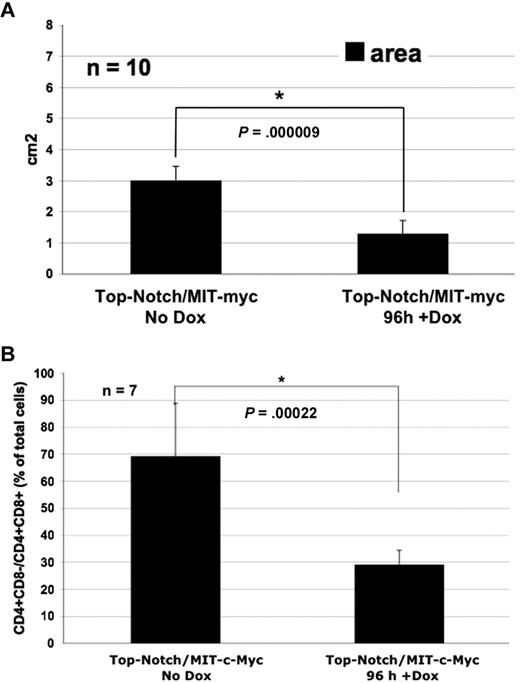
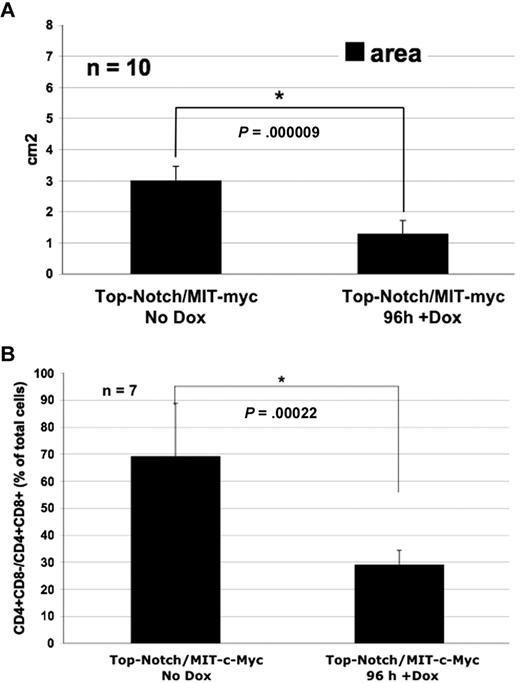
Mice that express NOTCHIC via the Eμ-SR expression driver develop CD4+CD8+ T-cell lymphomas,13 whereas mice that express c-MYC via the Eμ-SR or VavP expression driver develop both CD4+CD8− and CD4+CD8+ T-cell lymphomas.30,33,34 Therefore, the total percentage of all CD4+CD8− and CD4+CD8+ T cells (immature T cells) in the spleen was quantified. The overall percentage of immature T cells was reduced in Top-Notch/MIT-c-MYC mice 1 week after Dox treatment, as determined by costaining of single-cell suspensions from spleens with anti-CD4-phycoerythrin (PE) and anti-CD8-peridinin chlorophyll protein (PerCP)-Cy5.5 antibodies followed by fluorescence-activated cell sorter (FACS) analysis (7 of 7 tumors; Figure 2B left panels). As expected, there was no reduction in the number of immature T cells in the spleens of control Top-NOTCH/MIT-NOTCHIC mice treated with Dox (data not shown). FACS analysis for wild-type thymocytes and spleen is shown for comparison (Figure 2B right panels). Therefore, these data indicate that c-Myc expression alone is not capable of maintaining a T-ALL tumor formed by expression of NOTCHIC and c-MYC when NOTCHIC expression is extinguished. Spleen size was significantly reduced by 96 hours after Dox treatment of mice moribund with Top-NOTCH/MIT-c-MYC tumors (n = 10; Figure 3A). Furthermore, FACS analysis showed that the number of immature T cells in the spleen was significantly reduced after 96 hours of Dox treatment (n = 7; Figure 3B).
Spleen size of moribund mice reconstituted with Top-NOTCH/MIT-c-MYC bone marrow is significantly reduced after Dox treatment. (A) Area (length × width) of moribund mice reconstituted with Top-NOTCH/MIT-c-MYC bone marrow, untreated with Dox (No Dox) or treated for 96 hours with Dox. *P = .000009 (Student t test). n = 10. (B) Quantification of CD4+CD8− and CD4+CD8+ T cells in spleens of mice with Top-NOTCH/MIT-c-MYC tumors untreated or treated with Dox for 96 hours. *P = .00022 (Student t test). n = 7.
Spleen size of moribund mice reconstituted with Top-NOTCH/MIT-c-MYC bone marrow is significantly reduced after Dox treatment. (A) Area (length × width) of moribund mice reconstituted with Top-NOTCH/MIT-c-MYC bone marrow, untreated with Dox (No Dox) or treated for 96 hours with Dox. *P = .000009 (Student t test). n = 10. (B) Quantification of CD4+CD8− and CD4+CD8+ T cells in spleens of mice with Top-NOTCH/MIT-c-MYC tumors untreated or treated with Dox for 96 hours. *P = .00022 (Student t test). n = 7.
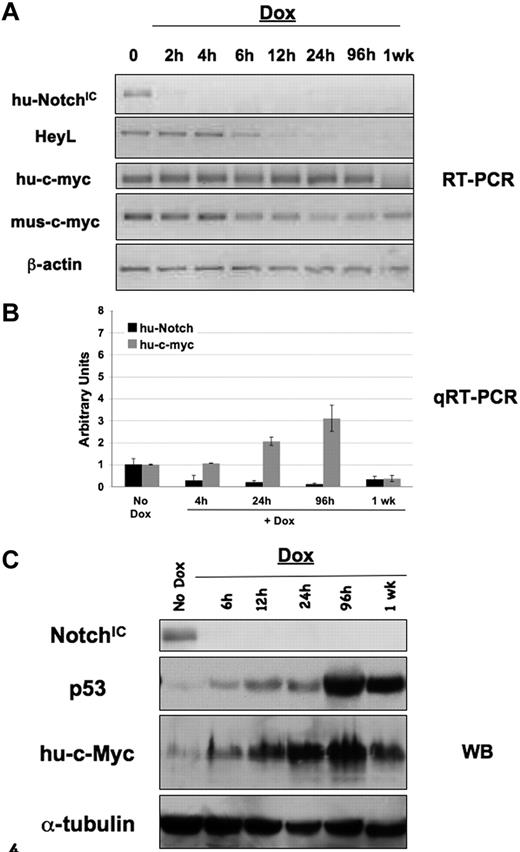
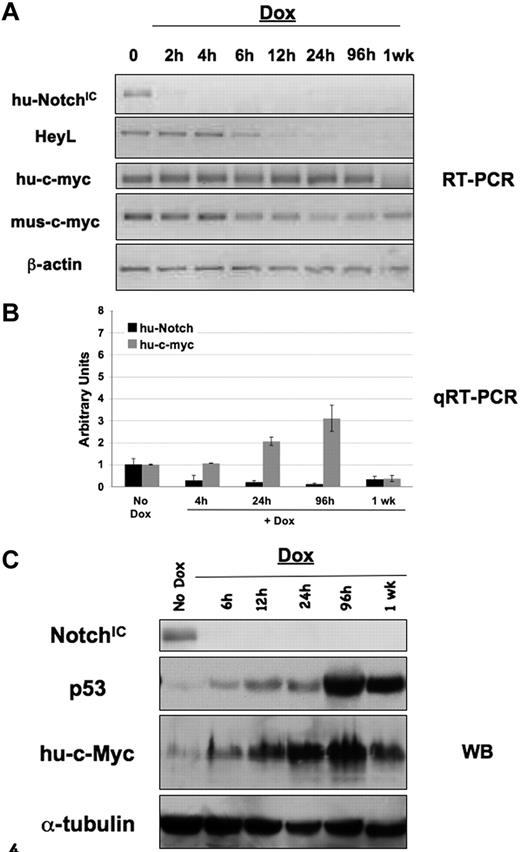
To validate loss of NOTCH and maintenance of ectopic hu-c-MYC expression after Dox treatment, RT-PCR analysis was performed (Figure 4A). Loss of exogenous NOTCHIC expression was confirmed after Dox treatment, whereas exogenous hu-c-MYC expression, which is not regulated by Dox treatment in this model, was maintained. A Notch target gene, HeyL, was shown to be reduced in Top-NOTCH/MIT-c-MYC mice after Dox treatment, demonstrating the loss of NOTCH-mediated transcription. Real-time RT-PCR analysis confirms the results for hu-c-MYC and hu-NOTCHIC expression (Figure 4B).
Expression of p53 is induced in T-ALL tumors when NOTCHIC expression is extinguished. Each primary tumor was transplanted into multiple syngeneic mice, and tumors were allowed to form. When mice were moribund, Dox was added and tissue collected at various time points for analysis. RT-PCR (A), quantitative RT-PCR (B), and Western blot (C) analyses were performed with the indicated specific primers or antibodies on single-cell suspensions from spleens of Top-NOTCHIC-/MIT-c-MYC tumors.
Expression of p53 is induced in T-ALL tumors when NOTCHIC expression is extinguished. Each primary tumor was transplanted into multiple syngeneic mice, and tumors were allowed to form. When mice were moribund, Dox was added and tissue collected at various time points for analysis. RT-PCR (A), quantitative RT-PCR (B), and Western blot (C) analyses were performed with the indicated specific primers or antibodies on single-cell suspensions from spleens of Top-NOTCHIC-/MIT-c-MYC tumors.
Figure 4C demonstrates that hu-NOTCHIC expression is lost within 6 hours of Dox treatment and p53 expression begins increasing at this time, consistent with previously published data.13 Exogenous hu-c-MYC expression, which is not regulated by Dox, is continuously expressed (Figure 4B-C). At the time when tumors regress (96 hours to 1 week), as indicated by decreased spleen size and loss of immature T cells in the spleen, ectopic hu-c-MYC is still expressed at the mRNA and protein level. These data indicate that, in tumors formed in the presence of NOTCHIC and c-MYC, c-MYC expression alone cannot maintain the tumor. T-ALL tumors formed in the presence of NOTCHIC contain an intact p53 pathway. Therefore, we propose that the failure of c-MYC to maintain these T-ALL tumors when NOTCHIC expression is lost is the result of the inability of c-MYC to suppress induction of p53.
NOTCHIC expression can maintain a T-ALL tumor when c-MYC expression is extinguished
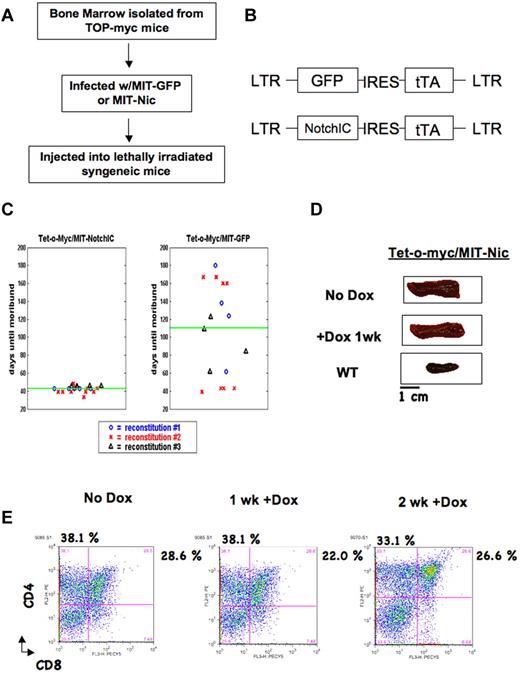
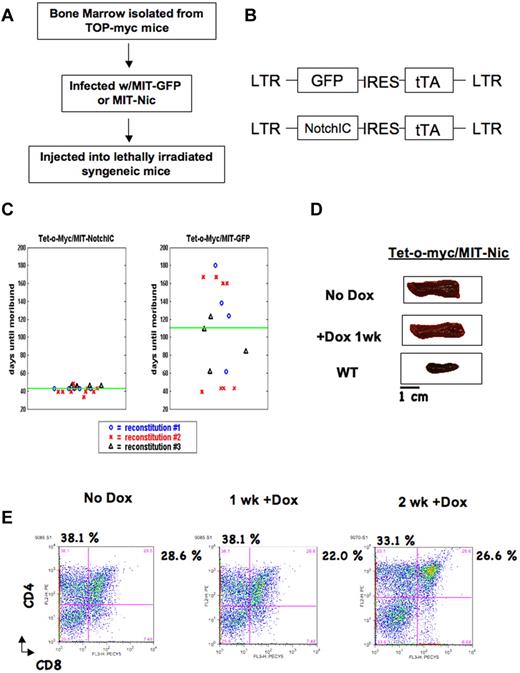
Bone marrow was isolated from Tet-o-MYC mice and spin-infected with MIT-GFP or MIT-NOTCHIC. Infected bone marrow was then injected into the tail vein of lethally irradiated syngeneic mice (Figure 5A-B). Expression of NOTCHIC significantly accelerates Tet-o-MYC tumor formation (P = .0001453). The average tumor formation was 110.06 days for Tet-o-MYC/MIT-GFP tumors and 42.62 days for Tet-o-MYC/MIT-NOTCHIC tumors (Figure 5C). As oncogenic levels of c-MYC induce p53-mediated apoptosis,35 c-MYC–induced tumors must acquire a mutation resulting in inactivation of the p53 pathway during tumor formation.36 NOTCHIC is able to suppress the expression of p53; therefore, c-MYC–induced tumors form faster without the need to acquire a mutation in the p53 pathway.13
NOTCHIC expression can maintain Tet-o-MYC/MIT-NOTCHIC T-ALL tumors. (A) Schematic for generation of Tet-o-MYC/MIT-NOTCHIC tumors. (B) Diagram of retroviral constructs. (C) Death curves for mice reconstituted with Tet-o-MYC bone marrow infected with MIT-NOTCHIC (left panel) and MIT-GFP (right panel). (D) Spleens from nonregressing Tet-o-MYC/MIT-NOTCHIC. (E) FACS analysis using α-CD4-PE and α-CD8-PerCP-Cy5.5 antibodies on single-cell suspensions from spleens of moribund nonregressing Tet-o-MYC/MIT-NOTCHIC treated with Dox for the indicated times.
NOTCHIC expression can maintain Tet-o-MYC/MIT-NOTCHIC T-ALL tumors. (A) Schematic for generation of Tet-o-MYC/MIT-NOTCHIC tumors. (B) Diagram of retroviral constructs. (C) Death curves for mice reconstituted with Tet-o-MYC bone marrow infected with MIT-NOTCHIC (left panel) and MIT-GFP (right panel). (D) Spleens from nonregressing Tet-o-MYC/MIT-NOTCHIC. (E) FACS analysis using α-CD4-PE and α-CD8-PerCP-Cy5.5 antibodies on single-cell suspensions from spleens of moribund nonregressing Tet-o-MYC/MIT-NOTCHIC treated with Dox for the indicated times.
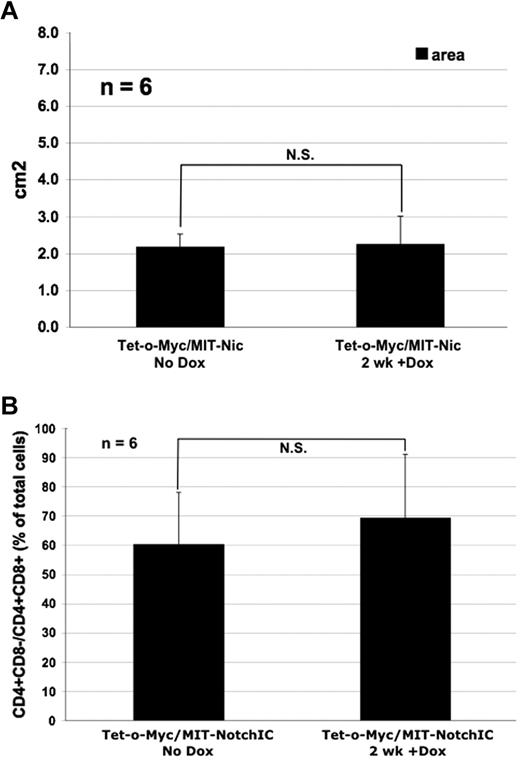
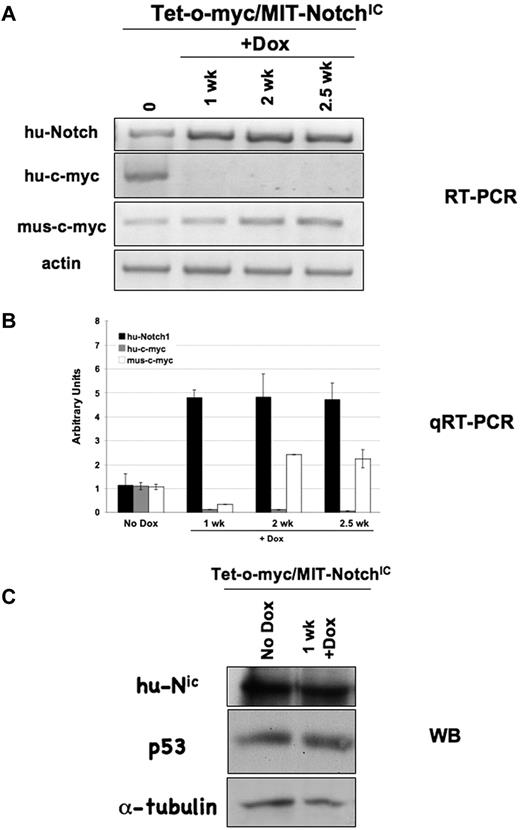
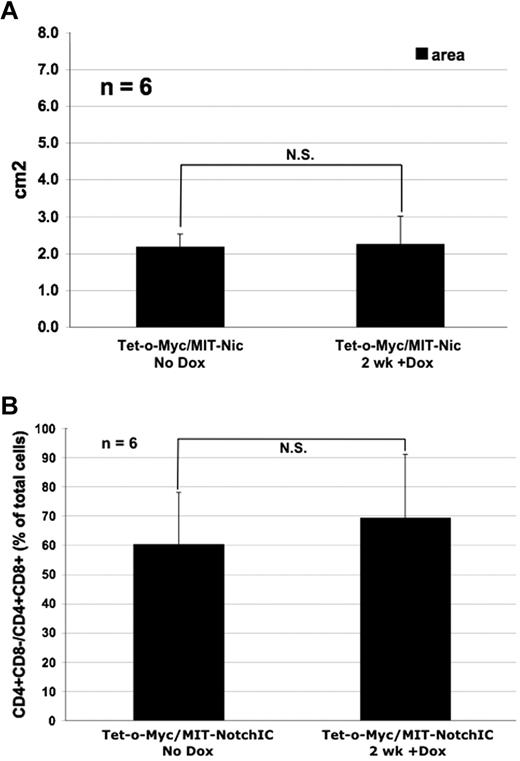
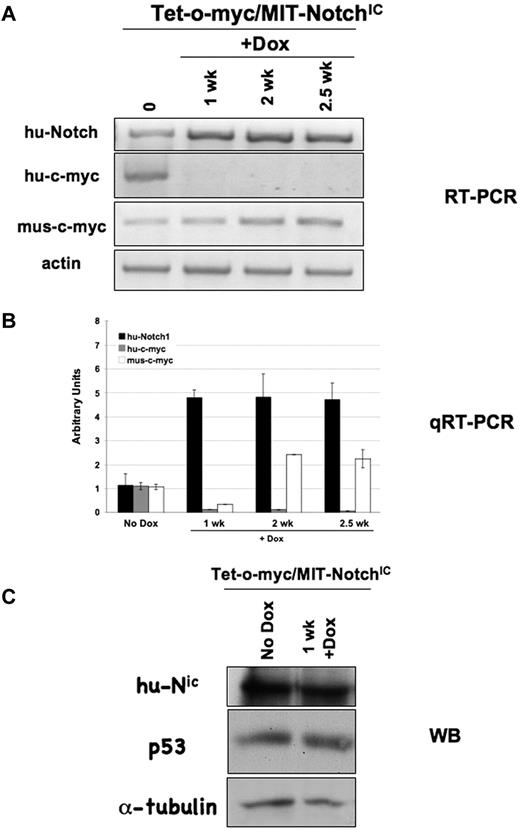
Mice moribund with Tet-o-MYC/MIT-NOTCHIC tumors were administered Dox in the drinking water to extinguish c-MYC expression while maintaining NOTCHIC expression. Over a one-week period, there was no significant reduction in spleen size after treatment (Figure 5D). FACS analysis was subsequently performed using anti-CD4-PE and anti-CD8-PerCP-Cy5.5 antibodies on single-cell suspensions from spleens after Dox treatment. Consistent with previous reports, tumors were composed of CD4+CD8+ and CD4+CD8− T cells (Figure 4E).30,33,34 Therefore, we calculated the total number of CD4+CD8− and CD4+CD8+ (immature) T cells collectively to measure reduced tumor burden. The number of immature T cells in the spleens of mice with nonregressing Tet-o-MYC/MIT-NOTCHIC tumors was not reduced even 2 weeks after Dox treatment. All mice had to be euthanized by 2.5 weeks after treatment. Neither the spleen size nor the percentage of immature T cells in the spleen was reduced in these mice after 2 weeks of Dox treatment (n = 6; Figure 6). RT-PCR analysis was performed to confirm that hu-c-MYC was no longer expressed after Dox treatment in nonregressing Tet-o-MYC/MIT-NOTCHIC tumors (Figure 7A). These results were confirmed by real-time RT-PCR analysis (Figure 7B). Analysis of hu-NOTCHIC expression in these tumors revealed that ectopic hu-NOTCHIC expression was maintained (Figure 7A-B). Western blot analysis was performed on untreated spleens and those treated for 1 week with Dox. By 1 week after Dox treatment, the tumor burden is reduced in mice with Tet-o-MYC/MIT-GFP (data not shown), Top-NOTCH/MIT-GFP (data not shown), and Top-NOTCH/MIT-c-MYC tumors (Figures 1D, 2, and 3). However, after 1 week of Dox treatment, Tet-o-MYC/MIT-NOTCHIC tumors do not regress (Figures 5D-E, 6) and NOTCH expression is maintained (Figure 7C). Furthermore, although p53 expression is highly induced in regressing Top-NOTCH/MIT-c-MYC tumors (Figure 4C), there is no increase in p53 expression at this time point in nonregressing Tet-o-MYC/MIT-NOTCHIC tumors (Figure 7C).
Spleen size of moribund mice reconstituted with Tet-o-MYC/MIT-NOTCHIC bone marrow does not significantly reduce after Dox treatment. (A) Area (length × width) of moribund mice reconstituted with Tet-o-MYC/MIT-NOTCHIC bone marrow, untreated with Dox (No Dox) or treated for 2 weeks with Dox. N.S. indicates not significant. P = .8257 (Student t test). n = 6. (B) Quantification of CD4+CD8− and CD4+CD8+ T cells in spleens of mice with Tet-o-MYC/MIT-NOTCHIC tumors untreated or treated with Dox for 2 weeks. There was no significant change (N.S.) in the size of spleens of mice with Tet-o-MYC/MIT-NOTCHIC treated with Dox (P = .8574; Student t test). n = 6.
Spleen size of moribund mice reconstituted with Tet-o-MYC/MIT-NOTCHIC bone marrow does not significantly reduce after Dox treatment. (A) Area (length × width) of moribund mice reconstituted with Tet-o-MYC/MIT-NOTCHIC bone marrow, untreated with Dox (No Dox) or treated for 2 weeks with Dox. N.S. indicates not significant. P = .8257 (Student t test). n = 6. (B) Quantification of CD4+CD8− and CD4+CD8+ T cells in spleens of mice with Tet-o-MYC/MIT-NOTCHIC tumors untreated or treated with Dox for 2 weeks. There was no significant change (N.S.) in the size of spleens of mice with Tet-o-MYC/MIT-NOTCHIC treated with Dox (P = .8574; Student t test). n = 6.
NOTCHIC expression is maintained in nonregressing Tet-o-MYC/MIT-NOTCHIC tumors treated with Dox. (A) RT-PCR analysis of spleens from nonregressing Tet-o-MYC/MIT-NOTCHIC tumors treated with Dox for the indicated times using the indicated specific primers. (B) Quantitative RT-PCR analysis on single-cell suspensions from spleens of nonregressing Tet-o-MYC/MIT-NOTCHIC tumors treated with Dox. (C) Western blot analysis with antibodies against the indicated proteins in nonregressing Tet-o-MYC/MIT-NOTCHIC tumors treated with Dox.
NOTCHIC expression is maintained in nonregressing Tet-o-MYC/MIT-NOTCHIC tumors treated with Dox. (A) RT-PCR analysis of spleens from nonregressing Tet-o-MYC/MIT-NOTCHIC tumors treated with Dox for the indicated times using the indicated specific primers. (B) Quantitative RT-PCR analysis on single-cell suspensions from spleens of nonregressing Tet-o-MYC/MIT-NOTCHIC tumors treated with Dox. (C) Western blot analysis with antibodies against the indicated proteins in nonregressing Tet-o-MYC/MIT-NOTCHIC tumors treated with Dox.
Collectively, data derived from the Top-NOTCH/MIT-c-MYC and Tet-o-MYC/MIT-NOTCHIC tumors clearly demonstrate that NOTCHIC expression is necessary and sufficient to maintain these tumors. In addition, these data demonstrate that c-MYC is incapable of suppressing p53-mediated apoptosis in the absence of NOTCHIC and that loss of NOTCHIC expression, but not loss of c-MYC expression, leads to regression of the tumor.
Discussion
In this study, tumors were engineered by expression of both c-MYC and NOTCH, where one was expressed constitutively via retroviral LTR and the other under the control of the Tet Transactivator. This experimental design allowed us to determine whether tumors could be maintained or whether they would regress, when one of the oncogenes was turned off. When NOTCHIC expression was extinguished, while maintaining ectopic MYC expression, tumors rapidly regressed, indicating that c-MYC expression alone could not rescue the neoplastic phenotype. However, when the reciprocal conditions were tested and ectopic c-MYC expression was turned off while NOTCH expression was maintained, tumors did not regress, indicating that NOTCH expression alone could maintain the neoplastic phenotype. These data demonstrate that NOTCH is oncogenic dominant over c-MYC in T-ALL tumors.
Both NOTCH and MYC are transcriptional regulatory proteins that direct complex cascades of transcription in response to multiple cellular cues. Recent data have been provided indicating that the gene expression profiles of c-MYC and NOTCH significantly overlap, suggesting that they can regulate a similar or overlapping gene expression program.26 Given the substantial overlap in gene expression programs and that c-MYC is also a direct target of NOTCH, these data would suggest that c-MYC is a primary downstream NOTCH effector. If this is the case, then c-MYC should be able to compensate for NOTCH in T-ALL. This, however, is not the case, as c-MYC expression cannot compensate for the loss of NOTCH activity. This strongly suggests that, although the transcriptional regulatory programs overlap, NOTCH provides a distinct physiologic response to activation that is required to maintain the tumor.
What is the distinct physiologic response that makes NOTCH oncogenic dominant over c-MYC? There are substantial data in the literature that addresses the mechanisms of cellular transformation by NOTCH and MYC proteins. For instance, both of these oncogenes can regulate the cell cycle. However, evidence indicating that cell-cycle progression is dependent on these combined signals is clearly absent. In contrast, evidence supports the idea that NOTCH and MYC can regulate the cell cycle independently. For example, NOTCH directly regulates D-type cyclin expression, represses p27, and induces CDK2/4 activity independently of c-MYC.18,23,24 Furthermore, cyclin D3 null mice are relatively resistant to NOTCH-induced T-ALL formation, indicating that NOTCH regulation of cyclin D expression is critical for NOTCH-regulated cell-cycle progression. This suggests that NOTCH induction of endogenous c-MYC expression is not sufficient to drive cell cycle progression and transformation.
Multiple proviral mediated insertional mutagenesis experiments support the data presented herein. T-ALL tumors obtained in MMTVD/Myc mice infected with murine leukemia virus harbor proviral insertions in the Notch locus in 52% of tumors.37 This indicates that NOTCH activation provides a significant advantage to T-ALL development in Myc transgenic mice. In contrast, no proviral insertions were detected in the c-Myc locus in murine leukemia virus-infected lck-NotchIC mice, indicating that c-MYC does not provide any advantage to NOTCH in T-ALL progression.28 Consistent with these results, NOTCHIC expression accelerates c-MYC–mediated T-ALL formation, whereas c-MYC expression does not alter the rate of NOTCHIC-tumor formation (Figure 1C, 5C).
Beverly et al reported that, in NOTCH transgenic mice (Eμ-Tet-Transactivator/Top-NOTCH), NOTCH suppresses the p53 pathway through p19ARF repression. When NOTCHIC expression was extinguished, tumors regressed because of p53-mediated apoptosis.13 In addition, when these mice were crossed onto a p53+/− background, there was no acceleration in tumorigenesis and tumors did not exhibit loss of heterozygosity at the p53 locus, demonstrating that there is no pressure to mutate p53 in NOTCH-induced tumors. Taken together, these data reveal a model in which NOTCH drives T-ALL development by inducing sustainable cell cycle progression and inhibition of p53-mediated apoptosis.10,13
The requirement for inactivating p53 pathway mutations in c-MYC–induced tumorigenesis has been well documented.35,36 Greater than 50% of Eμ-myc B-cell lymphomas harbor mutations that inactivate the p53 pathway, and ARF+/−/Eμ-myc mice display loss of heterozygosity at the wild-type ARF allele in 80% of lymphomas.35 We show herein that, in Top-NOTCHIC/MIT-c-MYC tumors, p53 protein levels are suppressed. When NOTCHIC expression is extinguished, p53 protein levels are dramatically up-regulated, indicating that, as in the Top-NOTCH model, tumors are regressing by a p53-dependent mechanism. Therefore, we propose that the advantage NOTCH provides to c-MYC-induced tumors is the ability to suppress p53-mediated apoptosis and relieve the requirement to obtain a p53 pathway mutation during tumor initiation and progression. These data indicate that the suppression of p53-mediated apoptosis in T-ALL is NOTCH-dependent and that c-MYC cannot rescue this function. Therefore, we propose that Notch exerts oncogenic dominance over MYC because NOTCH can suppress p53-mediated apoptosis.
In contrast to the results reported here, a recent report presented evidence that c-MYC can maintain some NOTCH-dependent T-ALL cell lines when NOTCH activity is inhibited using a γ-secretase inhibitor.25 In this study, 3 of 6 cell lines tested could be rescued by ectopic c-MYC expression. What underlies the difference between this in vitro result and the in vivo data presented here? Data obtained from primary human T-ALL tumors demonstrate that, like the Top-NOTCHIC mouse model, a very low percentage of tumors contain a mutation in the p53 pathway (0%-5%).38,39 However, a high rate of p53 mutations was found in human T-ALL cells lines.40 In addition, most human T-ALL cell lines have been established from relapsed tumors, which have a greater rate of p53 mutations (7%-28%) than primary tumors.38,39,41 Therefore, the increased rate of p53 mutations in human cell lines provides at least one mechanism that addresses why c-MYC is able to rescue some of the NOTCH-dependent T-ALL cell lines on γ-secretase inhibitor treatment. Furthermore, there is a lag period in all rescued cell lines (6-12 days) before c-MYC-positive cells begin to outgrow those not expressing c-MYC, suggesting that only a subset of cells can be rescued by c-MYC expression.25 Although it would be tempting to conclude that the ability of c-MYC to rescue NOTCH-dependent T-cell lines depends on p53 status, further experimentation is necessary.
Assuming that γ-secretase inhibitor treatment becomes the standard of care for T-ALL in the near future, can we anticipate what mutations might drive relapse of neoplastic disease? Beverly et al reported, in the Top-NOTCH mouse model, that 100% of the tumors entered a period of remission on treatment with Dox that was followed by an aggressive relapse of disease. Although the mechanistic details of the relapse are not currently known, data presented here might shed some light on the issue. We have demonstrated that NOTCH activity drives 2 fundamental aspects of tumorigenesis in T-ALL: driving proliferation and inhibiting apoptosis.10,13,18 When NOTCH activity is inhibited, tumors regress because of p53-mediated apoptosis, which cannot be rescued by a MYC-driven proliferative signal. This raises the question: What combination of mutations found in T-ALL could “mimic” the functions of NOTCH? For example, loss of p53 combined with increased c-MYC expression might be able to rescue NOTCH function. Indeed, loss of p53 impeded regression of Top-NOTCH T-ALL tumors but was not sufficient alone to rescue the neoplastic phenotype. Given that mutations in the p53 pathway occur much more frequently in relapsed T-ALL tumors,38,39,41 activation of c-MYC or other drivers of cell cycle might cooperate with loss of p53 and maintain the tumor when NOTCH activation is inhibited. Furthermore, phosphatase and tensin homolog (PTEN) inactivation has been observed in 17% of human cases examined,42 but it has been demonstrated that loss of PTEN alone is not sufficient to maintain tumors when NOTCH activation is inhibited in a mouse model of T-ALL.43 These data, along with our data, prove that mutations that induce cell cycle and inhibit p53-mediated apoptosis are both required to compensate for loss of NOTCH activation in T-ALL. Therefore, we predict that combinations of mutations, such as loss of PTEN and activation of c-MYC, could “mimic” NOTCH function in patients resistant to treatment or relapsed tumors. Examination of the expression profiles that occur in human T-ALL tumors and defining potential complementation groups will assist in identifying which pathways can compensate for loss of NOTCH.
The analogy that tumors are like a house of cards is frequently used with the intention of expressing the concept that, if one card is removed, the “house” (or tumor) will fall. In other words, tumors are like a house of cards and that targeting specific oncogenes will result in effective treatment. However, we demonstrate here that, just as in the house of cards analogy, loss of some, but not all, cards will collapse the “house.” Therefore, to make a particular “house” collapse on itself, one must choose the “critical cards.”
The publication costs of this article were defrayed in part by page charge payment. Therefore, and solely to indicate this fact, this article is hereby marked “advertisement” in accordance with 18 USC section 1734.
Acknowledgments
The authors thank the personnel at the core facilities of the Wistar Institute whose services were used, including the Bioinformatics Facility, the Animal Facility, the Flow Cytometry Facility, and the Research Supply Center.
This work was supported by the National Institutes of Health (grant R01 CA 83736 and ACS grant RPG LBC99465; A.J.C.), Wistar Cancer Center, Wistar Institute (core grant P30 CA10815), and the DeWitt Daughtry Department of Surgery. R.M.D. was supported in part by the Wistar Institute (Basic Cancer Research training grant T32 CA09171).
National Institutes of Health
Authorship
Contribution: R.M.D. performed all the experiments and contributed to experimental design and data analysis; A.J.C. was responsible for experimental design and data analysis; and N.D. contributed to data analysis discussion, and manuscript preparation.
Conflict-of-interest disclosure: The authors declare no competing financial interests.
Correspondence: Anthony J. Capobianco, Department of Molecular Oncology, Dewitt Daughtry Family Department of Surgery, University of Miami Sylvester Comprehensive Cancer Center, University of Miami Miller School of Medicine (R-104), Miami, FL 33136; e-mail: tcapobianco@med.miami.edu.

