Abstract
Chronic myelomonocytic leukemia (CMML) is a clonal hematopoietic disorder that occurs in elderly patients. One of the main diagnostic criteria is the accumulation of heterogeneous monocytes in the peripheral blood. We further explored this cellular heterogeneity and observed that part of the leukemic clone in the peripheral blood was made of immature dysplastic granulocytes with a CD14−/CD24+ phenotype. The proteome profile of these cells is dramatically distinct from that of CD14+/CD24− monocytes from CMML patients or healthy donors. More specifically, CD14−/CD24+ CMML cells synthesize and secrete large amounts of alpha-defensin 1-3 (HNP1-3). Recombinant HNPs inhibit macrophage colony-stimulating factor (M-CSF)–driven differentiation of human peripheral blood monocytes into macrophages. Using transwell, antibody-mediated depletion, suramin inhibition of purinergic receptors, and competitive experiments with uridine diphosphate (UDP)/uridine triphosphate (UTP), we demonstrate that HNP1-3 secreted by CD14−/CD24+ cells inhibit M-CSF–induced differentiation of CD14+/CD24− cells at least in part through P2Y6, a receptor involved in macrophage differentiation. Altogether, these observations suggest that a population of immature dysplastic granulocytes contributes to the CMML phenotype through production of alpha-defensins HNP1-3 that suppress the differentiation capabilities of monocytes.
Introduction
Chronic myelomonocytic leukemia (CMML) is the most frequent myelodysplastic/myeloproliferative disorder, a group of diseases defined 10 years ago by the World Health Organization (WHO). This clonal hematopoietic disease that occurs in elderly patients is defined by a persistent peripheral blood monocytosis of more than 109/L, with a percentage of monocytes greater than 10% of the white blood cell count, and a hypercellular bone marrow with a significant degree of granulocytic proliferation and myeloid cell dysplasia. The diagnosis is affirmed when cytogenetic and/or molecular examinations have excluded BCR-ABL–positive chronic myelogenous leukemia. The number of blasts found in the peripheral blood and the bone marrow is the main parameter that affects the disease outcome.1
The pathogenesis of CMML remains poorly understood. Clonal cytogenetic abnormalities are detected in 20% to 40% of the patients,1 and a copy-neutral uniparental disomy was identified in approximately 50% of the patients.2,3 Mutations in RUNX1 gene were also detected in approximately 50% of CMML patients,4 whereas RAS gene mutations were found in less than one-third of them.5 Using various genetic approaches, deletions or loss-of-function mutations in TET2 (ten-eleven tranlocation-2) gene were recently identified in hematopoietic cells from patients with myeloid malignancies,6 and appeared especially frequent in CMML.3 Other acquired genetic abnormalities were identified in small subgroups of patients,7 and it remains difficult to distinguish those that play an important role in the disease pathogenesis from those acquired as a consequence of disease progression.
Deregulated production of cytokines could also play a role in CMML pathogenesis, as an autocrine production of vascular endothelial growth factor favors angiogenesis,8 whereas the down-regulated production of interleukin-32 (IL-32) could affect the differentiation potential of monocytes.9 Lastly, an elevated level of phospho-signal transducer and activator of transcription 5 (Tyr694) in response to low doses of granulocyte-macrophage colony-stimulating factor was proposed as a molecular signature of CMML cells.10 This signature is limited to part of the leukemic clone as CMML cells exhibit considerable cellular heterogeneity.
By further exploring this cellular heterogeneity, we observed that cells morphologically identified as monocytes on CMML peripheral blood smears included a variable fraction of immature and dysplastic granulocytes. These latter cells belong to the leukemic clone, lack the lipopolysaccharide receptor CD14, and express CD24. We demonstrate that these CD14−/CD24+ CMML cells specifically synthesize and secrete high levels of alpha-defensins HNP1-3. In turn, these peptides negatively regulate the macrophage colony-stimulating factor (M-CSF)–induced differentiation of monocytes into macrophages. Such an inhibitory effect may account for the accumulation of monocytes in the peripheral blood and affect innate immune response in these patients.
Methods
Samples
Patients and volunteers signed an informed consent according to the Declaration of Helsinki and the recommendations of the independent scientific review board of Cochin Hospital in Paris, in accordance with current regulations and ethical concerns. Chronic-phase CMML diagnosis was based on WHO criteria. Patients were newly diagnosed or had previously diagnosed hematopoietic disease and were followed every 3 months. They were either untreated or received supportive care or cytotoxic treatment, in most cases hydroxyurea.
Cell sorting
Blood samples were collected using ethylenediaminetetraacetic acid–containing tubes. Mononucleated cells were first selected by Ficoll Hypaque. Then, we used the AutoMacs system (Miltenyi Biotec) to perform cell enrichment. A first negative selection that included antibodies targeting CD3, CD7, CD16, CD19, CD56, CD123, and glycophorin A was used for monocyte enrichment. In CMML samples, CD14+ and CD14− populations were further enriched using an anti-CD14 antibody. Sorted cells were either characterized immediately or cultured in RPMI 1640 medium with glutamax-l (Lonza) with 10% fetal bovine serum and/or recombinant human (rh) M-CSF (100 ng/mL; PromoCell) for various times as described.11 To isolate granulocytes, we collected the white cell layer directly above the red blood cells and performed a positive selection using microbeads conjugated to a monoclonal mouse anti–human CD16 antibody (Miltenyi Biotec).
Proteome analysis
The proteome from 106 cells in a buffer lysis solution (urea 7M, n-octyl-β, d-glucopyranoside 2%, tributyl phosphine 20mM) was fractionated using magnetic bead–hydrophobic interaction chromatography by incubating 5 μg of cell proteins with C8 beads for 5 minutes. The proteome fractions, eluted with 10 μL of an acetonitrile solution (50%), were analyzed using a matrix-assisted laser desorption/ionization time-of-flight mass spectrometer (Ultraflex; Bruker Daltonics). Briefly, 1 μL of eluted fraction was mixed with 5 μL of matrix solution (0.4 g/L α-cyano-4-hydroxy-cinnamic acid in ethanol-acetone 2:1) and spotted 4 times onto a 600-μm diameter spot size 384 AnchorChip target (Bruker Daltonics) and left to dry. Acquisition was performed in a linear positive mode in a mass range of 1000 to 15 000 Da (1500 randomized shots over 15 positions) and ionization was achieved by irradiation with a nitrogen laser (337 nm) operating at 50 Hz (detailed proteomic data are provided in supplemental Figures 1-3, available on the Blood website; see the Supplemental Materials link at the top of the online article). For spectra analysis, 21 samples were analyzed (8 spectra per sample: 2 purifications using C8 beads and 4 spots per eluate). A first dataset included CD14−/CD24+ cells and CD14+/CD24− cells from 7 CMML patients (14 samples). Of the 112 spectra, 2 did not meet quality criteria. A second dataset (152 spectra) concerned CD14+/CD24− cells from 12 CMML patients and monocytes from 7 healthy donors. Random and chemical noises were removed; normalization was performed using the total ionic count. Peaks were then identified and quantified with a logarithmic transformation for each spectrum. At this step, each spectrum was described by 436 (first dataset) or 479 (second dataset) variables. Data were preprocessed and analyzed using the Rgui statistical software (R Foundation for Statistical Computing). Principal components analysis was used to visualize between- and within-group variances. On the plot, the distance between points indicates the variability between biologic samples and the dispersion ellipse represents biologic samples spreading in a group. Differential peaks were detected using a linear model methodology.12 To correct the inflated type I error rate due to multiple testing, P values were adjusted using the Benjamini-Hochberg method.
Cell treatment
All our experiments were performed in the presence of serum. Cells were sorted, cultured overnight in the presence of serum before exposure to M-CSF, in the absence or presence of HNPs. Recombinant HNPs were obtained from PeptaNova; uridine triphosphate (UTP), uridine diphosphate (UDP), and suramin (Sigma-Aldrich) were added at indicated concentrations to CD14+/CD24− cells in the presence of rhM-CSF. Transwell studies were performed in 24-well plates using a hanging cell-culture insert (0.4-μm pore; Millipore). CD14+/CD24− CMML cells were cultured in the lower compartment in the presence of 100 ng/mL rhM-CSF for various times, in the absence or presence of increasing numbers of CD14−/CD24+ cells sorted from the same CMML blood sample in the upper compartment. We also collected the supernatant of CD14−/CD24+ cells incubated in noncomplemented RPMI medium for 4 hours at 37°C. HNP1-3 were depleted from CD14−/CD24+ supernatant using clone-21 anti–human HNP1-3 mouse monoclonal antibody (Hycult biotechnology) coupled to Protein A/G Sepharose beads (Santa Cruz Biotechnology). The supernatant was incubated with beads alone (as a control) or coupled to clone 21 antibody under gentle rotation overnight at 4°C. Beads were spun down and immunodepletion efficacy was checked by mass spectrometry. Antisense oligonucleotides (5μM) were used to down-regulate purinergic receptors in primary monocytes as described13 using the Amaxa technology, with sense oligonucleotides used as controls.
Gene expression analyses
Total RNA was isolated with TRIzol (Invitrogen) and reverse transcribed by Moloney murine leukemia virus reverse transcriptase (Promega) with random hexamers (Promega), and real-time quantitative polymerase chain reaction (RQ-PCR) was performed with AmpliTaq Gold polymerase in an Applied Biosystems 7500 Fast thermocycler using the standard SyBr Green detection protocol as outlined by the manufacturer (Applied Biosystems). Briefly, 12 ng of total cDNA, 50nM (each) primers, and 1× SyBr Green mixture were used in a total volume of 20 μL. Primers sequences are available upon request. Antibodies include anti-CD14, -CD24, -CD71, -CD163, and isotype-matched controls from Pharmingen and anti–human HNP1-3 from Hycult biotechnology.
Flow cytometry
Sorted cells were washed with ice-cold phosphate-buffered saline (PBS) and incubated at 4°C for 1 hour in 100 μL of PBS containing 0.1% bovine serum albumin with a combination of phycoerythrin (PE)–conjugated mouse anti-CD14 and fluorescein isothiocyanate–conjugated mouse anti-CD24 antibodies. Negative controls were obtained by substitution of the monoclonal antibody by allophycocyanin- and PE-conjugated mouse immunoglobulin G1 control antibodies (Pharmingen). After 1 wash with PBS, cells were fixed in 2% paraformaldehyde. Differentiated cells were studied using a combination of allophycocyanin-conjugated mouse anti-CD71 and PE-conjugated mouse anti-CD163 antibodies (PharMingen, BD Biosciences). HNP1-3 intracellular expression was explored using an anti–HNP1-3 mouse monoclonal antibody (clone D21, human monoclonal antibody; Hycult biotechnology). Briefly, 106 cells were fixed in 2% paraformaldehyde for 10 minutes at room temperature, permeabilized for 20 minutes with 0.1% saponin and 1% bovine serum albumin in PBS, and then incubated for 1 hour with the anti–HNP1-3 antibody (1:10) and for 30 minutes with 488-Alexa goat anti–mouse before fixation in 1% paraformaldehyde. Fluorescence was measured using appropriate channels of LSRII (Becton Dickinson). A total of 10 000 events per sample were collected and data were analyzed using FlowJo software (TreeStar).
Immunoblots
Briefly, cells were washed in PBS, lysed in radioimmunoprecipitation assay buffer (150mM NaCl, 50mM Tris [tris(hydroxymethyl)aminomethane]–HCl, pH 8.0, 0.1% Na–sodium dodecyl sulfate [SDS], 0.5% Na-desoxycholate) in the presence of protease inhibitors (0.1mM phenylmethylsulphonyl fluoride, 2.5 μg/mL pepstatin, 10 μg/mL aprotinin, 2.5 μg/mL trypsin inhibitor, 5 μg/mL leupeptin) and centrifuged at 15 000g for 20 minutes at 4°C before incubating 20 μg of supernatant proteins in loading buffer (125mM Tris-HCl, pH 6.8, 10% β-mercaptoethanol, 4.6% SDS, 20% glycerol, and 0.003% bromophenol blue). After SDS–polyacrylamide gel electrophoresis and electroblotting on polyvinylidene fluoride membrane (Bio-Rad), nonspecific binding sites were blocked and membranes incubated with mouse anti-CD71, mouse anti-CD163, or mouse antiactin Abs (Santa Cruz Biotechnology). After washes, membranes were incubated with a peroxidase-conjugated secondary Abs and specific labeling was revealed by enhanced chemiluminescence kit (Roche Diagnostics). Immunoblot analysis of HNP1-3 was performed on cellular proteins obtained using a RNA/DNA/Protein purification kit (Norgen). HNP1-3s were detected as a 3.8-kDa band in a Tris-Tricine/SDS precast gel (10%-20% gradient; Bio-Rad).
Immunostaining
CD14+, CD14−/CD24+, and CD16+ cells (300 000 cells per cytospin) were immunostained using usual 3-step streptavidin-biotin technique. A block step with 30% fetal calf serum (FCS) PBS, to reduce unspecific binding, was done before incubation with HNP1-3 primary antibody (clone D21, human monoclonal antibody; Hycult biotechnology) overnight. HNP1–3 immunochemistry on indicated cells and macrophage differentiation (adhesion to culture plate and fibroblast-like shape) was visualized by the use of a cell observer station (Zeiss) that is composed of an Axiovert 200M inverted microscope equipped with an Axiocam HRm camera (Zeiss). Images were acquired using 100×/1.4 NA oil objective and Axiovision 4.6.3 software (Zeiss).
Cytokine antibody blot array and HNP1-3 ELISA
Monocytes were induced to differentiate into macrophages in the presence of rhM-CSF as previously described11 in presence or absence of HNP3. One or 5 days after, cell culture supernatant was collected and stored at −80°C until analysis. The presence of chemokines/cytokines in macrophage supernatant was assessed using human cytokine antibody arrays panel A (R&D Systems) following the manufacturer's instructions. HNP1-3 was quantified in healthy donor and patient plasma using an enzyme-linked immunosorbent assay (ELISA) kit from Hycult biotechnology, following the manufacturer's instructions.
Statistical analysis
Mean fluorescence indexes were compared using the Mann-Whitney nonparametric test (significance: P < .05). Correlation between HNP1-3 plasma level and the number of peripheral blood granulocytes was tested using linear regression.
Results
CMML peripheral blood leukemic cells include dysplastic granulocytes
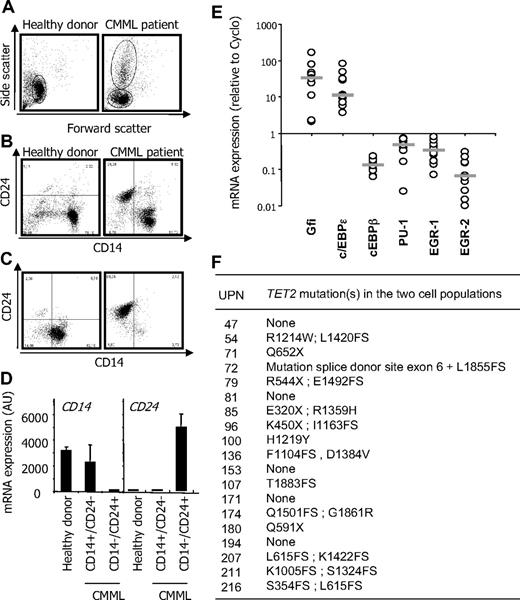
The morphologic heterogeneity of monocytes is a known feature of CMML. To further explore this cellular heterogeneity, we collected peripheral blood samples and used a negative selection procedure for monocyte enrichment. Side/forward scatter analysis of enriched cells identified a unique population of monocytes in healthy donor samples and an additional population of cells in CMML peripheral blood (Figure 1A). Immunophenotype analyses indicated that peripheral blood mononuclear cells sorted by this procedure from healthy donor samples expressed CD14 and did not express CD24. When CMML peripheral blood samples were analyzed, an additional cell population that lacked CD14 expression and expressed CD24 antigen at its surface was identified (Figure 1B). We then performed an additional positive selection procedure using an anti-CD14 antibody to separate these 2 cell populations. The anti-CD14 antibody sorted a population of cells with a CD14+/CD24− phenotype that was similar to that of normal monocytes (Figure 1C left panel), whereas the negatively selected cells demonstrated a CD14−/CD24+ phenotype (Figure 1C right panel). The differential expression of CD14 and CD24 in these sorted cell populations was confirmed at the mRNA level (see 2 examples in Figure 1D).
CMML peripheral blood mononuclear cells. (A-B) Peripheral blood mononuclear cells were selected from a healthy donor (control) and a CMML patient before AutoMacs negative selection for monocyte enrichment. (A) Side/forward scatters were analyzed by flow cytometry. (B) Flow cytometric analysis of CD14 and CD24 identifying CD14+/CD24− in the healthy donor and an additional population of CD14−/CD24+ cells in the CMML sample. (C) CD14+/CD24− and CD14−/CD24+ CMML cells were further enriched through positive selection based CD14 expression. (D) RQ-PCR analysis of CD14 and CD24 gene expression in cells sorted as in panels B and C (mean ± SD of triplicates). Each panel shows 1 representative of 20 samples. (E) RQ-PCR analysis of indicated genes in CD14+/CD24− and CD14−/CD24+ cells sorted from 10 patients. Expression normalized to 1 in CD14+/CD24−; the ratio of expression in CD14−/CD24+ cells is shown. Bar represents median. (F) TET2 gene sequence was analyzed in CD14+/CD24− and CD14−/CD24+ cells sorted from 19 patients. Indicated abnormalities were found in all cases in the 2 cell populations.
CMML peripheral blood mononuclear cells. (A-B) Peripheral blood mononuclear cells were selected from a healthy donor (control) and a CMML patient before AutoMacs negative selection for monocyte enrichment. (A) Side/forward scatters were analyzed by flow cytometry. (B) Flow cytometric analysis of CD14 and CD24 identifying CD14+/CD24− in the healthy donor and an additional population of CD14−/CD24+ cells in the CMML sample. (C) CD14+/CD24− and CD14−/CD24+ CMML cells were further enriched through positive selection based CD14 expression. (D) RQ-PCR analysis of CD14 and CD24 gene expression in cells sorted as in panels B and C (mean ± SD of triplicates). Each panel shows 1 representative of 20 samples. (E) RQ-PCR analysis of indicated genes in CD14+/CD24− and CD14−/CD24+ cells sorted from 10 patients. Expression normalized to 1 in CD14+/CD24−; the ratio of expression in CD14−/CD24+ cells is shown. Bar represents median. (F) TET2 gene sequence was analyzed in CD14+/CD24− and CD14−/CD24+ cells sorted from 19 patients. Indicated abnormalities were found in all cases in the 2 cell populations.
In 109 studied CMML patients, we observed important interindividual variations in the number of CD14−/CD24+ cells among enriched cells. Linear regression analysis indicated a strong correlation between this number and the number of leukocytes (r2 = 0.977) or polymorphonuclear cells (r2 = 0.957). Blind analysis of peripheral blood smears could not predict the percentage of CD14−/CD24+ cells in a given sample. On May-Grünwald-Giemsa–stained cytospins of sorted populations, CD14−/CD24+ cells did not correspond to blast cells or easily identifiable immature myeloid cells. The chromatin was similar in the 2 cell populations, but some CD14−/CD24+ cells showed cytoplasmic granules. Transmission electronic microscopy further distinguished CD14+/CD24− cells with pseudopods and phagocytic vacuoles from CD14−/CD24+ cells with a round shape and no engulfment activity (supplemental Figure 4).
Myeloid cell differentiation is driven by a gene network in which Gfi-1 and c/EBPϵ transcription factors favor granulopoiesis over monocytopoiesis, whereas PU-1 favors monocytopoiesis and represses granulopoiesis through early growth response factors 1 and 2.14 RQ-PCR analyses demonstrated that CD14−/CD24+ CMML cells expressed high levels of Gfi-1 and C/EBP-ϵ and low levels of PU-1, Egr-1, and Egr2 mRNAs compared with CD14+/CD24− cells (Figure 1E). This pattern of transcription factors again argued for immature granulocytes. Because TET2 gene mutation or deletion in 4q24 appeared as a frequent somatic genetic event in CMML3 (and M.F., personal results), we sequenced TET2 gene in a series of 19 pairs of sorted samples as described above. We identified a variety of TET2 gene alterations in 14 of these samples, including deletions, insertions, and nonsense and missense mutations, and 2 distinct TET2 sequence alterations in 10 of them (Figure 1F). In all cases, genetic alterations in TET2 gene were the same in CD14+/CD24− and CD14−/CD24+ cell populations, suggesting that both cell types belong to the leukemic clone.
CD14−/CD24+ CMML cells express high levels of HNP1-3
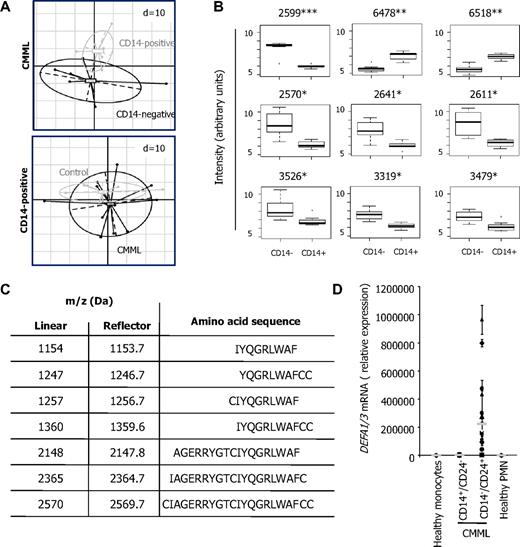
To obtain further insights in the origin of the CD14−/CD24+ CMML cells, we compared their proteome profile with that of CD14+/CD24− CMML cells. This proteome profile was first studied in cells sorted from 7 CMML patients. Using the principal component analysis to obtain a global representation of the profiles, we easily distinguished the 2 cell populations (Figure 2A top panel). This principal component analysis was also used to compare the proteome profile of CD14+/CD24− cells sorted from CMML peripheral blood with the one of monocytes sorted from healthy donor samples, which appeared to be very similar (Figure 2A bottom panel). Among the peptides differentially expressed in CD14+/CD24− and CD14−/CD24+ CMML cell populations (Figure 2B), we focused on a 2570-Da peak, identified as a fragment of alpha-defensins HNP1-3 by mass spectrometry. Several other HNP1-3 fragments, whose sequence is shown in Figure 2C, were found to be highly expressed in CD14−/CD24+ CMML cells. The expression of DEFA1/3 genes, encoding HNPs, was low in monocytes from healthy donors and CMML patients and dramatically higher in CD14−/CD24+ CMML cells (Figure 2D).
Differential expression of HNP1-3 in the 2 CMML cell populations. (A) Comparison of proteome profiles. One dispersion ellipse was drawn for each cell type. Principal components analysis represents the within- and between-group variability without loss of information. Spectra are defined by 436 peaks in the top panel and 479 peaks in the bottom panel. The distance between points depends on the similarity between biologic samples, and dispersion ellipses represent biologic samples spreading in each group. (Top panel) CD14+/CD24− and CD14−/CD24+ cells sorted from 7 CMML samples. (Bottom panel) CD14+/CD24− CMML cells (n = 12) and monocytes from healthy donors (n = 7). Each point shows average of 8 replicates. (B) Box plots of the 9 most differential peaks in CD14+/CD24− (CD14+) and CD14−/CD24+ (CD14−) cells sorted from 7 CMML samples. Intensities were log-transformed. Bars outside represent smallest and largest intensities; points outside, outliers. Numbers indicate mass over charge (m/z). Adjusted P value = .016 (*), .006 (**), .001 (***). (C) Amino acid sequence of HNP1-3 fragments whose m/z and monoisotopic mass are indicated, as identified by tandem mass spectrometry (Da indicates Daltons). (D) RQ-PCR analysis of DEFA1/3 mRNA expression: mean ± SD triplicates in monocytes from 12 healthy donors and sorted CD14+/CD24− and CD14−/CD24+ cells from 12 CMML patients (gray line indicates median).
Differential expression of HNP1-3 in the 2 CMML cell populations. (A) Comparison of proteome profiles. One dispersion ellipse was drawn for each cell type. Principal components analysis represents the within- and between-group variability without loss of information. Spectra are defined by 436 peaks in the top panel and 479 peaks in the bottom panel. The distance between points depends on the similarity between biologic samples, and dispersion ellipses represent biologic samples spreading in each group. (Top panel) CD14+/CD24− and CD14−/CD24+ cells sorted from 7 CMML samples. (Bottom panel) CD14+/CD24− CMML cells (n = 12) and monocytes from healthy donors (n = 7). Each point shows average of 8 replicates. (B) Box plots of the 9 most differential peaks in CD14+/CD24− (CD14+) and CD14−/CD24+ (CD14−) cells sorted from 7 CMML samples. Intensities were log-transformed. Bars outside represent smallest and largest intensities; points outside, outliers. Numbers indicate mass over charge (m/z). Adjusted P value = .016 (*), .006 (**), .001 (***). (C) Amino acid sequence of HNP1-3 fragments whose m/z and monoisotopic mass are indicated, as identified by tandem mass spectrometry (Da indicates Daltons). (D) RQ-PCR analysis of DEFA1/3 mRNA expression: mean ± SD triplicates in monocytes from 12 healthy donors and sorted CD14+/CD24− and CD14−/CD24+ cells from 12 CMML patients (gray line indicates median).
Flow cytometric analysis of permeabilized cells easily detected HNP1-3 in healthy donor granulocytes, whereas the proteins were hardly found in healthy donor monocytes (Figure 3A). The proteins were also detected at low levels in CD14+/CD24− CMML cells and were highly expressed in CD14−/CD24+ CMML cells as well as CD16+ mature granulocytes from these patients (Figure 3A-B). The 3 alpha-defensins were easily detected by mass spectrometry in the supernatant of CD14−/CD24+ CMML cells cultured in serum-free medium for 6 hours, although hardly detected in the supernatant of CD14+/CD24− CMML cells cultured in the same conditions (Figure 3C). Immunoblot analysis identified high levels of uncleaved HNP1-3 in healthy donor and CMML granulocytes as well as in CD14−/CD24+ CMML cells, whereas the proteins were hardly identified in control and CMML CD14+ cells (Figure 3D). HNP1-3 were also visualized by immunochemistry in CD16+ granulocytes from healthy donors and CMML patients as well as CD14−/CD24+ CMML cells (Figure 3E). HNP1-3 level measured in plasma samples from 70 healthy donors by ELISA was 23.5 (± 6.9) ng/L. In 47 patients with CMML, we observed a significant correlation between HNP1-3 plasma level and the absolute number of granulocytes, including morphologically recognized polymorphonuclear cells and CD14−/CD24+ cells (Figure 3F).
Synthesis and secretion of HNP1-3. (A-B) HNP1-3 expression in permeabilized healthy monocytes and neutrophils (CD16+) and CD14+/CD24− (CD14+) and CD14−/CD24+ (CD14−) cells sorted from CMML. (A) One representative series of samples. (B) A series of 10 normal and 10 CMML samples was studied (mean fluorescence index reported to the control antibody; *P = .006; **P = .005; ***P = .001). (C) MS analysis of proteins secreted by CD14−/CD24+ (red lines) and CD14+/CD24− (green lines) cells sorted from 3 representative CMML samples cultured for 6 hours in serum-free medium. (D) Immunoblot analysis of HNP1-3 in healthy donor (Co) CD14+ monocytes and CD16+ granulocytes, and in CD14−/CD24+, CD14+/CD24−, and CD16+ cells sorted from 2 CMML patients. (E) HNP1-3 was also examined by immunochemistry on cytospins of CD16+, CD14+/CD24−, and CD14−/CD24+ CMML cells and CD16+ granulocytes and CD14+ monocytes of healthy donors. (F) Correlation between HNP1-3 plasma level and the absolute number of granulocytes (including morphologically recognized polymorphonuclear cells and CD14−/CD24+ cells) in 47 patients with CMML.
Synthesis and secretion of HNP1-3. (A-B) HNP1-3 expression in permeabilized healthy monocytes and neutrophils (CD16+) and CD14+/CD24− (CD14+) and CD14−/CD24+ (CD14−) cells sorted from CMML. (A) One representative series of samples. (B) A series of 10 normal and 10 CMML samples was studied (mean fluorescence index reported to the control antibody; *P = .006; **P = .005; ***P = .001). (C) MS analysis of proteins secreted by CD14−/CD24+ (red lines) and CD14+/CD24− (green lines) cells sorted from 3 representative CMML samples cultured for 6 hours in serum-free medium. (D) Immunoblot analysis of HNP1-3 in healthy donor (Co) CD14+ monocytes and CD16+ granulocytes, and in CD14−/CD24+, CD14+/CD24−, and CD16+ cells sorted from 2 CMML patients. (E) HNP1-3 was also examined by immunochemistry on cytospins of CD16+, CD14+/CD24−, and CD14−/CD24+ CMML cells and CD16+ granulocytes and CD14+ monocytes of healthy donors. (F) Correlation between HNP1-3 plasma level and the absolute number of granulocytes (including morphologically recognized polymorphonuclear cells and CD14−/CD24+ cells) in 47 patients with CMML.
HNP1-3 inhibit M-CSF–driven differentiation of peripheral blood monocytes into macrophages
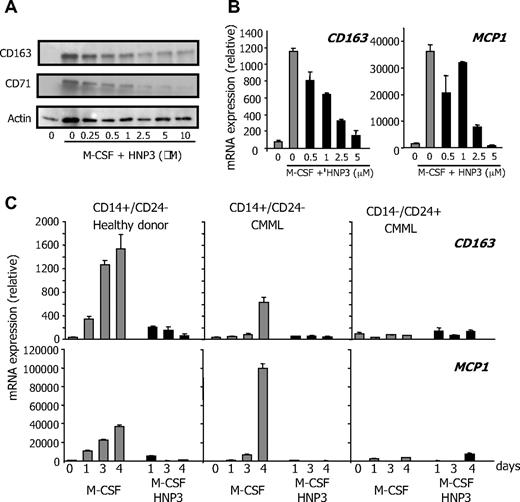
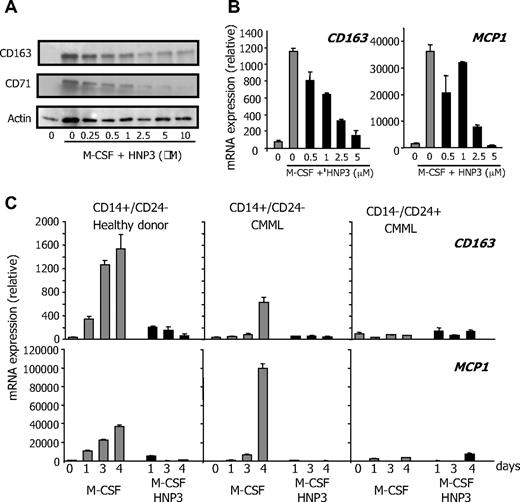
Peripheral blood monocytes are nonproliferative cells in which recombinant human HNP1-3 (rhHNP1-3) did not demonstrate any cytotoxic effect (not shown). We then tested whether these peptides could affect their differentiation. Culture of peripheral blood monocytes from healthy donors in the presence of 100 ng/mL rhM-CSF triggers their differentiation into macrophages, as assessed by acquisition of a fibroblast-like shape, and by increased expression of the scavenger receptor CD163, the antibacterial peptide monocyte chemotactic protein 1 (MCP1), and the transferring receptor CD71.11 Addition of rhHNP1-3 to the culture medium dose-dependently inhibited M-CSF–driven differentiation of peripheral blood monocytes, as indicated by the decreased accumulation of CD71 and CD163 (Figure 4A). We observed a similar effect of recombinant HNP1 or HNP2 (not shown) or the combination of the 3 recombinant HNPs. HNP3 also inhibited M-CSF–driven differentiation of CD14+/CD24− CMML monocytes, as demonstrated by studying CD163 and MCP1 gene expression (Figure 4B). HNP3-induced inhibition of control and CMML monocytes was confirmed at various time points, whereas CD14−/CD24+ CMML cells did not differentiate upon M-CSF exposure (Figure 4C). Here, we demonstrate a yet unknown property of HNP1-3 peptides: their ability to inhibit dose-dependently the M-CSF–driven differentiation of peripheral blood monocytes into macrophages.
HNP1-3 inhibit M-CSF–induced monocyte differentiation. (A) Healthy donor monocytes were incubated with 100 ng/mL rhM-CSF and increasing concentration of rhHNP3 for 2 days before immunoblot analysis of indicated proteins. (B-C) RQ-PCR analysis of CD163 and MCP1 gene expression in sorted CMML monocytes (CD14+/CD24−) exposed to 100 ng/mL rhM-CSF in the absence or presence of rhHNP3 for 6 days (B) and in healthy donor monocytes, and CD14+/CD24− and CD14−/CD24+ CMML cells exposed to M-CSF and 5 μg/mL rhHNP3 for 1 to 4 days. (B-C) Values normalized to L32 mRNA level, expressed in arbitrary units. Mean ± SD of triplicates; 1 of 4 independent experiments is shown.
HNP1-3 inhibit M-CSF–induced monocyte differentiation. (A) Healthy donor monocytes were incubated with 100 ng/mL rhM-CSF and increasing concentration of rhHNP3 for 2 days before immunoblot analysis of indicated proteins. (B-C) RQ-PCR analysis of CD163 and MCP1 gene expression in sorted CMML monocytes (CD14+/CD24−) exposed to 100 ng/mL rhM-CSF in the absence or presence of rhHNP3 for 6 days (B) and in healthy donor monocytes, and CD14+/CD24− and CD14−/CD24+ CMML cells exposed to M-CSF and 5 μg/mL rhHNP3 for 1 to 4 days. (B-C) Values normalized to L32 mRNA level, expressed in arbitrary units. Mean ± SD of triplicates; 1 of 4 independent experiments is shown.
HNP1-3 secreted by CD14−/CD24+ inhibit CD14+/CD24− CMML cell differentiation
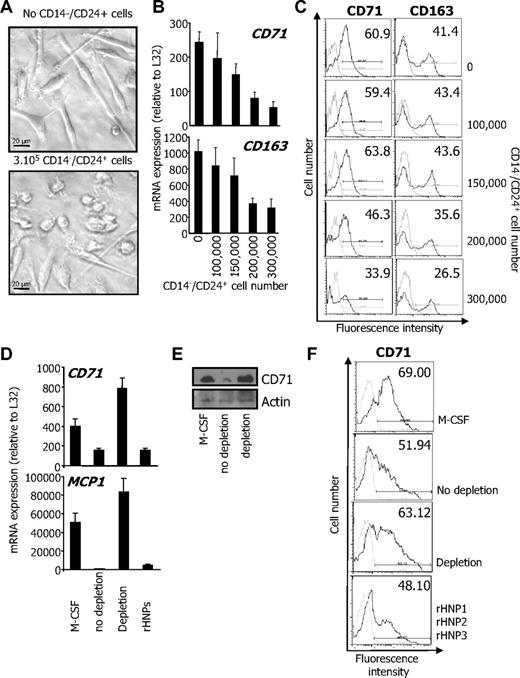
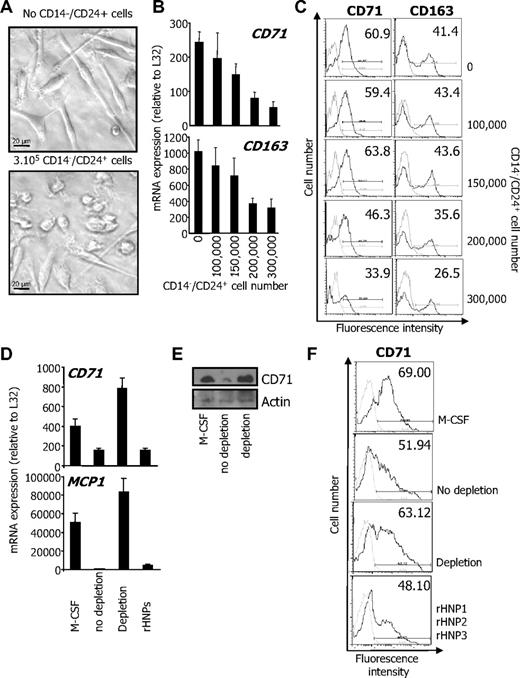
The previous observations led us to wonder whether CD14−/CD24+ CMML cells could interfere with the differentiation of CD14+/CD24− cells from the same patient through secretion of HNP1-3. First, CD14+/CD24− CMML cells (2 × 10⁵) were seeded in the lower compartment of a transwell culture plate and cultured in presence of 100 ng/mL rhM-CSF for 4 days, in the absence or presence of increasing numbers of CD14−/CD24+ CMML cells in the upper compartment. The differentiation of CD14+/CD24− CMML cells upon rhM-CSF exposure was assessed by acquisition of a fibroblast-like shape (Figure 5A), and the expression of CD71 and CD163 at the mRNA level (Figure 5B) and at the cell surface (Figure 5C). The presence of CD14−/CD24+ CMML cells in the upper compartment of the transwell device dose-dependently inhibited the differentiation of CD14+/CD24− CMML cells (Figure 5A-C), suggesting that CD14−/CD24+ cells secreted 1 or several factors that inhibit CD14+/CD24− cell differentiation. To determine whether HNP1-3 could be responsible for this inhibitory effect, we collected the supernatant of CD14−/CD24+ CMML cells cultured in serum-free medium for 4 hours and containing HNP1-3 (Figure 3C). Culture of CD14+/CD24− CMML cells in the presence of this supernatant, or in the presence of a combination of rhHNP1, HNP2, and HNP3 as a positive control, inhibited their response to M-CSF, as assessed by the decreased induction of CD71 and MCP1 gene expression measured by RQ-PCR (Figure 5D) and the decreased expression of CD71 explored by immunoblot (Figure 5E) or by flow cytometry (Figure 5F). Antibody-mediated depletion of HNP1-3 from CD14−/CD24+ CMML cell supernatant reversed the differentiation inhibition (Figure 5D-F). Altogether, these observations argued for a role of HNP1-3 in the inhibition of M-CSF–driven differentiation of CD14+/CD24− by CD14−/CD24+ CMML cells.
Secreted HNP1-3 mediate inhibition of M-CSF–induced differentiation. (A-C) CD14+/CD24− CMML cells (2 × 10⁵) were cultured for 4 days with M-CSF in the lower compartment of a transwell device, in the absence or presence of indicated numbers of CD14−/CD24+ CMML cells. (A) Phase-contrast microscopy analysis of CD14+/CD24− cells. (B) RQ-PCR analysis of CD71 and CD163 mRNA in cells of the lower compartment (mean ± SD of triplicates, relative to L32 mRNA level). (C) Flow cytometric analysis of CD71 and CD163 at the surface of cells cultured in the lower compartment. Numbers indicate percentage of positive cells. Results show 1 representative of 3 independent experiments. (D-F) The supernatant of CD14−/CD24+ CMML cells cultured in serum-free medium for 4 hours was collected. HNP1-3 were depleted using clone 21 antibody coupled to beads. CD14+/CD24− CMML cells were cultured with M-CSF for 2 days in the supernatant (depleted, not depleted, or depleted and supplemented with the 3 rhHNPs; total concentration: 5μM), before assessing CD71 and MCP1 gene expression (D; expressed as in panel B) and CD71 protein expression by immunoblot (E) or by flow cytometry after 5 days (numbers indicate % of positive cells; F).
Secreted HNP1-3 mediate inhibition of M-CSF–induced differentiation. (A-C) CD14+/CD24− CMML cells (2 × 10⁵) were cultured for 4 days with M-CSF in the lower compartment of a transwell device, in the absence or presence of indicated numbers of CD14−/CD24+ CMML cells. (A) Phase-contrast microscopy analysis of CD14+/CD24− cells. (B) RQ-PCR analysis of CD71 and CD163 mRNA in cells of the lower compartment (mean ± SD of triplicates, relative to L32 mRNA level). (C) Flow cytometric analysis of CD71 and CD163 at the surface of cells cultured in the lower compartment. Numbers indicate percentage of positive cells. Results show 1 representative of 3 independent experiments. (D-F) The supernatant of CD14−/CD24+ CMML cells cultured in serum-free medium for 4 hours was collected. HNP1-3 were depleted using clone 21 antibody coupled to beads. CD14+/CD24− CMML cells were cultured with M-CSF for 2 days in the supernatant (depleted, not depleted, or depleted and supplemented with the 3 rhHNPs; total concentration: 5μM), before assessing CD71 and MCP1 gene expression (D; expressed as in panel B) and CD71 protein expression by immunoblot (E) or by flow cytometry after 5 days (numbers indicate % of positive cells; F).
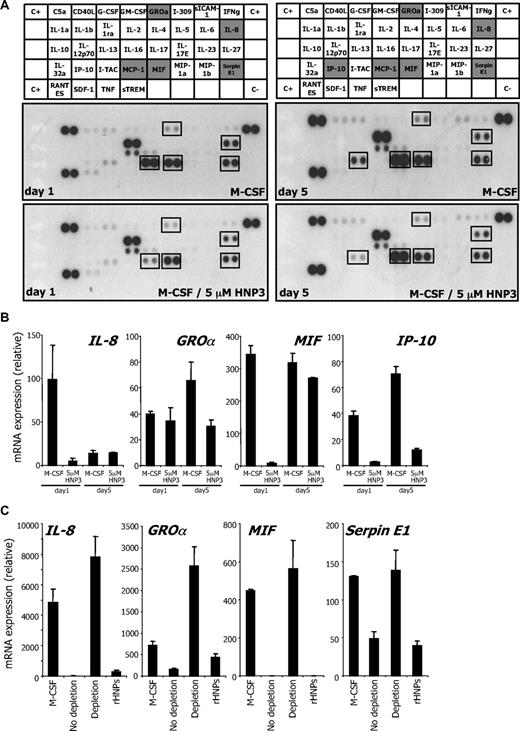
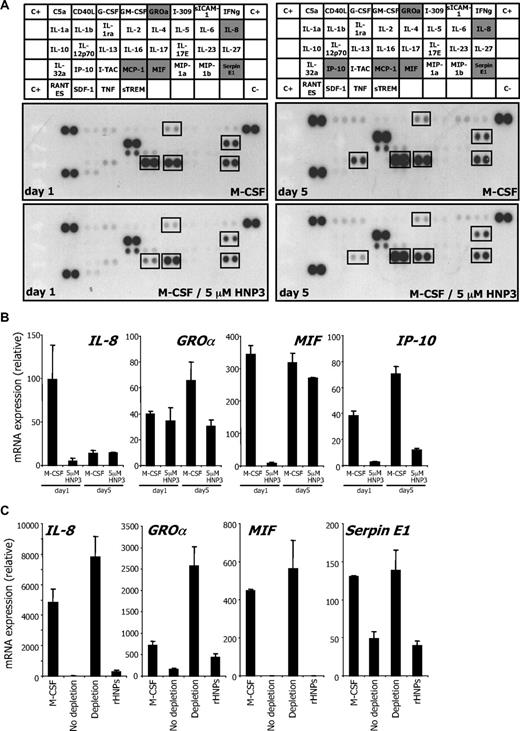
We used human cytokine antibody arrays to explore the effects of HNP1-3 on cytokine secretion by monocytes undergoing differentiation.13,15 HNP1-3 inhibited IL-8 secretion by monocytes undergoing M-CSF–driven differentiation. After 1 day of M-CSF stimulation, HNP1-3 also decreased the secretion of MCP1, macrophage inhibitory factor, growth-regulated oncogene α, and serpin E1. A decreased production of IP-10 (CXCL10 chemokine [C-X-C motif] ligand 10) was further identified at day 5 (Figure 6A). All these changes were confirmed by RQ-PCR analysis (Figure 6B), reproduced in CD14+/CD24− CMML cells incubated with CD14−/CD24+ cell supernatant, and prevented by HNP1-3 depletion (Figure 6C).
HNP1-3 inhibit M-CSF–induced cytokine production during differentiation. (A) Healthy donor monocytes were incubated with 100 ng/mL rhM-CSF and 5μM rhHNP3 for 1 and 5 days. Cytokines were detected in their culture supernatant using an antibody array. (B) RQ-PCR analysis of indicated cytokine gene expression in monocytes exposed to 100 ng/mL rhM-CSF in the absence or presence of rhHNP3 for 1 and 5 days. (C) HNP1-3 were depleted from CD14−/CD24+ CMML supernatant using clone 21 antibody coupled to beads as in Figure 5. CD14+/CD24− CMML cells were cultured with M-CSF for 2 days in the supernatant (depleted, not depleted, or depleted and supplemented with the 3 rhHNPs; total concentration: 5μM), before assessing indicated gene expression. Mean ± SD of triplicates; 1 of 3 independent experiments is shown.
HNP1-3 inhibit M-CSF–induced cytokine production during differentiation. (A) Healthy donor monocytes were incubated with 100 ng/mL rhM-CSF and 5μM rhHNP3 for 1 and 5 days. Cytokines were detected in their culture supernatant using an antibody array. (B) RQ-PCR analysis of indicated cytokine gene expression in monocytes exposed to 100 ng/mL rhM-CSF in the absence or presence of rhHNP3 for 1 and 5 days. (C) HNP1-3 were depleted from CD14−/CD24+ CMML supernatant using clone 21 antibody coupled to beads as in Figure 5. CD14+/CD24− CMML cells were cultured with M-CSF for 2 days in the supernatant (depleted, not depleted, or depleted and supplemented with the 3 rhHNPs; total concentration: 5μM), before assessing indicated gene expression. Mean ± SD of triplicates; 1 of 3 independent experiments is shown.
HNP1-3–mediated inhibition of monocyte differentiation involves P2Y6
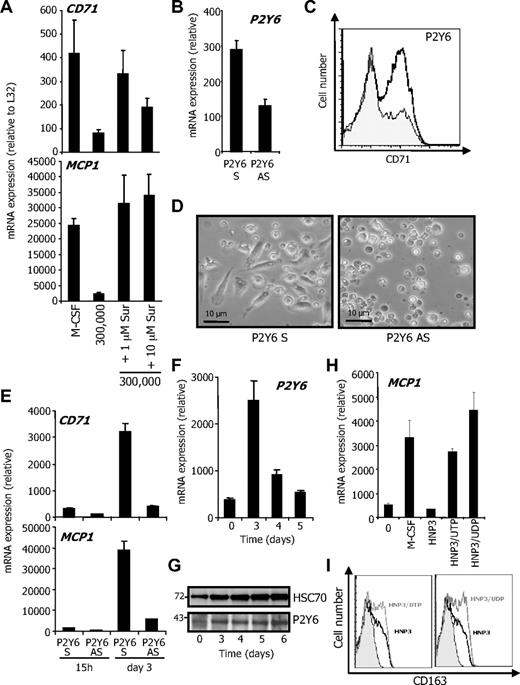
HNP1-3 were demonstrated to interact with the purinergic receptor P2Y6, which is a pertussis toxin–sensitive, Gi-protein–coupled receptor for uridine diphosphate (UDP) and triphosphate (UTP).13,16-18 Inhibition of purinergic receptors with suramin prevented the inhibitory effect of CD14−/CD24+ cells on M-CSF–induced differentiation of CD14+/CD24− in the transwell experiment (Figure 7A). P2Y6 down-regulation using an antisense oligonucleotide (Figure 7B) inhibited M-CSF–induced differentiation of monocytes (Figure 7C-E). Similar results were obtained by down-regulating P2Y2 and P2Y4 (not shown), suggesting a role for purinergic receptors in monocyte survival and differentiation. Interestingly, M-CSF was observed to stimulate P2Y6 expression at the mRNA and protein level (Figure 7F-G), whereas P2Y2 and P2Y4 were down-regulated (not shown). To further explore the role of P2Y6 in the monocyte response to HNP1-3, we performed competitive experiments with UDP and UTP. At 100 μM, both reversed HNP3-induced inhibition of macrophage differentiation, as indicated by RQ-PCR analysis of MCP1 mRNA (Figure 7H) and flow cytometry analysis of CD163 expression (Figure 7I) after 3 days of exposure to M-CSF. These results argued for a role of P2Y6 in the HNP1-3–induced inhibition of M-CSF–induced differentiation of monocytes into macrophages.
UDP/UTP competes with HNP1-3 to inhibit monocyte differentiation. CD14+/CD24− CMML cells were cultured in the lower compartment of a transwell device as described in Figure 5. (A) Indicated concentrations of suramin were added to the lower compartment before measuring CD71 and CD163 mRNA levels (expressed as in Figure 5B). (B) Monocytes were transfected with P2Y6 oligonucleotide sense (S) or antisense (AS) by Amaxa, 15 hours before RQ-PCR analysis of P2Y6 mRNA. Monocytes were then exposed for 4 days to rhM-CSF after indicated nucleotide transfection. Macrophage differentiation was assessed by CD71 flow cytometric analysis (P2Y6 S and P2Y6 AS are indicated by white and gray histograms, respectively; C) and morphologically (fibroblastic-like shape; D). RQ-PCR analysis of indicated gene expression in P2Y6 oligonucleotide-transfected monocytes (E). (F-G) Study of P2Y6 expression at the mRNA (F) and protein level (G) during macrophagic differentiation. HSC70 represents loading control. Molecular weights are indicated. (H-I) Primary monocytes were incubated for 3 days with rhM-CSF alone, rhM-CSF, and 5μM HNP3 in presence or absence of 100μM UTP or UDP. Macrophage differentiation was identified by increased MCP1 mRNA (H) and CD163 protein (I) expression. One of 4 independent experiments is shown.
UDP/UTP competes with HNP1-3 to inhibit monocyte differentiation. CD14+/CD24− CMML cells were cultured in the lower compartment of a transwell device as described in Figure 5. (A) Indicated concentrations of suramin were added to the lower compartment before measuring CD71 and CD163 mRNA levels (expressed as in Figure 5B). (B) Monocytes were transfected with P2Y6 oligonucleotide sense (S) or antisense (AS) by Amaxa, 15 hours before RQ-PCR analysis of P2Y6 mRNA. Monocytes were then exposed for 4 days to rhM-CSF after indicated nucleotide transfection. Macrophage differentiation was assessed by CD71 flow cytometric analysis (P2Y6 S and P2Y6 AS are indicated by white and gray histograms, respectively; C) and morphologically (fibroblastic-like shape; D). RQ-PCR analysis of indicated gene expression in P2Y6 oligonucleotide-transfected monocytes (E). (F-G) Study of P2Y6 expression at the mRNA (F) and protein level (G) during macrophagic differentiation. HSC70 represents loading control. Molecular weights are indicated. (H-I) Primary monocytes were incubated for 3 days with rhM-CSF alone, rhM-CSF, and 5μM HNP3 in presence or absence of 100μM UTP or UDP. Macrophage differentiation was identified by increased MCP1 mRNA (H) and CD163 protein (I) expression. One of 4 independent experiments is shown.
Discussion
In the bone marrow of patients with CMML, the pronounced proliferation of granulocytes with abnormal granularity makes it difficult to distinguish monocytes from granulocyte precursors. A similar picture does exist in CMML peripheral blood where monocytes can hardly be distinguished from immature dysplastic granulocytes on routine blood smears. These immature granulocytes are identified by their high levels of Gfi-1 and C/EBP-ϵ transcription factor as well as G-CSF receptor mRNAs and their low levels of PU-1, Egr-1, Egr2, and c-fms (encoding the M-CSF receptor) mRNAs and express CD24 but not CD14. HNP1-3 peptides are synthesized and secreted by CD14−/CD24+ CMML cells and inhibit M-CSF–driven differentiation of CD14+/CD24− cells, at least in part through the P2Y6 receptor. This property may affect innate immune response and could modulate the characteristic accumulation of monocytes in the peripheral blood of CMML patients.
HNP1-3 are small (3 kDa), cationic, beta-sheet, tridisulphide peptides, normally stored in the azurophilic granules of neutrophils.19 These peptides were also detected in a variety of human tumors in which, depending on the tumor type, they originated from tumor cells, from tumor infiltrating immune cells, including neutrophils, and from endothelial cells of tumor capillaries.20 In CMML patients, HNP1-3 accumulation was detected mainly in cells with a CD14−/CD24+ phenotype. In normal bone marrow, the defensin-1 (DEFA1) gene encoding HNP-1 is expressed at promyelocyte, myelocyte, and early metamyelocyte stages of the granulocytic pathway and the protein is stockpiled in granules of mature cells for later use.21 A complete down-regulation of DEFA1 gene expression occurs during late granulocytic maturation, and circulating neutrophils from healthy subjects have no measurable levels of DEFA1 transcript.22-24 Detection of DEFA1/3 mRNA and HNP1-3 proteins in CMML CD14−/CD24+ cells further supports the immature granulocyte phenotype of these cells.
HNP1-3 have antimicrobial, antiviral, toxin-neutralizing, and immunomodulatory properties. HNP2 is the smallest human defensin (29 amino acids) and differs from HNP1 and HNP3 by the absence of only 1 N-terminal amino-acid residue (alanine in HNP1, aspartate in HNP3) but the 3 proteins have similar bioactivities. In neutrophils, HNP1-3 are the most abundant bactericidal factor compounds stored in the azurophilic granules and the major component of an oxygen-independent system used by these cells to eliminate invading microorganisms or to inactivate potent bacterial exotoxins.25,26 HNP1-3 produced in solid tumors were suggested to affect the growth of malignant cells,27 to exert a cytotoxic effect on tumor cells,28 and to interfere with tumor angiogenesis.29 HNP1-3 was also demonstrated to modulate the antitumor immune response, as several HNPs were eluted from human leukocyte antigen class II molecules at the surface of peripheral blood mononuclear cells and functional studies indicated that alpha-defensins loaded at the surface of antigen-presenting cells could decrease in a dose-dependent manner the ability of these cells to stimulate specific T cells.30 Here, we demonstrate another yet unknown property of HNP1-3, which is their ability to inhibit dose-dependently the M-CSF–driven differentiation of peripheral blood monocytes into macrophages.
HNP1-3 were reported to stimulate the production of interleukin-8 (IL-8) by monocytes through the purinergic receptor P2Y6, which is a pertussis toxin–sensitive, Gi-protein–coupled receptor for uridine diphosphate (UDP).13 Here, we observed that HNP1-3 inhibited the synthesis and secretion of several cytokines associated with the M-CSF–driven differentiation process. Nevertheless, the ability of suramin to prevent the differentiation inhibitory effect of HNP1-3 on peripheral blood monocytes suggested that this effect was mediated by a suramin-sensitive purinergic receptor. We observed that purinergic receptors were requested for monocyte survival and differentiation, as the down-regulation of P2Y2, P2Y4, and P2Y6 inhibited the differentiation process. P2Y6 is specifically up-regulated with differentiation, and both UTP and UDP inhibit the inhibitory effect of HNP1-3 in competitive experiments, further arguing for a role of P2Y6 or a related receptor.
When recruited at infection sites, neutrophils release abundant HNP1-3 and local concentrations can be high.31,32 It can be suspected that the concentration of HNP1-3 in the bone marrow of patients with CMML, in which immature granulocytes proliferate and accumulate, is abnormally high, which may contribute to the accumulation of monocytes through inhibition of their differentiation. Several neutrophil granule proteins mediate physiologic interactions between mature granulocytes and monocytes. The neutrophil-derived heparin-binding protein promotes monocyte adhesion and extravasation33 and certain proteins induce monocyte/macrophage chemotaxis,34 cytokine and chemoattractant production and release,35 and antigen presentation.36 In addition, heparin-binding protein could increase the phagocytic capacities of human and murine macrophages derived from monocytes.37 Here, we demonstrate that immature dysplastic granulocytes that accumulate in CMML patients secrete soluble factors including HNP1-3 that negatively regulate monocyte differentiation into macrophages when driven by M-CSF.
Accumulating evidence has shown that a population of cells with suppressive activity, known as myeloid-derived suppressor cells, contributes to the negative regulation immune responses during cancer.38 Myeloid-derived suppressor cell activity requires cell-cell contact, whereas immature granulocytes identified in CMML exert their immunosuppressive function in part through secretion of antimicrobial peptides. It will be of interest to determine whether the secreted HNP1-3 could also affect lymphocyte functions and to follow the evolution of the leukemic cell populations upon treatment, as elimination of immature dysplastic granulocytes or restoration of their differentiation may improve the monocytic capabilities of differentiation and innate immune response.
The online version of this article contains a data supplement.
The publication costs of this article were defrayed in part by page charge payment. Therefore, and solely to indicate this fact, this article is hereby marked “advertisement” in accordance with 18 USC section 1734.
Acknowledgments
We are grateful to the patients who participated in this study and physicians from indicated hospitals who provided patient samples: Ingrid Lafon (Dijon), Odile Beyne-Rauz (Toulouse), Aspasia Stamatoulas (Rouen), François Dreyfus (Cochin, Paris), Françoise Boyer (Angers), Bernard Bonnotte (Dijon), Sophie Raynaud (Nice), Hélène Cavé (Robert Debré, Paris), Agnès Guercy (Nancy), Caroline Besson (Kremlin-Bicêtre), and Stéphane de Botton (Villejuif). We thank Jennifer Tracz and Janice Miens for technical assistance. We were helped by IFR100 facilities and the biological hematology department of CHU Le Bocage.
This work was supported by the Program Hospitalier de Recherche Clinique (PHRC MAD06; M.F. and E.S.), the Ligue Nationale Contre le Cancer (Équipe Labellisée; E.S.), the Association Centpoursanglavie, the Agence Nationale de la Recherche (LACAM), and the National Institute of Cancer (INCa-ACM07).
Authorship
Contribution: N.D., A.J., N.B., L.G., E.D., and O.K. performed experiments; J.-B.H., D.P., and P.D. performed proteomic analyses; C.R. and M.C. collected and prepared biologic samples; C.T. and V.J. have done the statistical analyses; P.F. and B.Q. provided samples and advice; M.F. and P.D. designed the study; and E.S. designed the study, directed the work, and wrote the paper.
Conflict-of-interest disclosure: The authors declare no competing financial interests.
Correspondence: Eric Solary, Inserm UMR866, Faculty of Medicine, 7 boulevard Jeanne d'Arc, 21000 Dijon, France; e-mail: esolary@u-bourgogne.fr.


