The t(8;21) translocation, which encodes the AML1-ETO fusion protein (now known as RUNX1-CBF2T1), is one of the most frequent translocations in acute myeloid leukemia, although its role in leukemogenesis is unclear. Here, we report that exogenous expression of AML1-ETO in human CD34+ cells severely disrupts normal erythropoiesis, resulting in virtual abrogation of erythroid colony formation. In contrast, in bulk liquid culture of purified erythroid cells, we found that while AML1-ETO initially inhibited proliferation during early (erythropoietin [EPO]–independent) erythropoiesis, growth inhibition gave way to a sustained EPO-independent expansion of early erythroid cells that continued for more than 60 days, whereas control cultures became growth arrested after 10 to 13 days (at the EPO-dependent stage of development). Phenotypic analysis showed that although these cells were CD13− and CD34−, unlike control cultures, these cells failed to up-regulate CD36 or to down-regulate CD33, suggesting that expression of AML1-ETO suppressed the differentiation of these cells and allowed extensive self-renewal to occur. In the early stages of this expansion, addition of EPO was able to promote both phenotypic (CD36+, CD33−, glycophorin A+) and morphologic differentiation of these cells, almost as effectively as in control cultures. However, with extended culture, cells expressing AML1-ETO became refractory to addition of this cytokine, suggesting that a block in differentiation had been established. These data demonstrate the capacity of AML1-ETO to promote the self-renewal of human hematopoietic cells and therefore support a causal role for t(8;21) translocations in leukemogenesis.
Introduction
The t(8;21)(q22;q22) translocation is one of the most frequent chromosomal abnormalities associated with acute myeloid leukemia (AML), occurring in approximately 40% of AML cases that have M2 morphology in the French-American-British classification.1-4 One of the targets of this translocation is the AML1 gene (also referred to as core-binding factor CBFα, CBFA2,PEBP2αB, or RUNX1), which encodes a transcription factor that forms a heterodimer with CBFβ. TheAML1 gene contains a conserved region that is highly homologous with the product of the Drosophila melanogastersegmentation gene, runt. This region is termed the Runt domain and is required for DNA binding and dimerization with CBFα.5,6 AML1/CBFβ has been shown to be important in the transcriptional regulation of a number of viral, hematopoietic, and cellular genes including interleukin 3,7,8myeloperoxidase,9 the receptor for colony-stimulating factor 1,10 neutrophil elastase,11 and the subunits of the T-cell antigen receptor.12 As a consequence of the t(8;21) translocation, the 5′ portion ofAML1 is fused with nearly the entire ETO(MTG8) gene.13,14 The resultant fusion transcript encodes a chimeric protein consisting of the N-terminal 177 amino acids of AML1 fused in-frame to almost the complete ETO protein.15
The mechanisms of how AML1-ETO expression may contribute to leukemogenesis are not well understood (for reviews, see Downing et al16 and Downing17). The AML1-ETO chimeric protein retains the ability to dimerize with the CBFβ subunit and to interact with the enhancer core sequence, TGTGGT.18Experiments using antisense oligonucleotides have shown that this fusion gene acts dominantly over AML1 and may contribute to a leukemic phenotype by inhibiting differentiation of cells in myeloid lineage.19 Exogenous expression of AML1-ETO also blocks the differentiation of 32Dcl3 cells.20 The role of AML1-ETO in leukemogenesis has also been investigated in transgenic mice using a knock-in strategy to replace wild-type AML1 with AML1-ETO. Using this approach, expression of AML1-ETO led to midgestational lethality around 12.5 days after coitus (dac) mainly due to a complete lack of fetal liver hematopoiesis.21,22 This phenotype mimics that observed in knock-out mice with homozygous-null mutations in AML1 and CBFβ.23-25The targeted disruption of the AML1 gene demonstrated that AML1 is essential for fetal liver hematopoiesis in mice. The similarity between the AML1-ETO knock-in and AML1 knock-out mice again suggests that AML1-ETO acts in a dominant-negative manner in the presence of wild-type AML1 protein. However, whereas yolk sac cells from 12.5 dac AML1 knock-out embryos were unable to form colonies in vitro,22 the same stage yolk sac cells from AML1-ETO knock-in embryos were able to form dysplastic hematopoietic progenitors,21 suggesting that some functions of AML1 may be retained in cells expressing AML1-ETO. More recently, transgenic mice have been produced with the AML1-ETO cDNA controlled by a tetracycline-responsive element. Induction of AML1-ETO expression in these mice caused no overt hematopoietic abnormalities, although replating experiments suggested AML1-ETO was able to promote self-renewal of a subpopulation of myeloid cells.21,26,27Experiments by Mulloy et al,28 in which AML1-ETO was ectopically expressed in CD34+ cells, show that this fusion gene can also promote self-renewal of human stem cells. Despite the capacity of AML1-ETO to promote self-renewal, adult mice are only more susceptible to leukemia if subsequently exposed to carcinogens, suggesting that further gene mutations or “secondary hits” are required for cells expressing AML1-ETO to undergo leukemic transformation.26 29 Overall these studies suggest that although AML1-ETO may result in gross disturbance of hematopoiesis during embryogenesis, expression in adult mice and in the in vitro models results in hematopoietic abnormalities characterized by a capacity to promote self-renewal of hematopoietic cells.
In this study, we have introduced the AML1-ETO fusion gene into human CD34+ hematopoietic cells by using a retroviral vector in which the AML1-ETO fusion gene is coexpressed with green fluorescent protein (GFP). We report here that expression of this gene profoundly affected the growth of normal human erythroid progenitors. Although dramatically reducing the capacity of these cells to generate erythroid colonies, in bulk liquid culture we show that AML1-ETO was able to inhibit early erythroid development and, at the same time, allow greatly extended proliferation of these cells. This study demonstrates the capacity of this leukemia-associated gene to promote self-renewal of normal human cells with a progenitor phenotype.
Materials and methods
Generation of retrovirus
The full-length human cDNA encoding AML1-ETO was created by blunt cloning into the BamHI site of the retroviral expression vector PINCO (gift of Pier Pelicci, European Institute of Oncology, Milan, Italy), which coexpresses GFP from an internal cytomegalovirus (CMV) promoter.30 The integrity of the AML1-ETO/PINCO plasmid was checked by sequencing and by functional assay of its transforming capacity in NIH3T3 cells.31 Replication-defective retrovirus was generated by transient transfection of Phoenix packaging cells (gift of Garry Nolan, Stanford University School of Medicine, Stanford, CA).
Isolation of human CD34+ erythroid cells expressing AML1-ETO
Neonatal cord blood was obtained from healthy full-term pregnancies at the Maternity Unit of the University Hospital of Wales (Cardiff). Human CD34+ cells (> 95% pure) were derived from cord blood using MiniMACS (Miltenyi Biotec, Surrey, United Kingdom) according to the manufacturer's instructions. These cells were subsequently cultured overnight at 1 × 10⁵ cells/mL in Iscove modified Dulbecco medium (IMDM) containing 20% fetal calf serum (FCS) and the following growth factors (from R & D Systems, Abingdon, United Kingdom): interleukin 3 (IL-3; 5 ng/mL), IL-6 (10 ng/mL), stem cell factor (SCF; 20 ng/mL), granulocyte-macrophage colony-stimulating factor (GM-CSF; 5 ng/mL), granulocyte colony-stimulating factor (G-CSF; 5 ng/mL), and Flt3 ligand (5 ng/mL). Multiwell dishes were coated with RetroNectin (Takara Shuzo, Shiga, Japan) overnight according to the manufacturer's instructions. The following day, 500 μL retroviral supernatant was preloaded onto the RetroNectin-coated plate for 30 minutes at 37°C in a humidified atmosphere with 5% CO2. The retroviral supernatant was removed and the CD34+ cells were added to the wells and incubated overnight. On the following day, the infection procedure was repeated. In this way, 3 cultures were derived from each CD34+ preparation: mock, PINCO (expressing GFP alone), and AML1-ETO/PINCO transduced. On day 3, each culture was harvested and stained with CD13-phycoerythrin (PE; Becton Dickinson [BD], Oxford, United Kingdom). GFP+CD13− cells were isolated by flow sorting using a MoFlo cytometer (Cytomation, Fort Collins, CO). Sorted cells were more than 90% pure. Mock-transduced cells were sorted for CD13− expression only. Sorted cells were subsequently used in colony assays or were re-established into bulk liquid culture (see “Cell culture and colony assay”).
Cell culture and colony assay
Initially, liquid cultures were maintained in growth medium containing 5 ng/mL IL-3, IL-6, and SCF but without erythropoietin (EPO). On day 10, a portion of each culture was supplemented with EPO (R & D Systems) at 1 U/mL and cultured for a further 10 days, whereas the remainder were cultured for a further 3 days in the absence of EPO. To calculate the growth of erythroid cells at each time point indicated, a portion of each culture was analyzed by flow cytometry (see “Data analysis”) to determine the proportion of CD13− cells present in the culture. Colony assays were performed on day 3 by limiting dilution in 96-U plates (0.3 cells/well) in the same liquid medium containing IL-3, IL-6, SCF, and EPO and incubated at 37°C with 5% CO2. Individual colonies (> 50 cells) and clusters (> 5 cells) were harvested 14 days following plating and were scored and analyzed for differentiation (see “Data analysis”).
Analysis of AML1-ETO expression
To confirm the expression of the AML1-ETO–transduced gene in human cord blood progenitor cells, we performed reverse transcription–polymerase chain reaction (RT-PCR) analysis of RNAs from Kasumi-1–, control-, and AML1-ETO–transduced cells. Total RNA was isolated following guanidinium thiocyanate lysis and RT using an ETO-outer primer (5′-GGTGTAAATGAACTGGTTCTTGGAG-3′) was performed according to manufacturer's instructions (Applied Biosystems, Warrington, United Kingdom). cDNA was added to the first-round PCR containing AML1-outer primer (5′-TGACCTCAGGTTTGTCGGTCGAAG-3′) and ETO-outer primer. Water was used as a negative control. The PCR was run at 95°C for 4 minutes followed by 30 cycles of 94°C (1 minute); 63°C (1 minute) with a final extension time of 10 minutes at 72°C. First-round product was used as a template in the second round containing AML1-inner primer (5′-AAGCTTCACTCTGACCATCACTGTC-3′), and ETO-inner primer (5′-CATT GTTGGAGGAGTCAGCCTAGA-3′). The second-round product from samples containing the AML-ETO transcript was 181 bp in length. The quality of RNA was assessed by amplifying theABL housekeeping gene in a single-round RT-PCR using random hexamers. The ABL product was observed at 183 bp. Each PCR product was run on a 2% agarose gel containing ethidium bromide and observed under UV light. AML1-ETO RNA was identified by comparison with molecular weight markers and to the positive control (Kasumi-1).
Cell surface phenotype and differentiation analysis
At the time points indicated, liquid cultures were analyzed by 4-color immunophenotypic analysis. In addition, cells were centrifuged onto slides for staining with Wright-Giemsa for morphologic examination. Cells were stained with CD13 allophycocyanin (APC; Leinco Technologies, St Louis, MO) in combination with CD36-biotin (Ancell, Bayport, MN) and one of the following PE-labeled antibodies (BD): CD34, CD33, HLA-DR, or glycophorin A (gly A) (Dako, Ely, United Kingdom). Biotinylated CD36 was subsequently labeled with streptavidin-peridinin chlorophyll protein (PerCP). For analysis of individual colonies, 2 × 10³ latex beads (BD) were added to each colony-containing well to control for recovery in estimation of the number of cells/colony. Colonies were then carefully aspirated and stained with gly A-PE (BD) and CD11b-QR (Sigma, Poole, Dorset, United Kingdom), as described. All reactions were controlled with the appropriate isotype-matched irrelevant antibody. Incubations were carried out at 4°C for 30 minutes in the presence of 0.5% human gamma globulin (Sigma). Reagent concentrations were as recommended by the manufacturer. Data acquisition and analysis are described in “Data analysis.”
Cell cycle analysis
For the analysis of DNA content, day 6 control and AML1-ETO–transduced cultures were washed in PBS and fixed in 70% ethanol for 30 minutes on ice followed by overnight incubation at −20°C. Fixed cells were washed free of alcohol, resuspended in PBS containing 40 μg/mL propidium iodide (Molecular Probes, PoortGebouw, The Netherlands) and 100 μg/mL RNAse type I-AS (Sigma), and incubated at 37°C for 30 minutes. Cell cycle distributions were immediately evaluated by flow cytometry (see “Data analysis”) and assessed using Cylchred (T.H., Department of Haematology, University of Wales College of Medicine, Cardiff, United Kingdom).
PKH26 staining
On day 6, 5 × 10⁴ cells from each culture were stained with the fluorescent PKH26 dye, according to the manufacturer's instructions (Sigma). Subsequent to PKH26 labeling (on days 6, 8, 10, and 13), the cells were labeled with CD13-APC (see “Cell surface phenotype and differentiation analysis”) and analyzed by flow cytometry. The cell division history of CD13− cells was based on the fact that with each cell division the fluorescence intensity of PKH26 is reduced by one half.32
Data analysis
Flow cytometric data were acquired using a FACSCalibur cytometer (BD). Acquired flow cytometric data were analyzed using WinMDI (Joe Trotter, Pharmingen, San Diego, CA). The threshold for GFP positivity was determined from the autofluorescence of identically treated mock-transduced cultures; for antibody-labeled cells, this was determined from control stained cells (in each case, set to 95% of controls). In the case of colony analysis, background staining/autofluorescence was taken as the maximum observed in 6 randomly selected mock-transduced control colonies. Debris and ejected nuclei were excluded from all analyses on the basis of light scatter. Committed myeloid cells were excluded from all analyses based on CD13 positivity. In the analysis of DNA content, doublets were excluded on the basis of pulse width, as were particles with a DNA content of less than 10% of 2N.33 Significance of difference was tested using the Student t test. Minitab software version 12.0 (Minitab, State College, PA) was used for all analyses.
Results
Expression of GFP and AML1-ETO in human CD34+cells
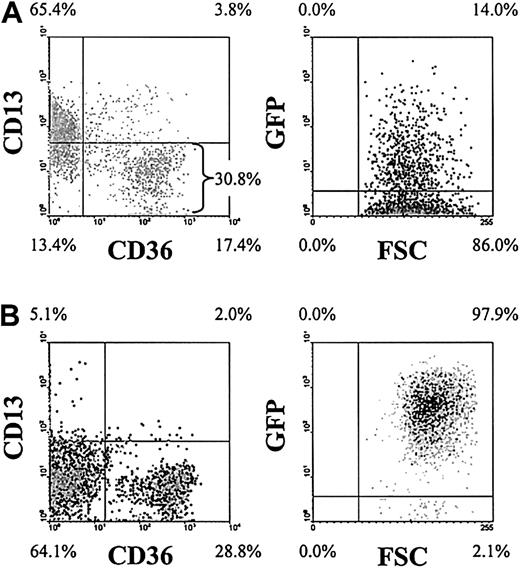
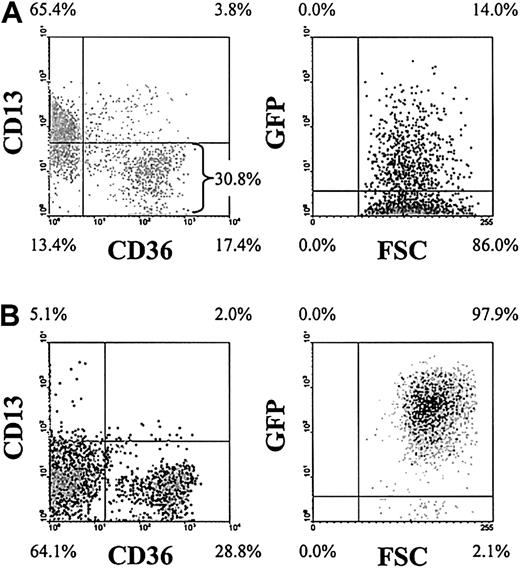
To investigate the effects of the AML1-ETO fusion protein in human primary erythroid development, we retrovirally infected human CD34+ progenitor cells with a recombinant retrovirus expressing the AML1-ETO fusion gene in combination with GFP. Following infection (day 3), 4-color analysis demonstrated that these cultures consisted of predominantly CD34+ cells of which approximately 30% were of erythroid phenotype (CD13−CD36+/−) and of these cells approximately 14% were GFP+ (Figure1A). To facilitate the analysis of the retrovirally transduced erythroid population, we enriched the day 3 cultures for GFP+CD13− cells by FACS. Subsequent analysis showed that this resulted in cultures that were more than 90% GFP+ and predominantly of erythroid phenotype (Figure 1B). As others have previously reported,30 we did not detect any effect of GFP expression on erythroid development compared with mock-transduced cells.
Purification and analysis of AML1-ETO–transduced erythroid progenitors.
Representative density plots (dark shading indicates highest density) show the immunophenotypic status of AML1-ETO–transduced cultures. (A) Following retroviral transduction (day 3). (B) Immunophenotype on day 6 following enrichment of GFP+CD13− cells. Data in the right panels exclude myeloid (CD13+) cells. Quadrants delimit background fluorescence of control-stained/mock-transduced cells. Similar data were generated from control cultures expressing GFP alone (not shown). FSC indicates forward scatter. Note that the intensity of GFP expression increased in cells expressing AML1-ETO over days 3 to 6.
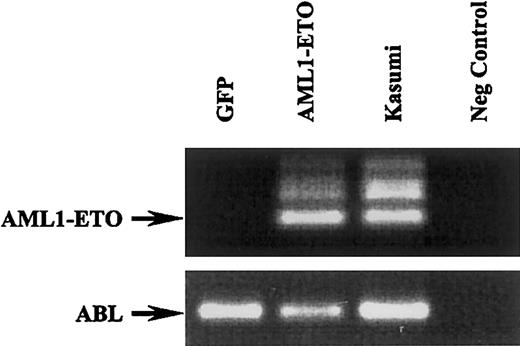
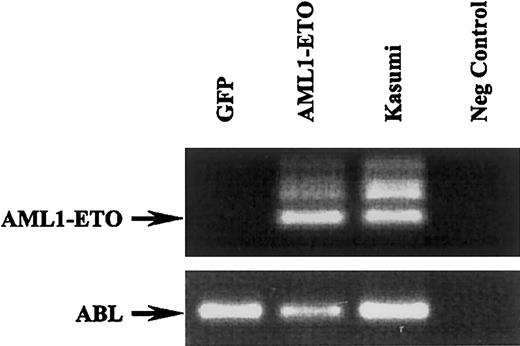
To confirm the expression of AML1-ETO in transduced human cord blood progenitor cells, we performed RT-PCR analysis. As shown in Figure 2, the AML1-ETO fragment was clearly detected in cells transduced with this fusion gene while absent in cells transduced with GFP alone. ABL amplification was used as an internal control and RNA from the Kasumi-1 cell line was used as a positive control for AML1-ETO detection.34
AML1-ETO expression in human cord blood progenitor cells transduced with retrovirus expressing GFP and AML1-ETO.
RT-PCR analysis of GFP- and AML1-ETO–transduced cells and corresponding RT-PCR of ABL (bottom blot). The Kasumi-1 cells were used a positive control and water as a negative control.
AML1-ETO expression in human cord blood progenitor cells transduced with retrovirus expressing GFP and AML1-ETO.
RT-PCR analysis of GFP- and AML1-ETO–transduced cells and corresponding RT-PCR of ABL (bottom blot). The Kasumi-1 cells were used a positive control and water as a negative control.
AML1-ETO suppresses erythroid colony formation
Having generated a purified population of retrovirally transduced primitive erythroid cells (predominantly GFP+CD34+CD13−) equivalent to a late erythroid burst-forming unit (BFU-E) population,35 we set out to determine the effects of AML1-ETO expression on erythropoiesis. First, we assessed the erythroid colony-forming capacity of these cells in the presence of IL-3, IL-6, SCF, and EPO. To facilitate subsequent analysis of these colonies, the assays were performed by limiting dilution in liquid medium in 96-well plates. After 14 days, individual colonies were harvested and double-labeled with antibodies to gly A and CD11b to distinguish any myeloid colonies. Under these conditions, expression of AML1-ETO significantly suppressed erythroid colony formation by 83% when compared with the control (Table 1); in each case more than 90% of colonies analyzed were gly A+CD11b−, confirming the identity of the sorted population. As part of the analysis we also estimated the number of cells constituting each colony (see “Materials and methods”). We found that expression of AML1-ETO resulted in a significant decrease in the average number of cells constituting each colony (Table 1). These data show that expression of the AML1-ETO gene grossly impairs erythroid colony formation.
Expression of AML1-ETO promotes amplification of early human erythroblasts
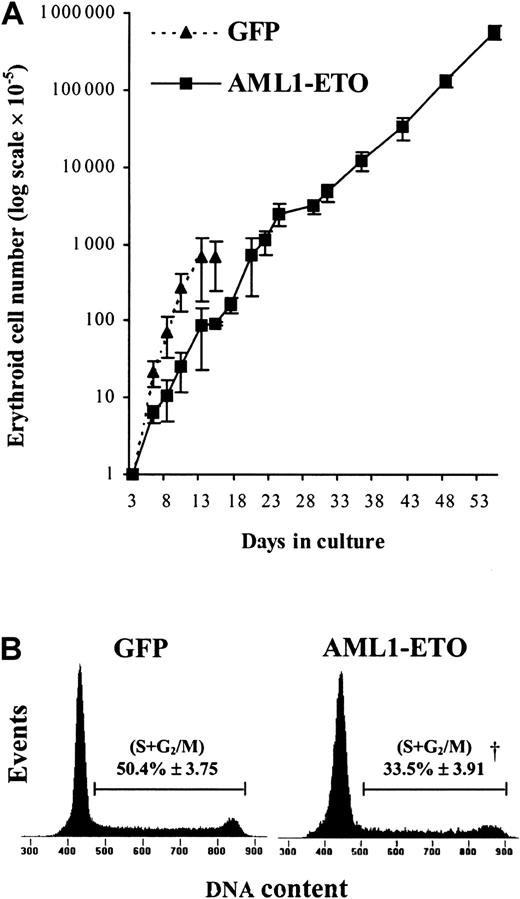
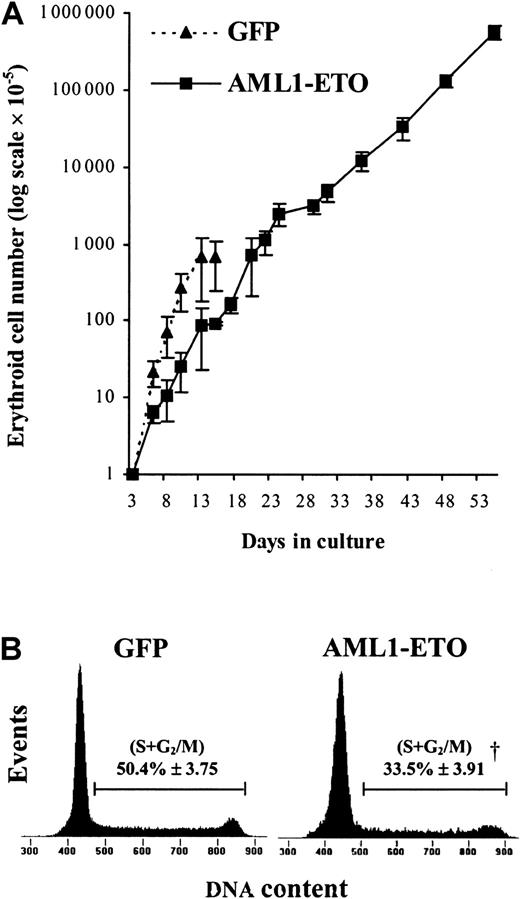
To establish in more detail the effect of AML1-ETO on human erythropoietic development, we introduced GFP+CD34+CD13− cells into bulk liquid culture. Erythropoiesis can be considered to occur in 2 distinct stages: early development, which occurs independently of the requirement of EPO,36 and late development, which depends on the presence of this cytokine. We therefore initially cultured these cells in the presence of IL-3, IL-6, and SCF but in the absence of EPO, which allowed us to study the effect of AML1-ETO on early erythropoiesis independently of its effect on late (EPO-dependent) development.35 Under these conditions, control cultures proliferated rapidly for 8 to 10 days, following which the cells became growth arrested at the EPO-dependent boundary. In contrast, we found that the pattern of growth of cells expressing AML1-ETO was profoundly altered. During the first few days of culture, the effect of AML1-ETO was to inhibit erythroid growth (Figure3A). The average population doubling time of control-transduced cells (GFP) over the first 3 days following retroviral transduction was approximately 18 hours, whereas the expression of AML1-ETO prolonged the doubling time to about 32 hours. To determine the basis of this increased doubling time, we analyzed the cell cycle distribution of these cultures. AML1-ETO–transduced cultures exhibited almost 30% reduction in the proportion of cells in cycle (S + G2/M) compared with controls, indicating an inhibition of the G1-to-S phase transition (Figure 3B). At this point, AML1-ETO expression had no significant effect on the proportion of cells with a sub-G1 DNA content, indicating that inhibition of proliferation did not arise as a consequence of an increase in the frequency of apoptosis. This analysis was supported by morphologic scoring where the number of cells expressing AML1-ETO undergoing apoptosis (2.4% ± 1.3%) was not significantly different from control cultures (3.6% ± 1.3%).
Relative expansion and cell cycle analysis of AML1-ETO–transduced erythroid progenitors cultured in IL-3, IL-6, and SCF.
(A) Expansion of CD13− cells during the EPO-independent phase of growth (see “Materials and methods”). Data indicate mean ± 1 SD (n = 4; where n represents the number of independent experiments). Error bars represent 1 SD. (B) Representative histograms (from 1 of 3 experiments) showing cell cycle distribution of AML1-ETO–expressing cells and equivalent controls after 6 days of culture. The percentage of cells in S + G2/M is indicated ± 1 SD. Significant difference of AML1-ETO from control cultures (GFP alone) is indicated by the dagger (P < .01).
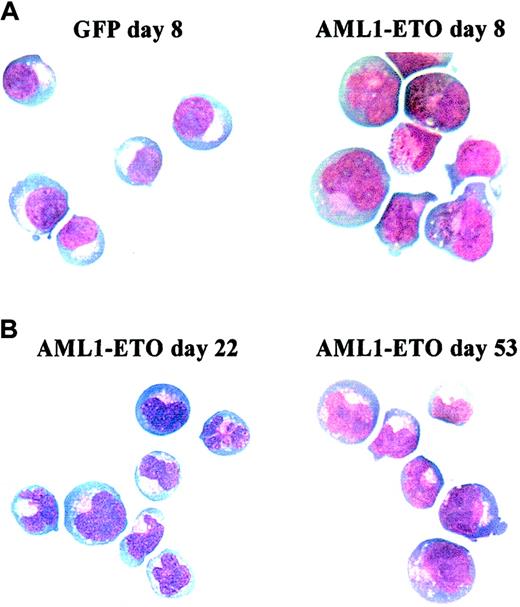
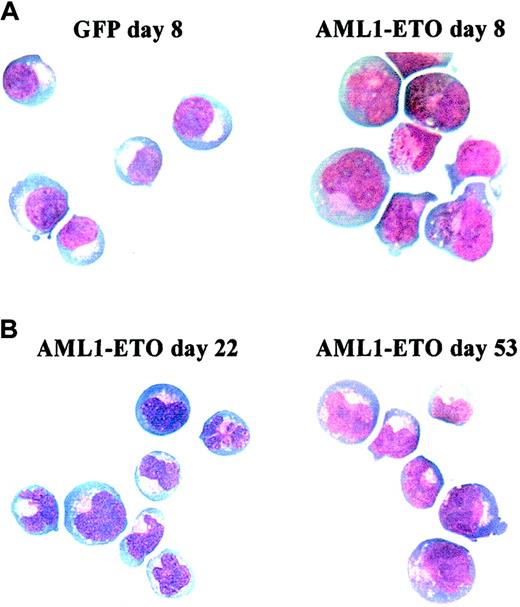
In control cultures, later stages of EPO-independent growth were characterized by a reduction in proliferative rate as the cells approached the EPO-dependent stage of development. By day 13, no further growth of erythroid cells was observed. In contrast, cells expressing AML1-ETO did not become growth arrested at day 13 (Figure3A). We observed that AML1-ETO promoted expansion of erythroid progenitors for many weeks, giving rise to a 1000-fold increase in the total number of erythroid cells compared with control cultures (Figure3A). Despite this continued expansion, cells expressing AML1-ETO retained the characteristic of poor erythroid colony-forming efficiency, which showed no change from when assayed on day 3 (Table 2). As expected, control cells showed a marked reduction in colony-forming capacity at day 10. The presence of EPO itself was not inhibitory to the growth of cells expressing AML1-ETO under colony-forming conditions because in the absence of this cytokine no colonies were formed. These cells also remained cytokine dependent both for survival and proliferation, a characteristic also observed by Okuda et al,21 in hematopoietic progenitor cells from fetal livers of AML1-ETO knock-in mice. Morphologically, these cells retained a basophilic cytoplasm with an area of increased translucence that is characteristic of erythroid precursors; however, the nuclei of these cells were abnormal, demonstrating marked lobulation (Figure4). Such disturbances of erythroblast nuclear morphology are, however, common in both acute leukemia and myelodysplasia.37 Phenotypically these cells were predominantly CD13−, CD33+, CD14−, and CD11b+/−.
Morphology of AML1-ETO–transduced cells cultured in IL-3, IL-6, and SCF.
Representative cytocentrifuge preparations stained with Wright-Giemsa. (A) Comparison of control (GFP, left) and AML1-ETO–transduced (right) cultures at day 8. (B) AML1-ETO–transduced cells at day 22 (left) and 53 (right). Original magnification × 400.
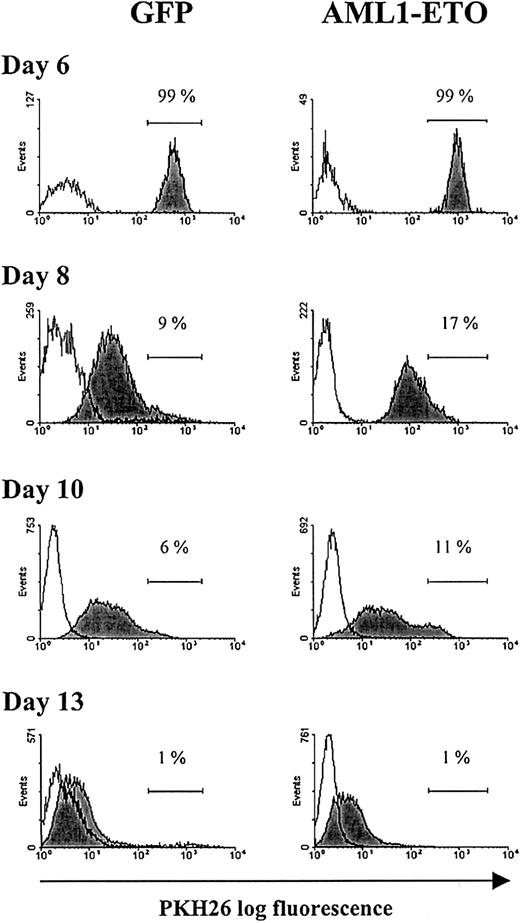
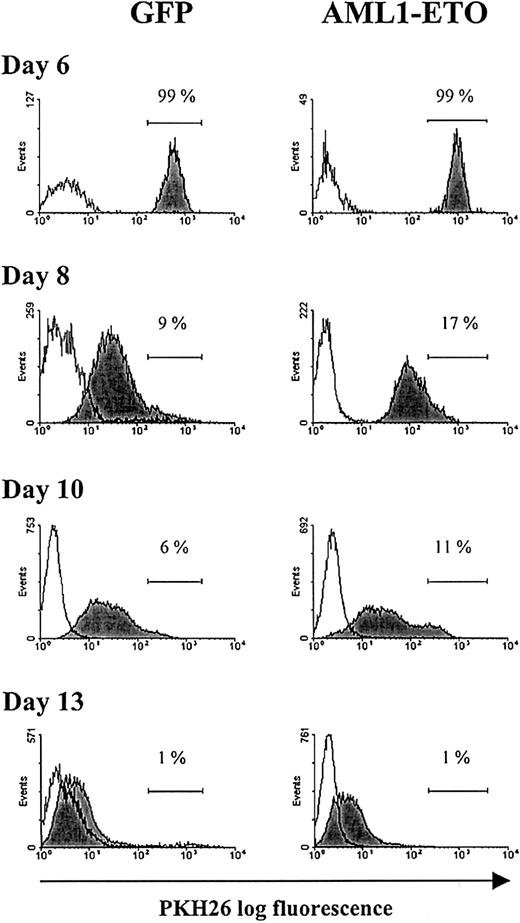
Having made these observations, we wished to establish whether this greatly extended proliferative capacity arose from a subpopulation of AML1-ETO–expressing cells that escaped the growth inhibitory effects of this oncogene, or whether all AML1-ETO–expressing cells responded in a similar manner. To distinguish these possibilities, we labeled day 6 cultures with the red fluorescent membrane dye, PKH26, which partitions in daughter cells after cell division. Differential proliferation of a subpopulation of cells would give rise to heterogeneity in the distribution of fluorescence intensity of the labeled population. Following labeling with this aliphatic dye, the cells became brightly fluorescent (Figure5) with no loss of viability or proliferative capability when compared with unlabeled cells (data not shown). During subsequent culture, cell aliquots were removed at the time intervals indicated and examined for PKH26 staining. During this period of culture, the fluorescence intensity of both control and AML1-ETO–transduced populations showed a relative decline, indicating that these cells were actively dividing. Because beyond day 6 the inhibition of cell cycle progression by AML1-ETO was greatly diminished, there was little difference in the relative decrease in fluorescence intensity between the 2 populations. At the end of a typical experiment (day 13), the majority of cells were PKH26dim, with no evidence of a population that were PKHbright, which would have indicated heterogeneity of proliferative potential within the culture (Figure 5). These data provide evidence that the continued proliferative expansion of AML1-ETO–expressing cells was the property of the majority of cells expressing this oncogene and not of a subpopulation that escaped the growth inhibition.
Flow cytometric analysis of erythroid bulk culture cells tracked with PKH26.
Day 6 cultures were labeled with the fluorescent membrane dye PKH26 (see “Materials and methods”). GFP+CD13−cells from control and AML1-ETO–transduced cultures were analyzed for PKH26 fluorescence at the time points indicated. Histograms (representative from 1 of 3 experiments) show the fluorescence intensity of PKH26-labeled cells (filled histograms) and the fluorescence intensity of equivalent unlabeled cells (open histograms). Placement of the marker region for each culture was adjusted with reference to day 6 of culture (PKH26 labeling day 0).
AML1-ETO expression disturbs early erythroid differentiation
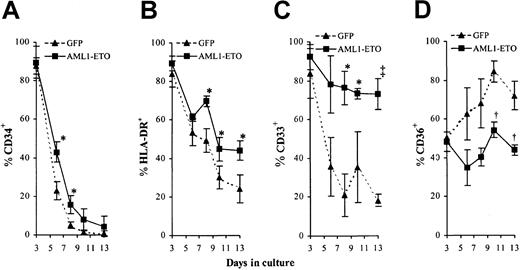
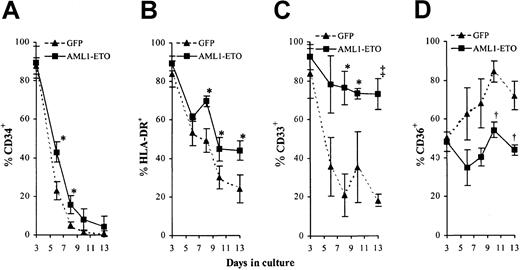
The above data indicated that AML1-ETO expression was able to promote the expansion of erythroid cells during the EPOindependent stage of development. We next examined whether expression of AML1-ETO also affected the early differentiation of these cells. By following changes in cell surface marker expression in these cultures by 4-color cytometric analysis, it is possible to monitor the differentiated status of these cells throughout early development. Normal EPO-independent development is characterized by loss of the cell surface markers CD34, HLA-DR, and subsequently CD33 and by concomitant up-regulation of CD36 (thrombospondin receptor).38-42 We found that in both control and AML1-ETO–transduced cultures, the expression of CD34 and HLA-DR declined as they underwent differentiation (Figure 6A-B). The loss of expression of these markers was slightly delayed in AML1-ETO–transduced cultures although this could be attributed to the reduced rate of proliferation as noted. Abnormalities in the pattern of CD33 and CD36 expression were more marked. In contrast to control cells, AML1-ETO–expressing cells retained CD33 expression throughout early development (Figure 6C). In the case of CD36, control cells showed a progressive up-regulation of this antigen, whereas cells expressing AML1-ETO showed no significant increase in expression (Figure 6D). Overall these data are consistent with a suppression of early differentiation or an increase in self-renewal imposed by AML1-ETO during early erythroid development.
Effect of AML1-ETO expression on EPO-independent differentiation.
(A-D) Immunophenotypic profile of GFP+CD13−cells labeled with antibodies to one other determinate as indicated. Data indicates mean ± 1 SD (n = 3). Significant difference of AML1-ETO from control cultures is indicated: *P < .05, †P < .01, and ‡P < .001. Error bars represent 1 SD.
Addition of EPO partly relieves the differentiation block imposed by AML1-ETO
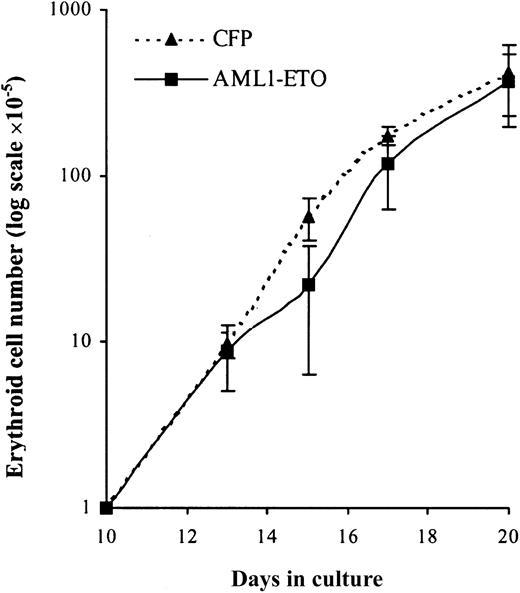
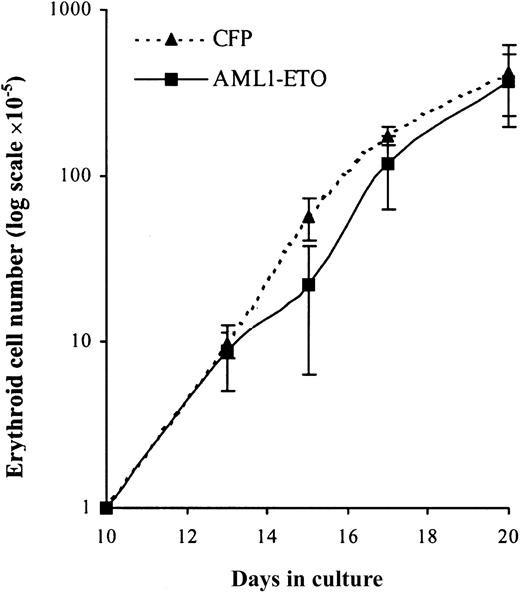
To establish whether these cells retained the capacity to complete their differentiation program we added EPO to day 10 cultures. Over the following 10 days in the presence of EPO, control cultures underwent a further 400-fold expansion after which no net increase in cell number was observed (Figure 7). Cultures expressing AML1-ETO responded to EPO in a similar manner with no evidence of a significant population of cells, which exhibited an extended proliferative capacity. Thus, despite the failure of these cells to proliferate under colony-forming conditions (Table 2), these cells displayed a normal proliferative response in bulk liquid culture. We then examined the differentiated phenotype of these cells over the course of the culture in terms of the up-regulation of gly A and reduction in cell size that accompanies erythroid maturation. In AML1-ETO–expressing cultures there was a similar reduction in cell size when compared with control cells (Figure8A). In addition, these cells demonstrated up-regulation of CD36 and gly A and rapid down-regulation of CD33 and HLA-DR in a similar manner to control cells (Figure 8B-E, respectively). However, morphologic analysis (Figure 8F) showed a significantly higher percentage of immature erythroblasts in day 17 AML1-ETO–expressing cultures. These results suggest that AML1-ETO–expressing cells underwent a differentiation response to EPO, although their full maturation may have been impaired.
EPO-dependent expansion of erythroid progenitors under the influence of AML1-ETO.
Expansion of GFP+CD13− cells cultured with IL-3, IL-6, SCF, and EPO. Data indicate mean ± 1 SD (n = 4). Error bars represent 1 SD.
EPO-dependent expansion of erythroid progenitors under the influence of AML1-ETO.
Expansion of GFP+CD13− cells cultured with IL-3, IL-6, SCF, and EPO. Data indicate mean ± 1 SD (n = 4). Error bars represent 1 SD.
Effect of AML1-ETO on EPO-dependent differentiation.
(A) Distribution of cell size (forward scatter) of GFP+CD13− cells. (B-E) Immunophenotypic profile of GFP+CD13− cells labeled with antibodies to one other determinate as indicated. (F) Differential counts of morphology after 7 days of culture in the presence of EPO. Cells were classified according to established criteria as follows: late (L; orthochromatic normoblasts/reticulocytes); intermediate (I; polychromatic normoblasts), and early (E; all preceding stages of development). Data indicate mean ± 1 SD (n = 3). Significant difference of AML1-ETO from control cultures (GFP) is indicated: *P < .05 and †P < .01. Error bars represent 1 SD.
The capacity of AML1-ETO–expressing cells to differentiate is reduced following extended culture in the absence of EPO
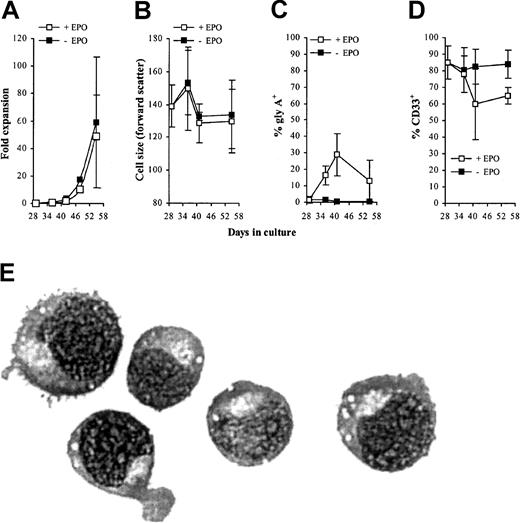
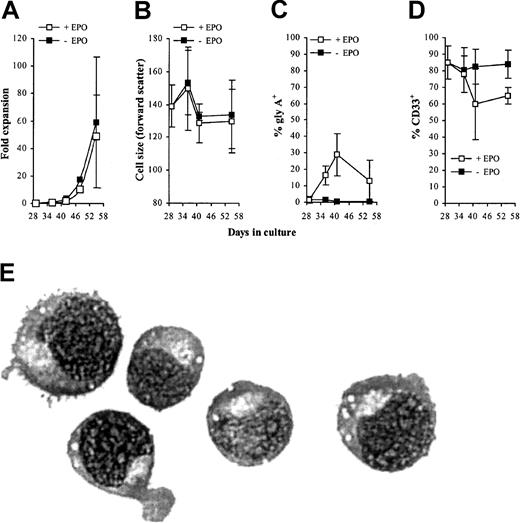
Because the addition of EPO to day 10 cultures was able to promote the differentiation of cells expressing AML1-ETO, we next addressed the question whether cells cultured for extended periods of time in the absence of EPO were also able to differentiate. We added EPO to AML1-ETO–expressing cells that had been cultured in the absence of this cytokine for 29 days and followed their proliferation and development over the following 3 weeks. EPO had no effect on the proliferation or morphology of the cells compared with cells expressing AML1-ETO that were cultured in the absence of this cytokine. Immunophenotypic analysis showed a variable but generally weak modulation of gly A and CD33 (Figure 9A-E). These data suggest extended culture of AML1-ETO–transduced cells gave rise to cells that were refractory to the differentiating influence of EPO.
Effect of EPO on differentiation of AML1-ETO–expressing cells cultured for 4 weeks in IL-3, IL-6, and SCF alone.
(A-D) Immunophenotypic profile of GFP+CD13−AML1-ETO–expressing cells labeled with antibodies to one other determinate as indicated. Data indicate mean ± 1 SD (n = 3). Error bars represent 1 SD. (E) Morphology of day 55 AML1-ETO–expressing cells cultured with EPO since day 29 (representative Wright-Giemsa staining of a cytocentrifuge preparation). Original magnification × 400.
Discussion
To investigate the effect of AML1-ETO expression on normal hematopoietic development, we have devised a model system based on the expression of this fusion gene in normal human cells. Here, we describe the consequences of AML1-ETO expression on erythroid development and demonstrate the capacity of this fusion gene to promote extensive self-renewal.
One of the most striking effects of AML1-ETO we observed was a gross inhibition of erythroid colony formation; the few colonies that did form were significantly smaller than control colonies, consistent with a negative effect of AML1-ETO on cell growth under these conditions. This represents the first report of the effect of AML1-ETO on erythroid colony formation of human cells and draws a contrast with transgenic models. Although AML1-ETO disrupts primitive hematopoiesis,21 there have been no reports of inhibition of colony formation when expressed in adult animals.27These data indicate that human cells may respond differently to mouse cells in this respect, although it has been shown that it is possible to block the differentiation of mouse erythroleukemia (MEL) cells by expression of AML1-ETO.43
Interestingly, our data also show that these cells performed differently when grown in bulk liquid culture; although an antiproliferative effect was also observed in early (EPO-independent) development, the inhibitory effect imposed by AML1-ETO was overcome by day 8 of culture, at which point the proliferation of these cells continued at a similar rate to controls. In light of this, it was surprising that the same cells did not eventually form colonies in vitro (at day 14). Although a matter for speculation, it is conceivable that the harsher conditions of clonal growth may have resulted in a block in proliferation or loss of viability thereby explaining the dramatic reduction in colony-forming efficiency. We examined the basis for the inhibition of growth from a number of perspectives. One possibility was that AML1-ETO expression promoted the apoptotic death of these cells during their development. However, we found no evidence to support this in terms of the frequency of morphologically apoptotic cells or the proportion of cells with a sub G1-DNA content. A second possibility was that AML1-ETO imposed a temporary inhibition of cell cycle progression. This was confirmed by analysis of cell cycle distribution, which indicated an inhibition of cell cycle progression at the G1 phase. These data are supported by a number of studies describing the effects of AML1-ETO on cell cycle progression. For example, in a tetracycline-inducible model, expression of AML1-ETO induced a block of proliferation in U937 cells.44 In addition, Amann et al45 demonstrated that expression of AML1-ETO resulted in an accumulation of MEL and 32D cells in the G1 phase of the cell cycle. Finally, in studies using a dominant-negative inducible AML1 protein, KRAB-AML1-ER, Lou et al46 observed an inhibition of cell cycle with a rapid reduction in endogenous CDK4 mRNA levels. In this latter study, overexpression of exogenous CDK4 overcame the inhibition of G1 progression. Despite the inhibitory effect on proliferation observed in early cultures, AML1-ETO expression promoted a massive amplification of early erythroblasts compared with control cells. Labeling of these cells with the “tracker dye” PKH26 suggested that the extended proliferative potential of these cells did not arise due to outgrowth of a subpopulation of cells. From our data, it would appear that expression of AML1-ETO was able to confer this property to the bulk of the transduced population.
As might be expected, the antiproliferative effect seen in the EPO-independent stage of growth was combined with developmental changes. This was observed both in the context of morphology and immunophenotype. During EPO-independent development, phenotypic analysis of AML1-ETO–expressing cells suggested that it stalled differentiation following loss of CD34 and HLA-DR but preceding loss of CD33 and up-regulation of CD36. Evidence indicates that transcription of the CD36 gene is dependent on binding of AML1 to its promoter,47 suggesting that the failure to up-regulate this antigen may be partly due to the dominant-negative effect of AML1-ETO on the transcriptional activity of AML1. Morphologic analysis demonstrated that even though these cells appeared to have primitive erythroid morphology, there were some nuclear abnormalities, which became more apparent as the culture progressed. These data suggest that as well as perturbing cell cycle progression AML1-ETO was able to interrupt normal developmental progress and thereby allow a massive amplification of this population. Interestingly, addition of EPO to these cultures was able to partially overcome this developmental suppression and allow near-normal maturation of these cells. However, AML1-ETO–expressing cells cultured for prolonged periods in the absence of this cytokine did not respond to EPO in terms of proliferation or differentiation, suggesting a developmental block had arisen. Our provisional data also indicate that this effect is specific to erythroid progenitors, because we have observed no comparable effects on granulocytic or monocytic development or on myeloid colony formation (A.T., unpublished data, February 2002).
Because it is known that erythroid cells from patients with AML M2 express AML1-ETO transcripts,48,49 it is pertinent to consider the possible consequences for such developmental disruption in vivo. In the bone marrow, it is thought that early erythroid progenitors form a reservoir of red cell potential and the availability of EPO (which is the major regulator of red cell production) controls the subsequent development of these cells.50 Therefore, it is conceivable that early erythroblasts expressing AML1-ETO may undergo extensive EPO-independent proliferation and contribute to bone marrow hyperplasia. We also observed that erythroblasts expressing AML1-ETO were markedly dysplastic. Interestingly, t(8;21)+ AML M2 is unusual in the high degree of dysplastic maturation observed and this includes the erythroid lineage.51,52 This feature is also characteristic of fetal liver cells cultured from AML1-ETO “knocked-in” mice21 and of preleukemia with t(8;21), which probably represents an early presentation of AML-M2.53 We should add that given the nature of the nuclear abnormalities we have observed, it is possible that erythroid-lineage dysplasia has to some extent been misclassified as granulocyte dysplasia. Together, the above observations strongly suggest that disrupted erythroid differentiation is associated with the pathogenesis of t(8;21) disease.
The proliferation of early progenitor cells without detectable changes in their differentiated status implies a capacity of AML1-ETO to promote self-renewal. This view supports Okuda et al,21 in which fetal liver cells from AML1-ETO knocked-in mice demonstrated dysplastic maturation and could be passed indefinitely in cultures, suggesting that AML1-ETO altered the balance of self-renewal and maturation of hematopoietic stem cells. Further evidence comes from Mulloy et al28 who, using a similar system to that described here, demonstrated that AML1-ETO expression in human CD34+ cells enhanced the self-renewal of stem cells in a cobblestone area–forming cell assay. Despite the capacity to promote self-renewal, expression of AML1-ETO alone appears to be insufficient for leukemic transformation. Induction of AML1-ETO expression in adult mice throughout their normal life span failed to give rise to leukemia,27 though these animals did display abnormal maturation and proliferation of progenitor cells. In a separate study, Yuan et al29 demonstrated that mice expressing AML1-ETO under the control of a myeloid-specific promoter from the humanMRP8 gene did not develop leukemia even when AML1-ETO–expressing cells were transplanted into syngeneic recipients. However, after treatment of these newborn mice with a strong DNA-alkylating mutagen,N-ethyl-N-nitrosourea, the majority of these mice developed leukemia. More recently, Higuchi et al26demonstrated in a mouse model that activation of a conditional AML1-ETO knock-in allele by cre-mediated recombination resulted in an enhanced replating efficiency of myeloid progenitors and that expression of AML1-ETO was not sufficient to induce leukemia. However, many features of AML were mimicked when cooperating mutations were induced in these mice.
The mechanism by which AML1-ETO may promote self-renewal may arise from deregulation of transcription in hematopoietic cells. Data increasingly suggest that AML1-ETO disturbs one or more of the transcription factors or partner proteins involved in hematopoietic development. AML1 interacts with a number of proteins such as p300/CBP, ets, and C/EBPα, all of which are known to cooperate with AML1 to activate transcription (for a review, see Perry et al54). Little is known about the consequences of AML1-ETO expression on transcriptional regulation in primary erythroid cells. However, it has been shown that conditional expression of AML1-ETO blocks the differentiation of MEL cells. This latter study found no effect on the known erythroid transcription factors, GATA-1 and EKLF, but correlated the failure of these cells to differentiate with the repression of expression of a transmembrane protein, Art-1.43
In summary, despite the ability of AML1-ETO to inhibit colony growth, in bulk liquid culture it was able to promote extensive self-renewal of erythroid progenitors. During the early stages of this amplification of progenitors, an almost normal differentiation response could be induced by the addition of EPO; however, after prolonged culture, these cells became refractory to this cytokine, indicating that either directly or indirectly, expression of AML1-ETO may also gave rise to a population that had lost the capacity to differentiate. These data provide a clear demonstration of the capacity of this fusion gene to promote self-renewal of progenitor cells and may provide a tractable model for determining the mechanism by which AML1-ETO influences self-renewal in normal human cells.
Prepublished online as Blood First Edition Paper, August 22, 2002; DOI 10.1182/blood-2002-06-1732.
Supported by the Leukaemia Research Fund of Great Britain.
The publication costs of this article were defrayed in part by page charge payment. Therefore, and solely to indicate this fact, this article is hereby marked “advertisement” in accordance with 18 U.S.C. section 1734.
References
Author notes
Alex Tonks, Department of Haematology, University of Wales College of Medicine, Cardiff, CF14 4XN, United Kingdom; e-mail: tonksa@cf.ac.uk.

