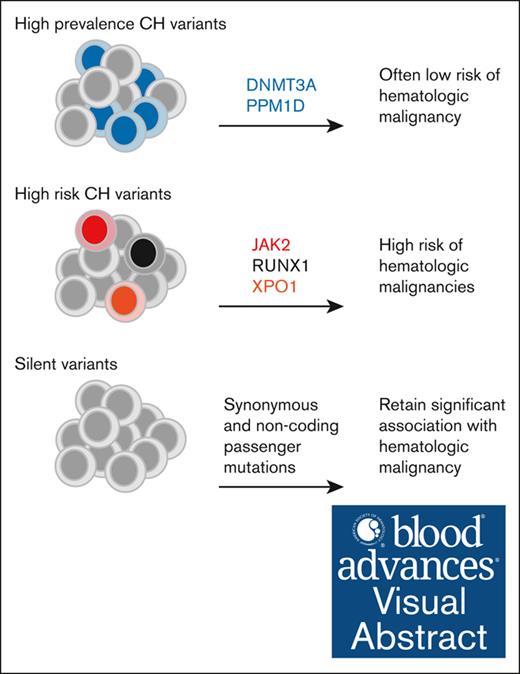
High-risk CH mutations in JAK2, RUNX1, and XPO1 anticipate hematologic malignancy in patients with cancer.
Functionally neutral silent CH variants are significant predictors of hematologic malignancy risk.
Visual Abstract
Clonal hematopoiesis (CH) identified by somatic gene variants with variant allele fraction (VAF) ≥ 2% is associated with an increased risk of hematologic malignancy. However, CH defined by a broader set of genotypes and lower VAFs is ubiquitous in older individuals. To improve our understanding of the relationship between CH genotype and risk of hematologic malignancy, we analyzed data from 42 714 patients who underwent blood sequencing as a normal comparator for nonhematologic tumor testing using a large cancer-related gene panel. We cataloged hematologic malignancies in this cohort using natural language processing and manual curation of medical records. We found that some CH genotypes including JAK2, RUNX1, and XPO1 variants were associated with high hematologic malignancy risk. Chronic disease was predicted better than acute disease suggesting the influence of length bias. To better understand the implications of hematopoietic clonality independent of mutational function, we evaluated a set of silent synonymous and noncoding mutations. We found that silent CH, particularly when multiple variants were present or VAF was high, was associated with increased risk of hematologic malignancy. We tracked expansion of CH mutations in 26 hematologic malignancies sequenced with the same platform. JAK2 and TP53 VAF consistently expanded at disease onset, whereas DNMT3A and silent CH VAFs mostly decreased. These data inform the clinical and biological interpretation of CH in the context of nonhematologic cancer.
Introduction
Clonal hematopoiesis (CH) is commonly defined as the presence of a somatic mutation in the blood or bone marrow with a variant allele frequency (VAF) of at least ∼2%.3-5 CH has been associated with hematologic malignancy risk in diverse cohorts despite methodologic variability, including mutations that are counted and the range of VAFs considered.6-12 Mutations in DNMT3A, TET2, and ASXL1 are highly prevalent across studies and have been validated as leukemia drivers in experimental models.13-15 The driver status of many other mutations has not been directly tested and must be inferred based on function in hematologic malignancy and/or enrichment of nonsynonymous mutations relative to synonymous mutations (dN/dS), suggesting active clonal selection.16
Analysis of population-based whole-exome and whole-genome sequencing studies has built the foundation of modern CH science.6-8 In these studies, CH calls are filtered to putative disease genes, and, often, higher VAF thresholds are used because of noise accompanying the large number of genes examined and limited sequencing depth. Unfortunately, the relatively limited benefit of identifying modest absolute increases in risk of malignancy has been a challenge to real-world use of CH information. Two recent analyses of UK Biobank data address this by focusing on a small number of high-risk CH genes and incorporating other hematologic parameters into risk models.17,18 These studies are a significant step forward in understanding the risk posed by CH in healthy individuals.
Most mutations in hematopoietic cells occur stochastically and are functionally neutral. Indeed, the mutational fingerprints of hematopoietic stem and progenitor cells has been used to construct elegant lineage hierarchies in extensively sequenced individuals.19-21 Sequencing error and pervasive age-related hematopoietic oligoclonality complicate use of apparently neutral genetic information. Some authors have addressed this through definition of CH with unknown drivers (CH-UD), which requires identification of multiple neutral variants at high VAF (>10%) in the whole-genome or whole-exome context.6,8 CH-UD correlates with subsequent hematologic malignancy and death, suggesting that CH can predict risk even in the absence of pathologic mutational function.
CH is an increasingly common discovery in patients with solid organ tumors because of the expanding use of sequencing-based diagnostics. The leukemic potential of CH has salience in this setting because these patients are often treated with genotoxic chemotherapy which also increases their risk of hematologic neoplasm.2,22,23 Conceptually, therapy-related hematologic neoplasms can be directly caused by drug-induced mutagenesis, because when a topoisomerase inhibitor induces chromosomal translocations, or indirectly caused by favoring expansion of preleukemic clones, for example those with TP53 loss. Work from our center and others has reported that CH poses an increased hematologic malignancy risk in this context.2,10,12 The extent to which this risk varies based on leukemogenic mechanism is unknown.
To better understand the association of CH genotype and hematologic malignancy, we expanded the Memorial Sloan Kettering (MSK)-IMPACT CH cohort to include 42 714 patients. We annotated this cohort using a hybrid manual or computational pipeline to comprehensively identify hematologic malignancy events. Combining these datasets allowed us to examine CH in the context of cancer at a more granular level than was previously possible. We report using this data to identify CH genotypes associated with risk of hematologic malignancy and evaluate the hematologic malignancies best predicted by CH.
Methods
Patient selection and record review
This study was approved by the MSK Cancer Center Institutional Review Board, and all patients provided informed consent for tumor and normal sequencing and review of their electronic medical record. We used a natural language processing pipeline (Clinical Event Detection and Recording System; https://cedars.io) to identify medical records potentially referencing hematopoietic disease. The identified EMR portions were manually curated by trained annotators (Vasta Global, New York, NY) to make initial diagnoses. Initial diagnoses were confirmed by at least 1 American Board of Internal Medicine–certified hematologist or oncologist to generate a set of final diagnoses.
Sequencing and data processing
The presence of CH was determined by peripheral-blood sequencing using the MSK-IMPACT platform (IMPACT).24 IMPACT is an oligonucleotide hybridization capture–based next-generation targeted sequencing assay developed for cancer genomic profiling. Matched normal blood samples were collected with consent from patients and evaluated for mutations across nearly all exons of between 341 and 505 genes depending on assay version (supplemental Table 1). Sequencing of matched normal blood samples was used for CH calling, as previously described.2,10 In brief, the Mutect and VarDict algorithms were used to call single-nucleotide variants, and insertions or deletions were called using VarDict and Somatic Indel Detector. Variants were retained if identified by 2 callers. Postprocessing filters were used to remove putative sequencing artifacts and germ line polymorphisms before data interpretation. Conventional CH variants were defined as nonsynonymous variants in exons and mutations with a predicted impact on splicing. Silent CH variants were synonymous variants in coding regions and nonsplice site noncoding variants. Mosaic chromosome alterations were identified using FACETS-CH, as previously described.25-27
Statistical analysis
Descriptive analyses and data visualization were performed in R version 4.1. The day of the blood draw procedure was considered day 0 in all analyses. Statistical models evaluating CH estimated subdistribution hazard ratio (HR) for the risk of hematologic malignancy with Fine and Gray competing risk regression using R package cmprsk. Death was included as a competing risk, and these models were adjusted for gender, solid cancer type, and age using a penalized spline. The analysis of gene-specific hazard rate was performed using cause-specific Cox regression with Firth penalized likelihood using R package coxphf. These models were adjusted for gender, solid cancer type, and age using a polynomial spline.
We used the R package dndscv to calculate the ratio of observed to expected nonsynonymous variants per synonymous variant in a regression model using both local and global mutation rates as covariates.16
Results
Clonal hematopoiesis in 42 714 patients with nonhematologic malignancies
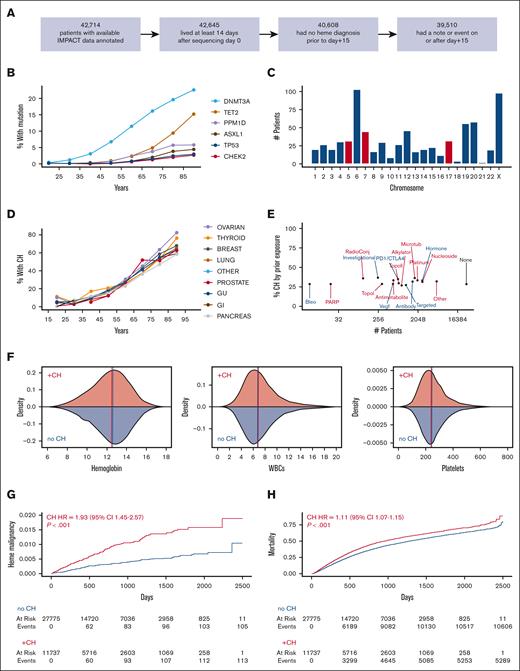
We assessed variants in at least 341 genes in MSK IMPACT sequencing for 42 714 patients, of whom 39 510 were alive with no hematologic diagnosis within 2 weeks and had medical record follow up beyond this time (Figure 1A). A total of 11 735 patients had at least 1 conventional CH variant in a cancer-related gene (29.7%), including 3871 with ≥2 variants (supplemental Figure 1). The most common CH mutations were in DNMT3A, TET2, and ASXL1 as well as genes related to DNA damage response, including PPM1D, CHEK2, and TP53 (Figure 1B). We also identified mosaic copy number changes in 675 patients (1.9%) out of 35 134 evaluable among the cohort (Figure 1C; supplemental Figure 2).
Clonal hematopoiesis in 42 714 patients with nonhematologic cancer assessed for CH. (A) Restriction of full cohort of 42 714 patients to those living at least 2 weeks, followed at least 2 weeks, and not yet diagnosed with a hematologic malignancy for at least 2 weeks after CH assessment. A total of 39 510 patients were evaluated in all subsequent analysis. (B) Prevalence of frequently mutated genes in CH based on age decile. (C) Distribution of mosaic chromosome alterations (MCAs) out of 35 134 evaluated patients using FACETS-CH. Alterations of chromosomes 5, 7, and 17 are highlighted in red because of their frequent association with high-risk therapy-related myeloid neoplasms. (D) The percentage of patients with CH stratified by primary solid cancer diagnosis per age decile. (E) Percentage of patients with CH among patients exposed to drugs with specified anticancer mechanisms before assessment. Many patients were exposed to >1 drug mechanism. Data are from institutional pharmacy administration records which do not include anticancer therapies prescribed by non-MSK oncologists. (F) Density plots showing distribution of basic hematologic indices. Hemoglobin is reported in grams per deciliter. WBCs (white blood cells) and platelets are reported as 109 cells per liter. Vertical lines represent the median of each distribution. (G-H) Cumulative incidence of (G) hematologic malignancy and (H) death in patients with and without CH. HRs and P values were calculated using a multivariate competing risk regression, adjusting for age, gender, and cancer type.
Clonal hematopoiesis in 42 714 patients with nonhematologic cancer assessed for CH. (A) Restriction of full cohort of 42 714 patients to those living at least 2 weeks, followed at least 2 weeks, and not yet diagnosed with a hematologic malignancy for at least 2 weeks after CH assessment. A total of 39 510 patients were evaluated in all subsequent analysis. (B) Prevalence of frequently mutated genes in CH based on age decile. (C) Distribution of mosaic chromosome alterations (MCAs) out of 35 134 evaluated patients using FACETS-CH. Alterations of chromosomes 5, 7, and 17 are highlighted in red because of their frequent association with high-risk therapy-related myeloid neoplasms. (D) The percentage of patients with CH stratified by primary solid cancer diagnosis per age decile. (E) Percentage of patients with CH among patients exposed to drugs with specified anticancer mechanisms before assessment. Many patients were exposed to >1 drug mechanism. Data are from institutional pharmacy administration records which do not include anticancer therapies prescribed by non-MSK oncologists. (F) Density plots showing distribution of basic hematologic indices. Hemoglobin is reported in grams per deciliter. WBCs (white blood cells) and platelets are reported as 109 cells per liter. Vertical lines represent the median of each distribution. (G-H) Cumulative incidence of (G) hematologic malignancy and (H) death in patients with and without CH. HRs and P values were calculated using a multivariate competing risk regression, adjusting for age, gender, and cancer type.
The fraction of patients with CH correlated strongly with age with little variation by cancer diagnosis (Figure 1D; supplemental Table 2). A total of 15 370 patients (38.9%) had received at least 1 anticancer therapeutic agent at MSK Cancer Center at the time of CH assessment. CH incidence was similar across patients exposed to different drug mechanisms (Figure 1E; supplemental Figure 3). Complete blood counts within 14 days of sequencing were available for most patients (33 114) (Figure 1F; supplemental Figure 4; supplemental Table 2). Of these, 7114 patients (21.4%) were anemic (hemoglobin level < 11 g/dL), 2956 (8.9%) were thrombocytopenic (platelet count <150×109/L), and 2847 (8.6%) were leukopenic (total white blood cell count < 4). The distribution of hematologic parameters was similar in patients with and without CH.
We identified 216 hematologic malignancy diagnoses in the cohort made ≥15 days after blood samples were collected for CH evaluation. High mortality within the cohort limited total follow-up time. Of the 39 510 patients in the cohort, only 8413 were observed beyond 3 years, and only 1831 were observed beyond 5 years. Nonetheless, CH was strongly associated with increased risk of hematologic malignancy (HR = 1.93; 95% confidence interval [CI], 1.45-2.57; P < .001; Figure 1G) and of death (HR, 1.11; 95% CI, 1.07-1.15; P ≤ .001; Figure 1H) in multivariate regressions modeling competing risk of the other outcome and adjusting for age, cancer diagnosis, and gender.
Identification of CH genotypes associated with high risk of hematologic malignancy
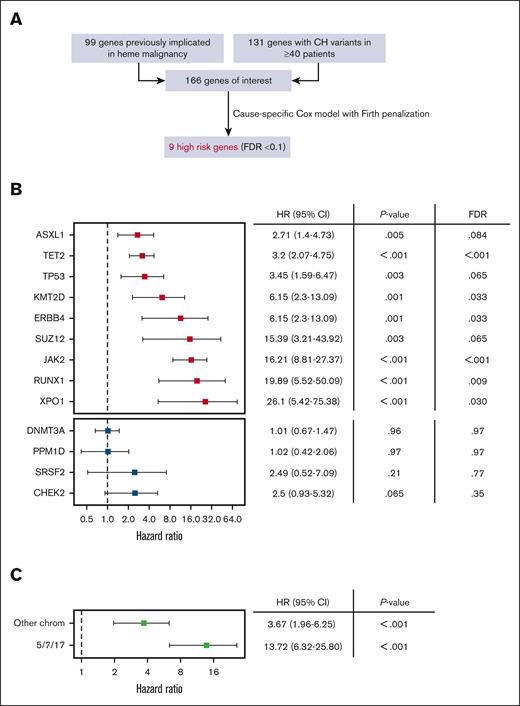
To identify the CH genotypes associated with highest risk of progression we considered CH variants implicated in prior studies (CH-PD2 and M-CHIP/L-CHIP28) and/or observed in at least 40 patients in this cohort (Figure 2A). We built cause-specific Cox proportional hazards models with Firth penalization and adjustment for age, cancer type, and gender for all 166 candidate genes. Nine genotypes were associated with a significantly increased rate of hematologic malignancy using a false discovery rate threshold of 0.1 (Figure 2B). Among these genes JAK2, RUNX1, and ASXL1 primarily preceded myeloid malignancies (20 out of 26 total cases), XPO1 and KMT2D exclusively preceded lymphoid malignancies (7 out of 7 total cases), and TP53 and TET2 preceded disease from both lineages relatively equally (17 total myeloid and 25 total lymphoid cases), consistent with what is known about the pathobiology associated with these variants.29-33 Mutations in SUZ12 and ERBB4 are less well described in the context of CH and warrant further study. Notably, DNMT3A and PPM1D were not associated with increased rate of hematologic malignancy despite being highly prevalent.
Identification of CH genes associated with high risk of hematologic malignancy. (A) We evaluated 166 genes representing the union of 99 genes previously implicated in hematologic malignancy (CH-PD, M-CHIP, and L-CHIP)10,28 and 131 genes mutated at least 40 times in our dataset (observed in ≥∼1 per 1000 individuals). We built cause-specific Cox hazard models with Firth penalized likelihood including adjustments for gender, age, and solid cancer type for all genes and identified 9 with significantly increased hazard rate of hematologic malignancy based on false discovery rate (FDR) < 0.1. (B) HR and 95% CI for high risk CH genes (red, top) and selected comparators that did not meet high risk criteria (blue, bottom). (C) MCAs were divided into an alarm group involving 5/7/17 and an “other” group that did not involve these chromosomes. HRs for MCAs were calculated using the same models described earlier.
Identification of CH genes associated with high risk of hematologic malignancy. (A) We evaluated 166 genes representing the union of 99 genes previously implicated in hematologic malignancy (CH-PD, M-CHIP, and L-CHIP)10,28 and 131 genes mutated at least 40 times in our dataset (observed in ≥∼1 per 1000 individuals). We built cause-specific Cox hazard models with Firth penalized likelihood including adjustments for gender, age, and solid cancer type for all genes and identified 9 with significantly increased hazard rate of hematologic malignancy based on false discovery rate (FDR) < 0.1. (B) HR and 95% CI for high risk CH genes (red, top) and selected comparators that did not meet high risk criteria (blue, bottom). (C) MCAs were divided into an alarm group involving 5/7/17 and an “other” group that did not involve these chromosomes. HRs for MCAs were calculated using the same models described earlier.
We, next, evaluated mosaic chromosome alterations using the same risk model to define their association with hematologic malignancy in this cohort (Figure 2C). We considered alterations of chromosomes 5, 7, and 17 (5/7/17) as a separate group because they are associated with poor prognoses in myeloid neoplasms and are recurrent events in therapy-related myeloid leukemia. Alterations in 5/7/17 were strongly associated with subsequent hematologic malignancies.
These findings nominate specific genomic features placing patients at particularly high risk of hematologic malignancy. Special attention should be paid to those with mutations in JAK2, RUNX1, and XPO1. Specific comutation combinations may also place patients at high risk of hematologic malignancy (supplemental Table 3), but larger data sets will be needed for statistical analyses of these sets. Mosaic chromosome alterations involving 5/7/17 are also associated with a high risk of hematologic malignancy and deserve attention similar to high-risk gene mutations.
Characteristics of hematologic malignancies predicted by CH
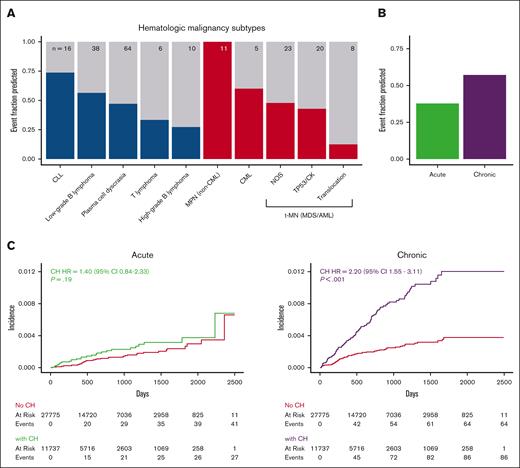
We, then, evaluated the ability of CH to detect hematologic malignancy disease subsets (Figure 3A). All 11 patients who developed an myeloproliferative neoplasm [MPN] (including myelodysplastic syndrome [MDS]/MPN overlap syndromes) had CH, including 9 of 11 with JAK2 V617F mutations. In contrast, most patients who went on to develop therapy-related myeloid neoplasms (high-risk MDS or acute myeloid leukemia [AML]) as well most of those who went on to develop high-grade B-cell lymphomas did not have CH at the time of assessment. Only 1 of 8 AML cases with an AML-defining chromosomal translocation had CH at assessment, suggesting translocation-driven, therapy-related leukemia may be unrelated to CH. CH was identified in approximately half of the number of patients who went on to develop either myeloid malignancies (36 of 70 patients) or lymphoid malignancies (70 of 133 patients; supplemental Figure 5). Although the HR for myeloid malignancy posed by CH (HR, 2.99; 95% CI, 1.82-4.91) trended higher than that for lymphoid malignancies (HR = 1.66; 95% CI, 1.17-2.36), the absolute risk of the myeloid malignancy trended lower.
The association of CH with hematologic malignancy varies according to the disease subtype. (A) Fraction of patients with CH among those who developed each of the hematologic malignancy types listed. We combined MDS and AML into a single therapy-related myeloid neoplasm (t-MN) group because therapy-related MDS behaves aggressively, and molecular characteristics better reflect pathogenesis and prognosis. Lymphoid malignancies are blue and myeloid are red. Total number of cases is presented at the top of each bar. (B) Fraction of patients who had preceding CH among those who developed chronic or acute hematologic malignancies. (C) Cumulative incidence of acute and chronic hematologic malignancies stratified based on the presence or absence of CH. All HRs and P values were calculated using a multivariate competing risk regression, adjusting for age, gender, and cancer type. CLL, chronic lymphocytic leukemia; CML, chronic myeloid leukemia; MPN, myeloproliferative neoplasm; NOS, not otherwise specified. TP53/CK: TP53 mutation and/or complex karyotype.
The association of CH with hematologic malignancy varies according to the disease subtype. (A) Fraction of patients with CH among those who developed each of the hematologic malignancy types listed. We combined MDS and AML into a single therapy-related myeloid neoplasm (t-MN) group because therapy-related MDS behaves aggressively, and molecular characteristics better reflect pathogenesis and prognosis. Lymphoid malignancies are blue and myeloid are red. Total number of cases is presented at the top of each bar. (B) Fraction of patients who had preceding CH among those who developed chronic or acute hematologic malignancies. (C) Cumulative incidence of acute and chronic hematologic malignancies stratified based on the presence or absence of CH. All HRs and P values were calculated using a multivariate competing risk regression, adjusting for age, gender, and cancer type. CLL, chronic lymphocytic leukemia; CML, chronic myeloid leukemia; MPN, myeloproliferative neoplasm; NOS, not otherwise specified. TP53/CK: TP53 mutation and/or complex karyotype.
To put these findings into context we considered that cancer screening tests contend with length bias which causes a skew in diagnosis toward disease that progresses more slowly.34-36 Similarly, the ability to use CH to detect a preclinical phase of hematologic disease is related to the length of time the disease is both detectable and preclinical. To evaluate chronicity in the context of CH, we divided hematologic malignancies into chronic diseases, including MPN, chronic myeloid leukemia, chronic lymphocytic leukemia, and low-grade B-cell lymphoma, and acute diseases, including MDS or AML presenting as a therapy-related myeloid neoplasm and high-grade B-cell lymphoma. CH occurred before 81 of 136 (59.6%) of chronic hematologic malignancies and 26 of 66 (39.4%) of acute malignancies (Figure 3B). Patients with CH had a significantly increased risk of chronic hematologic malignancies (HR = 3.3; 95% CI, 2.36-4.6; P < .001) but not acute hematologic malignancies (HR = 1.49; 95% CI, 0.93-2.39; P = .10; Figure 3C). These results suggest that length bias should be considered when the predictive use of CH is evaluated.
Relationship between clonal selection and risk of hematologic malignancy
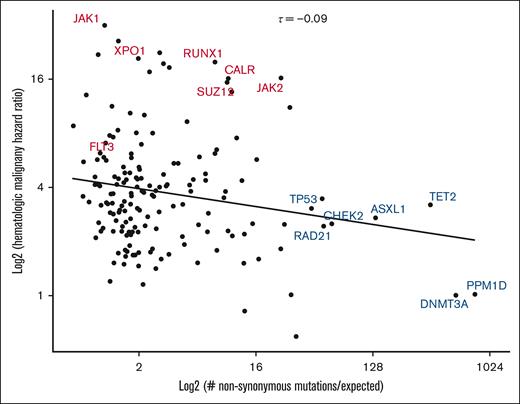
Somatic mutation acquisition in human tissues can be modeled as an evolutionary process driven by acquisition of mutations under positive selection.12 Using this perspective, the enrichment of dN/dS is a common manner in which driver mutations are defined.20,21,37,38 To understand selective forces in our cohort, we calculated genomic context-corrected dN/dS (dNdScv) and plotted HR for hematologic malignancy as a function of dNdScv (Figure 4). We observed a weak inverse correlation between the 2 parameters (Kendall τ = −0.09). Interestingly, variants with the strongest evidence for positive selection were primarily those with the highest prevalence of mutations across CH studies (DNMT3A, TET2, and ASXL1) and those involved in the DNA damage response (TP53 and CHEK2). Although mutations in some of these genes are associated with an increased risk of hematologic malignancy, this risk was lower than that imposed by mutations in RUNX1 and XPO1, which had much lower dNdScv valuations. These results argue that risk of hematologic malignancy is not reducible to the factors that make CH clones increase in size.
Relationship between nonsynonymous mutation enrichment and risk of hematologic malignancy. Gene-specific HRs for hematologic neoplasm (as calculated in Figure 2) are plotted as a function of context-corrected nonsynonymous mutation enrichment (dNdScv). High-risk CH genotypes identified in Figure 2 are labeled in red, whereas other selected genotypes are labeled in blue. Kendall τ statistic was used to quantify the relationship (centered, top). A linear trend line is displayed for visual reference.
Relationship between nonsynonymous mutation enrichment and risk of hematologic malignancy. Gene-specific HRs for hematologic neoplasm (as calculated in Figure 2) are plotted as a function of context-corrected nonsynonymous mutation enrichment (dNdScv). High-risk CH genotypes identified in Figure 2 are labeled in red, whereas other selected genotypes are labeled in blue. Kendall τ statistic was used to quantify the relationship (centered, top). A linear trend line is displayed for visual reference.
Association of silent CH with hematologic malignancy
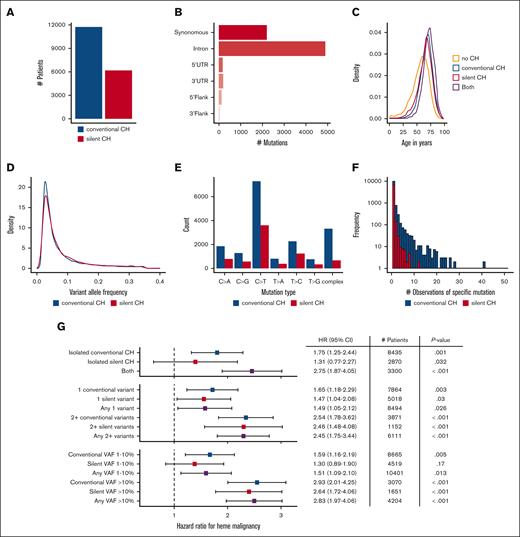
We, next, expanded our analyses to include all variants with the potential to provide information about clonal architecture. To this end we identified a set of “silent CH” variants combining synonymous mutations in protein-coding regions and nonsplice site mutations in noncoding regions (Figure 5A). The largest categories of silent CH variants in our data set were synonymous variants in coding regions (2247; 28.7%) and variants in introns (5021; 64.2%; Figure 5B). Silent CH was enriched in older patients, similar to conventional CH (Figure 5C). Additionally, the 2 groups had similar distributions of variant allele fractions (Figure 5D). Both conventional and silent CH were dominated by single nucleotide transversions with a similar distribution of nucleotide changes, with the major difference being that complex DNA changes were less common in silent CH (Figure 5E; Pearson r = 0.95 correlating number of mutations observed in 7 categories including the 6 types of single nucleotide changes and complex changes). Although any DNA mutation has potential to alter cellular fitness, we observed few recurrent silent CH mutations compared with conventional CH mutations (Figure 5F), arguing against widespread selective influence. Silent CH may, therefore, have the potential to reveal the impact of restricted clonal architecture separate from CH mutation function.
Silent CH and its associated hazards. (A) Comparison of number of patients with silent CH vs conventional CH. (B) Variant classes contributing to silent CH. (C) Age distribution of conventional and silent CH mutations. (D) Comparison of the VAF distributions of silent and conventional CH variants. (E) Number of specific single DNA base alterations in conventional and silent CH, and number of more complex alterations in each group. (F) Histogram showing number of observations of specific DNA variants in conventional and silent CH groups. (G) HR for hematologic malignancy in patients with conventional vs silent CH. Silent CH has minimal significance as an isolated finding at low VAF in a single gene but attains significance and expands the number of higher risk patients identifiable when it is present in combination with other mutations and/or when VAF is >0.1. HRs and P values were calculated using a multivariate competing risk regression, adjusting for age, gender, and cancer type.
Silent CH and its associated hazards. (A) Comparison of number of patients with silent CH vs conventional CH. (B) Variant classes contributing to silent CH. (C) Age distribution of conventional and silent CH mutations. (D) Comparison of the VAF distributions of silent and conventional CH variants. (E) Number of specific single DNA base alterations in conventional and silent CH, and number of more complex alterations in each group. (F) Histogram showing number of observations of specific DNA variants in conventional and silent CH groups. (G) HR for hematologic malignancy in patients with conventional vs silent CH. Silent CH has minimal significance as an isolated finding at low VAF in a single gene but attains significance and expands the number of higher risk patients identifiable when it is present in combination with other mutations and/or when VAF is >0.1. HRs and P values were calculated using a multivariate competing risk regression, adjusting for age, gender, and cancer type.
We measured the HR for hematologic malignancy in patients with silent CH (Figure 5G). When patients with isolated silent CH (who did not also have conventional CH) were considered in aggregate, risk of hematologic malignancy was not significantly increased. When patients with conventional and silent CH were identified nonexclusively, the risk of hematologic malignancy stratified either by VAF or mutation number was similar in each group. The number of patients at risk of hematologic malignancy because of the presence of multiple CH mutations increased significantly from 3871 to 6111 when silent CH mutations were considered along with conventional CH mutations, with minimal change in the HR (HR, 2.54; 95% CI, 1.78-3.62 in the former group and HR, 2.45; 95% CI, 1.75-3.44 in the latter group). Additionally, consideration of the union of patients with either CH type with at least 1 high VAF mutation expanded the pool of patients at elevated risk (3070 patients with a conventional CH VAF > 10% had HR, 2.93 [95% CI, 2.01-4.25], whereas the liberalized set of 4204 patients with either conventional or silent VAF > 10% had HR, 2.83 [95% CI, 1.97-4.06]). To confirm that the risks associated with silent CH are unlikely to be due to unannotated functional variants, we performed sensitivity analyses examining synonymous coding region variants and other variants separately. In age-adjusted models comparing the binary presence or absence of all silent CH, synonymous coding silent CH, and other silent CH HRs were similar (all silent CH: HR, 1.67; 95% CI, 1.23-2.27; synonymous coding HR, 1.70; 95% CI, 1.10-2.65; other silent variant HR, 1.48; 95% CI, 1.03-.211). In contrast to conventional CH, silent CH was not strongly associated with mortality in our cohort (supplemental Figure 6). Altogether, these findings show that that single silent nonprotein coding changes identified in gene panel sequencing have predictive significance.
Detection of CH mutations in subsequent hematologic malignancies
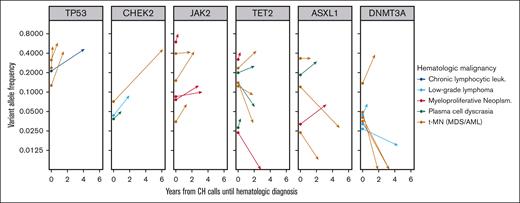
CH variants predating the diagnosis of a hematologic malignancy could be present in clones that are disease precursors or disease bystanders. In the former case, the observed VAF is likely to increase at the manifestation of clinical disease. We looked for evidence of clonal expansion in hematologic malignancy cases sequenced with MSK IMPACT that arose in patients in which at least 1 CH variant was identified. 84 variants in 26 cases were identified. Variants in 6 genes (ASXL1, CHEK2, DNMT3A, JAK2, TET2, and TP53) were observed at least three times. We visualized the clonal trajectory of each recurrent variant from CH assessment to disease (Figure 6). All six JAK2 variants and all four TP53 variants increased in size consistent with a disease-deterministic role of these variants. In contrast, only 2 of 7 DNMT3A variants had a higher VAF at disease diagnosis than at CH assessment arguing against a universal constitutional role in disease.
Clonal trajectories of CH mutations during the evolution of 26 subsequent hematologic malignancies. Six CH genes were present in at least 3 patients who subsequently developed a hematologic malignancy that was also sequenced using the MSK IMPACT platform. Vector origins at time zero show CH VAF in blood, and vector termini show VAF in the bone marrow at time of hematologic disease characterization.
Clonal trajectories of CH mutations during the evolution of 26 subsequent hematologic malignancies. Six CH genes were present in at least 3 patients who subsequently developed a hematologic malignancy that was also sequenced using the MSK IMPACT platform. Vector origins at time zero show CH VAF in blood, and vector termini show VAF in the bone marrow at time of hematologic disease characterization.
We next divided the full variant set based on disease category and conventional vs silent CH type (supplemental Figure 7). Of the half of all CH variants with VAF > 0.1, 27 of these 42 (64.3%) were larger at time of disease assessment, whereas only 14 of 42 (33.3%) expanded when CH VAF was less than 0.1. Additionally, a greater fraction of conventional CH mutations (33 of 60; 55%) expanded than silent CH mutations (8 of 24; 33%). However, silent variants with VAF > 0.1 expanded in 7 of 12 cases (58.3%), suggesting that large VAF may be the best predictor of future growth in many situations. Altogether these data suggest that the participation of specific CH genotypes in subsequent disease processes is variable. Higher risk CH mutations may be more likely to be true disease precursors, whereas lower-risk mutations more likely to be disease bystanders.
Discussion
We analyzed cancer-related gene sequences in the blood of patients with solid tumors to better understand the relationship between clonal hematopoiesis and hematologic malignancy in this population. We found that mutations in JAK2 were strongly associated with subsequent MPN, RUNX1 mutations with subsequent therapy-related myeloid neoplasms (MDS/AML), and XPO1 mutations with subsequent chronic lymphocytic leukemia. Despite disparate patient populations and detection methods, our findings are consistent with a recent study in healthy subjects similarly focusing attention on a smaller number of high-risk CH mutations.17
Importantly, we failed to observe strong associations between several canonical myeloid driver genes and hematologic malignancy. DNMT3A mutations were poor predictors of hematologic malignancy despite substantial statistical power. In contrast, failure to implicate FLT3 and NPM1 as being associated with a high risk of myeloid leukemia was likely because they are associated with rapid onset of disease making the time window during which they are detectable as CH short. Although rare, CH characterized by pathogenic mutations in these genes deserves close attention.
In our cohort, silent CH variants were associated with a modest but significant risk of hematologic malignancy. Most of these mutations are not expected to affect cellular fitness; thus, silent CH is likely a marker of something else that increases the risk of hematologic malignancy. Either of 2 likely scenarios could be responsible: (1) the neutral mutations are passengers associated with hematopoietic clones with a causal role in disease or (2) the detection of any CH indicates a state of low clonal diversity predisposed to foster other malignant clones.
Our study has important limitations. First, it was carried out exclusively in patients with nonhematologic cancer. Most patients received anticancer therapy, and many received traditional cytotoxic chemotherapy. The significance of our findings in people who do not have cancer is uncertain. Second, the median follow-up duration was limited, in large part because of nonhematologic cancer–related mortality. Therapy-related hematologic malignancies that progress over longer time scales were probably not well captured. We anticipate that as additional large-scale studies expand the genomic and clinical data available that we will learn that many factors contribute to clonal evolution and disease progression in addition to mutations in known CH-driver genes.
Acknowledgments
This work was supported by grants from the Edward P. Evans Foundation (A.J.S., X.W., and R.L.L.), the National Institutes of Health/National Cancer Institute P30-CA008748 (R.L.L.), K08-CA267058 (W.X.), T32-CA009207 (J.J.), and Cycle for Survival (P.S.V., W.X., and R.L.L.).
Authorship
Contribution: A.J.S., R.N.P., B.S., W.X., M.F.B., S.M., and R.L.L. designed the research; A.J.S., S.F.-E., R.N.P., S.Y.P., J.H.M., R.H.S., A.R.B., A.S.M., and S.M. generated data; A.J.S., K.M., and R.L.L. wrote the manuscript; A.J.S., S.M.D., S.F.-E., A.R.B., A.S.M., X.W., J.J., and P.S.-V. analyzed data; and all authors read and edited the manuscript.
Conflict-of-interest disclosure: A.J.S. (spouse is an employee of Bristol Myers Squibb). R.N.P. is an employee of C2i Genomics. S.F.E. is an employee of Tempus Labs. W.X. has received research support from Stemline Therapeutics. M.F.B. has received consulting fees from Eli Lilly and AstraZeneca. R.L.L. is on the supervisory board of Qiagen and is a scientific advisor to Imago, Mission Bio, Bakx, Zentalis, Ajax, Auron, Prelude, C4 Therapeutics, and Isoplexis; has received research support from AbbVie, Constellation, Ajax, Zentalis, and Prelude; has received research support from and consulted for Celgene and Roche; and has consulted for Syndax, Incyte, Janssen, Astellas, MorphoSys, and Novartis, and received honoraria from AstraZeneca, Novartis, Gilead and Novartis. S.M. has financial interests in a patent application relating to software described in this article (CEDARS: Clinical Event Detection and Recording System) and is principal owner of Daboia Consulting LLC. The remaining authors declare no competing financial interests.
The current affiliation for S.F.-E. is Tempus Labs, New York, NY.
The current affiliation for R.N.P is C2i genomics, New York, NY.
The current affiliation for B.S. is Hackensack University Medical Center, Hackensack, NJ.
Correspondence: Ross L. Levine, Rockefeller Research Labs, 430 E 67th St, 4th floor, New York, NY 10065; email: leviner@mskcc.org.
References
Author notes
A.J.S. and K.N.M. contributed equally to this work.
S.M. and R.L.L. contributed equally to this work.
Deidentified CH mutation calls sufficient to reproduce the key findings of our analysis are included in supplemental Data.
Conventional CH calls are publicly available at the cBioPortal for Cancer Genomics1 at https://www.cbioportal.org/study/summary?id=msk_ch_2023. The 47 532 patients in dataset “Cancer Therapy and Clonal Hematopoiesis (MSK, Blood Adv 2023)” include all cases from the manuscript as well as additional cases that were bioinformatically evaluated but not included in the manuscript due to our data cutoff date.
Analysis of a portion of this patient cohort was previously published.2
The full-text version of this article contains a data supplement.

