

Key Points
MRD detection with AML-specific PM markers predicts shorter relapse-free survival.
CombiFlow integrates expression data of multiple PM markers that allows longitudinal tracking of clonal evolution.

Abstract
Acute myeloid leukemia (AML) often presents as an oligoclonal disease whereby multiple genetically distinct subclones can coexist within patients. Differences in signaling and drug sensitivity of such subclones complicate treatment and warrant tools to identify them and track disease progression. We previously identified >50 AML-specific plasma membrane (PM) proteins, and 7 of these (CD82, CD97, FLT3, IL1RAP, TIM3, CD25, and CD123) were implemented in routine diagnostics in patients with AML (n = 256) and myelodysplastic syndrome (n = 33). We developed a pipeline termed CombiFlow in which expression data of multiple PM markers is merged, allowing a principal component–based analysis to identify distinctive marker expression profiles and to generate single-cell t-distributed stochastic neighbor embedding landscapes to longitudinally track clonal evolution. Positivity for one or more of the markers after 2 courses of intensive chemotherapy predicted a shorter relapse-free survival, supporting a role for these markers in measurable residual disease (MRD) detection. CombiFlow also allowed the tracking of clonal evolution in paired diagnosis and relapse samples. Extending the panel to 36 AML-specific markers further refined the CombiFlow pipeline. In conclusion, CombiFlow provides a valuable tool in the diagnosis, MRD detection, clonal tracking, and understanding of clonal heterogeneity in AML.
Introduction
Acute myeloid leukemia (AML) is a malignancy that remains difficult to cure. Relapse occurs in ∼50% to 70% of patients within 5 years after diagnosis1-3 as a result of therapy-resistant leukemic stem cell populations that are not eradicated by standard chemotherapy.4-6 Tools to identify such leukemic cells throughout various stages of leukemia progression, before, during, and after treatment are therefore urgently needed. During the last decade, diagnostics in AML have improved due to extensive molecular profiling using targeted next-generation sequencing, polymerase chain reaction, and determination of a leukemia-associated immune phenotype (LAIP) by flow cytometry.7 The antibody panels used are continuously evolving, and transcriptome and quantitative proteome studies by us and others have resulted in the identification of novel AML-specific plasma membrane (PM) proteins.8-12 Implementation of antibodies against these markers in current diagnostic pipelines might further refine diagnosis and disease monitoring during and after treatment.
Treatment of AML is significantly complicated by the strong heterogeneity of the disease. More than 200 mutations have been identified as playing a role in AML development, with typically 3 to 5 mutations coexisting in 1 patient with AML at diagnosis, resulting in patient-specific mutation spectra. AML often presents as an oligoclonal disease, with multiple genetically and functionally distinct subclones coexisting within individual patients.8,13-15 These subclones carry the same founder mutation(s), but the secondary driver mutation(s) may vary. We recently developed a technology based on differential plasma marker expression profiles through which genetically distinct subclones can be identified and prospectively isolated.8 These studies revealed that the specific combinations of founder and secondary driver mutations have a distinct impact on the transcriptomic and epigenetic landscapes8,16 and therefore most likely require different therapy. In addition, longitudinal genome sequencing studies have revealed that the clonal composition in a patient with AML is far from a static entity but changes over time, possibly as a consequence of treatment.14,15 The clonal and mutational complexity of the disease is currently overlooked in standard therapy.
Although the initial treatment (usually intensive chemotherapy or hypomethylating agents) may be effective, relapse often occurs because a relatively small but treatment-resistant subpopulation of leukemic cells remains undetected, survives, and causes relapse.17 The presence of small populations of persisting leukemic cells after treatment is called measurable residual disease (MRD) and is associated with a higher risk of relapse.18-20 Although monitoring of leukemia-associated immunophenotypes with flow cytometry7,21-23 and molecular monitoring of mutant NPM1 by quantitative polymerase chain reaction are clinically applied and validated methods to detect MRD, new markers and techniques (eg, digital droplet polymerase chain reaction) have been developed.3,24,25 An important time point to assess the MRD state is after 2 cycles of intensive treatment because MRD positivity at this time point is correlated with an increased risk of relapse.26 Early detection of a relapse-initiating clone may change treatment strategy (ie, tapering immune suppression after allogeneic hematopoietic cell transplantation) and improve outcome.
The main objectives of the current study were to assess the value of selected PM markers at diagnosis, during follow-up, and at relapse of disease to study heterogeneity in AML and to identify potential relapse-inducing cell populations at MRD time points. We therefore created a clinically applicable discovery tool to combine and visualize longitudinal, multi-parameter flow data.
Methods
Patient cohort
The patient cohort consisted of 289 patients diagnosed with de novo AML, secondary AML (sAML), therapy-related AML (tAML), or myelodysplastic syndrome (MDS) according to the 2016 World Health Organization criteria in the University Medical Center Groningen (UMCG) between 2014 and 2019 (supplemental Tables 1 and 2). Patient samples were studied after receipt of informed consent and protocol approval by the Medical Ethical Committee of the UMCG in accordance with the Declaration of Helsinki.
Flow cytometry analysis
Seven PM markers, all labeled with a phycoerythrin (PE) conjugate, have been implemented in routine diagnostics since 2014 and were measured via multi-parameter flow cytometry on a FACSCanto II flow cytometer (BD Biosciences). All antibodies used in this study are listed in supplemental Table 6. Normal bone marrow (NBM) samples were included as healthy control (n = 11). Raw flow data were analyzed in FlowJo v10 (Tree Star, Inc). The geometric mean (hereafter mean fluorescent intensity [MFI]) of each marker was obtained within the CD34+ or CD34–/CD117+ cell populations. Patients were considered to have increased expression (upregulation) for a marker if the MFI within the CD34+ cells was more than twofold elevated compared with the average MFI within the NBM CD34+ cells. For NPM1 mutant (NPM1cyt) patients, due to low CD34 expression, the MFI was determined within the CD34–/CD117+ cells. Gating strategies are outlined in supplemental Figure 1A.
Results
Aberrant expression of PM proteins predicts relapse in AML
Previously, we identified AML-specific PM expression profiles.8,9 Seven candidates (CD82, CD97, FLT3, IL1RAP, TIM3, CD123, and CD25) were selected and included in the UMCG routine diagnostics workflow as an addition to the current standardized antibody panel based on the EuroFlow protocol.7,21,23 The expression of these markers within the CD34+ cells was determined in 289 patients diagnosed with de novo AML, MDS, sAML, or tAML, and compared with NBM CD34+ cells (n = 11) (supplemental Table 1). Although all seven PM markers were upregulated in a large proportion of patients with AML, clear heterogeneity was observed in their expression between individual patients as well, in line with previous findings and with the strong genetic heterogeneity seen in patients with AML (Figure 1A-B; supplemental Figure 1A).8 Average expression was significantly increased for IL1RAP, CD97, CD25, and CD123 in AML and tAML compared with NBM, with the strongest difference for IL1RAP and CD97. An upregulation of marker expression in sAML compared with NBM was seen for IL1RAP and CD97. IL1RAP, CD25, TIM3, and CD33 were significantly upregulated in MDS compared with NBM. We also plotted data for CD33, which is included in routine diagnostic panels for AML and is a clinically actionable target by gemtuzumab ozogamicin.27-29 Increased CD33 expression was found in ∼30% of patients with AML and was significantly increased in MDS compared with NBM. In NPM1 wild-type (NPM1wt) patients, CD33 expression varied within CD34+ and CD34+/CD38– compartments, whereas it was consistently highly expressed in the CD34–/CD117+ population of NPM1cyt patients, in line with previous studies (supplemental Figure 2).30,31

PM marker positivity can be used to track disease progression and refine diagnostics. (A) PM marker expression (MFI) in de novo AML, MDS, sAML, and tAML (n = 289) vs NBM controls (n = 11). CD33 expression was determined in 50 cases (NBM, n = 11; AML, n = 50). Significant differences compared with NBM are indicated: *P < .05, **P < .01, ***P < .001. (B) Upregulation of PM markers in the AML cohort compared with NBM. Colors indicate a more than twofold increase in MFI compared with NBM (red), similar MFI compared with NBM (white), and not determined (gray). Percentages indicate the amount of patients that had increased expression of the marker at diagnosis (n = 256). (C and D) Disease progression of Patient 1 and Patient 2 portraying blast percentage and marker expression within CD34+ cells from diagnosis to treatment. Red indicates marker positivity. EuroFlow MRD was negative post–cycle 2 (EF MRD–) based on EuroFlow criteria.
PM marker positivity can be used to track disease progression and refine diagnostics. (A) PM marker expression (MFI) in de novo AML, MDS, sAML, and tAML (n = 289) vs NBM controls (n = 11). CD33 expression was determined in 50 cases (NBM, n = 11; AML, n = 50). Significant differences compared with NBM are indicated: *P < .05, **P < .01, ***P < .001. (B) Upregulation of PM markers in the AML cohort compared with NBM. Colors indicate a more than twofold increase in MFI compared with NBM (red), similar MFI compared with NBM (white), and not determined (gray). Percentages indicate the amount of patients that had increased expression of the marker at diagnosis (n = 256). (C and D) Disease progression of Patient 1 and Patient 2 portraying blast percentage and marker expression within CD34+ cells from diagnosis to treatment. Red indicates marker positivity. EuroFlow MRD was negative post–cycle 2 (EF MRD–) based on EuroFlow criteria.
For further analysis, patients with de novo AML, sAML, and tAML were combined into one cohort, hereafter referred to as the AML cohort (supplemental Table 2). Increased expression of the seven PM markers within the AML cohort significantly correlated to various disease characteristics (supplemental Figure 1B). Survival analysis based on the 3 European Leukemia Net (ELN) 2017 risk groups segregated the patient cohorts as expected (supplemental Figure 1C). Positive expression of PM markers at diagnosis was only predictive for overall survival for CD82 (hazard ratio, 0.52; 95% confidence interval, 0.31-0.86) (supplemental Figure 1D). Hierarchical clustering of Pearson correlation coefficients of PM markers formed 2 main clusters (supplemental Figure 1E). FLT3, IL1RAP, CD97, and TIM3 were frequently coexpressed, whereas CD123 and CD25 formed an independent second cluster. CD82 expression was not significantly linked to other PM markers.
For 72 patients within the AML cohort (n = 256), longitudinal expression data of five PM markers (CD82, CD97, FLT3, IL1RAP, and TIM3) could be collected. This set was limited by the fact that in many cases only a limited amount of material was available, and in such cases, EuroFlow markers were prioritized over the panel of our novel personalized markers. Still, this allowed us to evaluate whether our PM markers could define MRD and predict relapse of disease. In the UMCG, the presence of peri- and postremission treatment MRD is based on residual molecular status and/or immunophenotypic expression of the standardized antibody panel of the EuroFlow protocol.26 To assess whether the 5 selected PM markers could contribute to MRD detection, expression levels were determined in bone marrow assessments at diagnosis and after the second cycle of intensive chemotherapy, or prior to conditioning for allogeneic hematopoietic cell transplantation for patients treated with decitabine. A patient was considered PM marker positive (PM+) (n = 29) if one or more markers showed increased expression both at diagnosis and after treatment compared with average expression in NBM controls (n = 11). The remaining patients were considered PM marker negative (PM–) (n = 43). Two representative patient examples, Patient 1 and Patient 2, are shown in Figure 1C and D. Both examples were considered MRD-negative post–cycle 2 according to the current criteria determined within the EuroFlow protocol. Despite this, Patient 1 showed positivity for IL1RAP at the MRD time point after treatment, which correlated with relapse of the IL1RAP+ clone (Figure 1C). In Patient 2, no positivity for IL1RAP or TIM3 was observed after treatment, and the patient remained in complete remission (Figure 1D). We calculated event-free survival (EFS), the event being relapse or death, and overall survival. Strikingly, the EFS in the PM+ group was 58.8% compared with 72.9% within the PM– group (P = .02) (Figure 2A). PM marker status retained its independent prognostic power in a multivariate model (hazard ratio, 5.004; 95% CI, 1.663-15.06; P = .004), in which age, transplantation status, and ELN risk group were also independent predictors (Figure 2B). We also observed a trend toward poorer overall survival in the PM+ group, although this finding did not reach significance (P = .18) (supplemental Figure 3A). Comparison with the EuroFlow-based immunophenotypic MRD status post–cycle 2 showed that the addition of the PM markers improved relapse prediction (Figure 2C; supplemental Table 3).
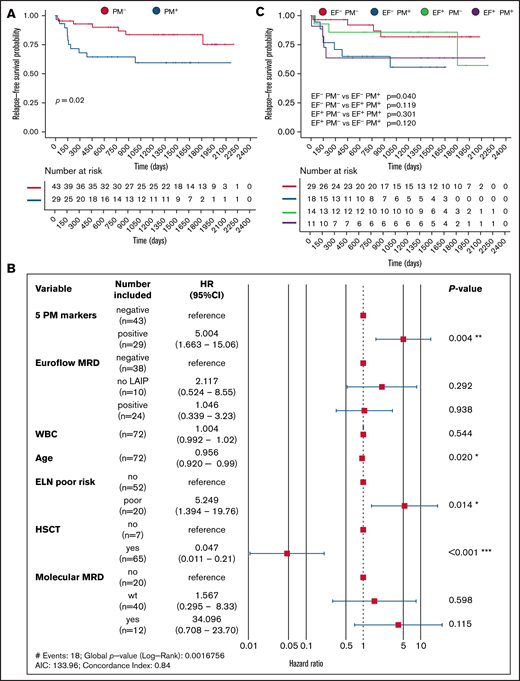
Aberrant PM marker expression in AML post–cycle 2 predicts risk of relapse. (A) Relapse-free survival of patients positive (PM+, red) or negative (PM–, blue) for one or more PM markers at diagnosis and at the MRD measurement (n = 72). (B) Multivariate risk analysis. No LAIP indicates that an LAIP could not be determined at diagnosis. Molecular MRD is defined as presence of NPM1cyt or FLT3-ITD; patients that were wild type for these mutations at diagnosis were not included. A P value based on a Wald test of P < .05 was considered significant. (C) Relapse-free survival of EF– PM–, EF+ PM–, EF– PM+, and EF+ PM+ patients. EF, EuroFlow; CI, confidence interval; HR, hazard ratio; HSCT, hematopoietic stem cell transplantation; WBC, white blood cell.
Aberrant PM marker expression in AML post–cycle 2 predicts risk of relapse. (A) Relapse-free survival of patients positive (PM+, red) or negative (PM–, blue) for one or more PM markers at diagnosis and at the MRD measurement (n = 72). (B) Multivariate risk analysis. No LAIP indicates that an LAIP could not be determined at diagnosis. Molecular MRD is defined as presence of NPM1cyt or FLT3-ITD; patients that were wild type for these mutations at diagnosis were not included. A P value based on a Wald test of P < .05 was considered significant. (C) Relapse-free survival of EF– PM–, EF+ PM–, EF– PM+, and EF+ PM+ patients. EF, EuroFlow; CI, confidence interval; HR, hazard ratio; HSCT, hematopoietic stem cell transplantation; WBC, white blood cell.
CombiFlow: combinatorial AML-specific PM expression profiles allow longitudinal tracking of clones
For a direct visualization and interpretation of heterogeneous cell populations between and within AMLs, we developed a pipeline that we termed CombiFlow (Figure 3). The pipeline relies on flow cytometry analyses whereby a shared backbone of a defined set of markers/parameters (forward scatter area, side scatter area, CD34, CD117, CD45, and HLA-DR in this case) is determined in each sample. In addition to this backbone, an antibody is added to detect expression of one specific PM marker per tube. A combinatorial expression profile can then be generated by merging all data in Infinicyt (Cytognos, S.L.), making use of the shared backbone present in all measurements (Figure 3A-B); further experimental details are provided in the supplementary Methods. Thus, an expression profile can be generated in which expression of all markers is inferred in all individual cells (Figure 3B). Principal component analysis (PCA) can be used for identification of the most discriminating PM proteins that mark subpopulations within 1 patient sample. The merged data can then be analyzed in a pipeline adapted from a CyTOF workflow.32 It makes use of FlowSOM, which clusters flow cytometry data in self-organizing maps, and distinct clusters are visualized by t-distributed stochastic neighbor embedding (tSNE) (Figure 3C).33 By combining data from healthy individuals and patients with AML, or by combining longitudinal measurements of individual patients, trajectories of clonal evolution can be visualized, and the strongest contributing PM markers to subpopulations can be identified (Figure 3D).

CombiFlow: combinatorial AML-specific PM expression profiles allow longitudinal tracking of clones. (A) Overview of the collected flow data over time. The shared backbone is always included. For the 5 markers and the EuroFlow markers, the composition differs from patient to patient. (B) Infinicyt-based merging of flow data by expression of the backbone markers that are included in every tube. Viable, single cells were gated and used as input data. In the merged file, markers measured in separate tubes can be plotted against one another. A PCA based on marker expression can identify genetically distinct subclones. (C) Expression data from the merged file is used to cluster cells by using the FlowSOM algorithm. Normalized expression per cluster is obtained, and created clusters are visualized in a tSNE landscape. (D) Clusters are assigned to a condition (diagnosis, relapse, or healthy), and the total tSNE landscape is separated by sample. Normalized expression of all clusters grouped by condition is obtained. FSC-A, forward scatter area; FSC-H, forward scatter height; SSC-A, side scatter area.
CombiFlow: combinatorial AML-specific PM expression profiles allow longitudinal tracking of clones. (A) Overview of the collected flow data over time. The shared backbone is always included. For the 5 markers and the EuroFlow markers, the composition differs from patient to patient. (B) Infinicyt-based merging of flow data by expression of the backbone markers that are included in every tube. Viable, single cells were gated and used as input data. In the merged file, markers measured in separate tubes can be plotted against one another. A PCA based on marker expression can identify genetically distinct subclones. (C) Expression data from the merged file is used to cluster cells by using the FlowSOM algorithm. Normalized expression per cluster is obtained, and created clusters are visualized in a tSNE landscape. (D) Clusters are assigned to a condition (diagnosis, relapse, or healthy), and the total tSNE landscape is separated by sample. Normalized expression of all clusters grouped by condition is obtained. FSC-A, forward scatter area; FSC-H, forward scatter height; SSC-A, side scatter area.
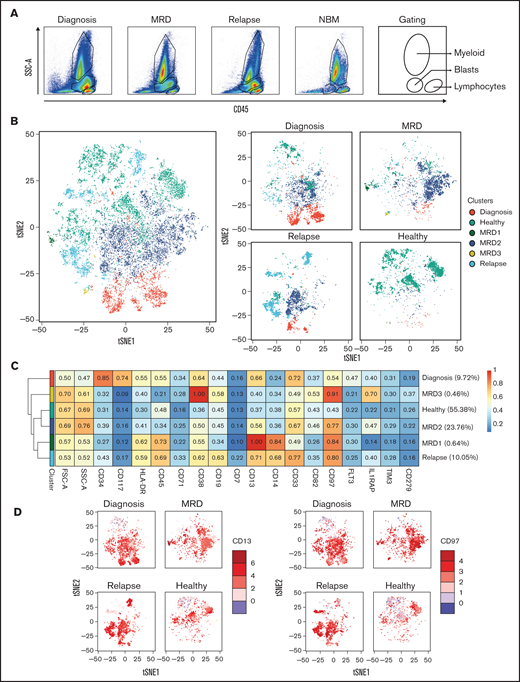
Representative examples of Patient 1 and Patient 3 are shown in Figures 4 and 5, respectively. Detailed clinical information is provided in supplemental Table 4. Longitudinal flow data were collected at diagnosis, after treatment, and at relapse. Different cell compartments were determined on the basis of side scatter area and CD45 expression (Figure 4A). We focused on aberrant PM marker expression profiles within the CD45+ cells. A tSNE landscape was generated by using merged flow cytometry data of the AML patient per time point, which was combined with 3 NBM controls (Figure 4B, left). Equal cell numbers were included per sample. CD45+ cells were used to also be able to observe potential differences in more differentiated myeloid or lymphocytic compartments. Clusters were assigned to subpopulations, an example of which is shown in supplemental Figure 4. For Patient 1, to best distinguish the healthy, diagnosis, MRD, and relapsed populations, a minimum of 8 clusters was necessary (Figure 4B, right). Diagnosis and relapse populations overlapped considerably and were distinct from healthy cells. At the moment of MRD measurement, the clinical data indicated that the patient had reached complete remission. Although the majority of cell populations overlapped with healthy cell populations, 5 aberrant cell populations (MRD1-5) could be identified with subclone-specific PM protein expression profiles (Figure 4C). The diagnosis and relapse samples were positive for CD34, IL1RAP, HLA-DR, CD38, and CD13. A similar expression pattern was seen in MRD cluster 3. We propose that MRD cluster 3 and possibly MRD cluster 1 (CD34+ IL1RAP+) are the most likely cause of relapse. MRD cluster 4 was positive for CD38 and CD19, most likely representing an emerging healthy pre–B cell progenitor population (Figure 4C-D). MRD cluster 2 expressed CD34 and HLA-DR but not maturation markers such as CD38 or myeloid markers such as CD33. Together, these observations nicely illustrate how both leukemic and healthy cell populations emerge or persist over time during the treatment.

Identification of potential relapse-inducing populations at MRD in a patient with AML. (A) Gating of the main compartments according to CD45 expression and side scatter area (SSC-A) for the merged FCS files from Patient 1. CD45– cells are gated out. (B) tSNE landscape colored by condition for all included samples (left) or per sample (right). (C) Expression of included markers per condition with the MRD-specific clusters separated to identify the subpopulation most likely to have caused relapse. (D) Expression of CD34, IL1RAP, and CD19 on the tSNE landscape per sample. FSC-A, forward scatter area.
Identification of potential relapse-inducing populations at MRD in a patient with AML. (A) Gating of the main compartments according to CD45 expression and side scatter area (SSC-A) for the merged FCS files from Patient 1. CD45– cells are gated out. (B) tSNE landscape colored by condition for all included samples (left) or per sample (right). (C) Expression of included markers per condition with the MRD-specific clusters separated to identify the subpopulation most likely to have caused relapse. (D) Expression of CD34, IL1RAP, and CD19 on the tSNE landscape per sample. FSC-A, forward scatter area.
Analysis of disease progression according to longitudinal CombiFlow analysis. (A) Gating of the main compartments according to CD45 expression and side scatter area (SSC-A) for the merged FCS files from Patient 3. CD45– cells are gated out. (B) tSNE landscape colored by condition for all included samples (left) or per sample (right). (C) Expression of included markers per condition with the MRD-specific clusters separated to identify the subpopulation most likely to have caused relapse. (D) Expression of CD13 and CD97 on the tSNE landscape per sample. FSC-A, forward scatter area.
Analysis of disease progression according to longitudinal CombiFlow analysis. (A) Gating of the main compartments according to CD45 expression and side scatter area (SSC-A) for the merged FCS files from Patient 3. CD45– cells are gated out. (B) tSNE landscape colored by condition for all included samples (left) or per sample (right). (C) Expression of included markers per condition with the MRD-specific clusters separated to identify the subpopulation most likely to have caused relapse. (D) Expression of CD13 and CD97 on the tSNE landscape per sample. FSC-A, forward scatter area.
A second example shown in Figure 5 depicts Patient 3, who did not reach complete remission as indicated by the blast population still clearly present at the MRD time point (Figure 5A). Only a few healthy cells were detected at the MRD measurement, and the dominant MRD cluster 2 was also present at diagnosis and relapse. This population was strongly positive for CD97 and CD13, which were also detected in the small MRD cluster 1 (Figure 5C-D). Another MRD-specific cluster, MRD cluster 3, was also positive for CD97, coexpressed IL1RAP, was low in CD13 but high in CD38. At relapse, the bone marrow was composed of a heterogeneous mixture of clones, some that were already observed at diagnosis (MRD clusters 1 and 2), and the clone that was dominant at relapse but present at diagnosis as a minor subclone (relapse clone) (Figure 5B, light blue).
Toward the best scoring MRD markers
For 18 patients, all treated with standard intensive chemotherapy, flow data at diagnosis, after treatment, and at relapse (8 of 18) or the latest CR time point (10 of 18) were obtained. Detailed clinical information is provided in supplemental Table 5. To determine the best discriminating markers for the diagnosis, MRD, relapse, and healthy cell populations, we performed CombiFlow similar to the patients described in Figures 4 and 5. Subsequently, PCA plots were generated for all 18 cases. A representative example, depicting Patient 3 as well as 3 healthy control subjects, is shown with individual marker contributions indicated by arrows and the distribution of the clusters (Figure 6A-B). IL1RAP was one of the best discriminating markers between healthy and leukemic cell populations (Figure 6A, longest vector). Clusters identifying healthy cell populations nicely clustered away from clusters identifying the diagnosis, MRD, and relapsed cell populations (Figure 6B). We then summarized the highest ranking markers at PC1 (Figure 6C) and PC2 (Figure 6D), which identified IL1RAP and CD64 as the best scoring marker across this set of 18 longitudinal CombiFlow-analyzed AML cases.

Identification of IL1RAP as the most discriminating marker in standard chemotherapy-treated patients with AML. (A) PCA from Patient 3 and three NBM samples of 40 FlowSOM-based clusters and the contribution of the included markers to the separation of the clusters. (B) The same PCA, now with the 40 clusters assigned to a condition (diagnosis, healthy, relapse, or MRD). PC1 mainly represents the difference between healthy (blue) and AML (other). (C) The highest ranking markers contributing to PC1 for 18 AMLs. (D) The highest ranking markers contributing to PC2 for 18 AMLs. (E) The cohort was split into 2 groups based on relapse, and the normalized expression of IL1RAP was plotted. The asterisk indicates the significant difference (P < .05) between IL1RAP expression in MRD clusters of non-relapsed vs relapsed patients. (F) The cohort was split into 4 groups based on positivity for the EuroFlow and the PM markers. Normalized IL1RAP expression in the MRD-specific clusters was plotted. EF-PM- , EuroFlow-negative PM-negative; EF-PM+, EuroFlow-negative PM-positive; EF+PM-, EuroFlow-positive PM-negative; EF+PM+, EuroFlow-positive PM-positive.
Identification of IL1RAP as the most discriminating marker in standard chemotherapy-treated patients with AML. (A) PCA from Patient 3 and three NBM samples of 40 FlowSOM-based clusters and the contribution of the included markers to the separation of the clusters. (B) The same PCA, now with the 40 clusters assigned to a condition (diagnosis, healthy, relapse, or MRD). PC1 mainly represents the difference between healthy (blue) and AML (other). (C) The highest ranking markers contributing to PC1 for 18 AMLs. (D) The highest ranking markers contributing to PC2 for 18 AMLs. (E) The cohort was split into 2 groups based on relapse, and the normalized expression of IL1RAP was plotted. The asterisk indicates the significant difference (P < .05) between IL1RAP expression in MRD clusters of non-relapsed vs relapsed patients. (F) The cohort was split into 4 groups based on positivity for the EuroFlow and the PM markers. Normalized IL1RAP expression in the MRD-specific clusters was plotted. EF-PM- , EuroFlow-negative PM-negative; EF-PM+, EuroFlow-negative PM-positive; EF+PM-, EuroFlow-positive PM-negative; EF+PM+, EuroFlow-positive PM-positive.
We next analyzed the expression of IL1RAP in MRD-specific clusters and distinguished between patients who did or did not relapse. As shown in Figure 6E, IL1RAP was consistently higher in MRD clusters from patients who relapsed. The difference for IL1RAP reached statistical significance (P < .05). Finally, we also studied IL1RAP expression in MRD clusters in the context of the EuroFlow panel at MRD, which revealed that IL1RAP expression, even in the absence of positivity for EuroFlow panel markers, was consistently high at MRD in patients who subsequently also relapsed (Figure 6F). For the patient in the EF- PM– group, the IL1RAP expression at MRD was high; however, it was not considered positive at diagnosis and therefore assigned to the double-negative group.
Further refinement of CombiFlow by including more markers
Although we initially only included five PM markers in the longitudinal UMCG routine diagnostics pipeline, the panel of aberrantly expressed PM proteins in AML is obviously larger, as previously defined.8 Currently, our flow cytometry panel of aberrant AML markers, run in a research setting, consists of 36 PM markers and 4 backbone markers, namely CD34, CD38, CD45, and CD45RA (supplemental Table 6). This panel was applied to a cohort of 84 patients with AML, and an overview of expression profiles compared with healthy CD34+ cells is shown (Figure 7). Four patients with paired diagnosis and relapse samples, Patients 20 to 23, were selected, and clonal evolution was studied by using next-generation sequencing as well as CombiFlow. Detailed clinical information is provided (supplemental Table 4). We performed analyses with the initial five PM markers that were included in the diagnostic panel and with the more extended 36 PM marker panel (Figure 8; supplemental Figure 5). We observed clonal evolutionary trajectories in Patients 20, 22, and 23 (Figure 8A; supplemental Figure 5A, E), whereas clonal composition remained largely unchanged in Patient 21 (Figure 8E). The inclusion of more markers (5 vs 36) allowed for a more refined identification of subpopulations in Patients 20, 22, and 23 (Figure 8B; supplemental Figure 5B, F). This improved the distinction between diagnosis and relapse cell populations, in particular for Patients 20 and 23 (Figure 8B; supplemental Figure 5F). For Patient 22, this effect was less pronounced, which was expected because the markers that contributed most to PC1 were part of the initial set of 5 markers (IL1RAP, CD97, CD82, and TIM3) (supplemental Figure 5B-D). No distinct, relapse-specific cell populations were identified in Patient 21 with the initial 5 markers or with the extended marker panel (Figure 8F), in line with the stability of the mutations between diagnosis and relapse.

Heterogeneous expression of 36 AML markers in a large AML patient cohort. (A) MFI of PM markers in CD34+cells, or CD34-CD117+ cells for NPM1cyt, AML patients (n = 84) vs healthy controls (NBM, n = 7; mobilized peripheral blood stem cells, n = 2). P values were corrected for multiple testing by using the FDR method. Significant differences compared with NBM are indicated: *P < .05, **P < .01, ***P < .001. (B) Expression of markers compared with healthy controls with a significant shift in MFI (≥2-fold increase in MFI) shown in red. Not determined markers are shown in gray. Markers were ranked according to the amount of positive AMLs.
Heterogeneous expression of 36 AML markers in a large AML patient cohort. (A) MFI of PM markers in CD34+cells, or CD34-CD117+ cells for NPM1cyt, AML patients (n = 84) vs healthy controls (NBM, n = 7; mobilized peripheral blood stem cells, n = 2). P values were corrected for multiple testing by using the FDR method. Significant differences compared with NBM are indicated: *P < .05, **P < .01, ***P < .001. (B) Expression of markers compared with healthy controls with a significant shift in MFI (≥2-fold increase in MFI) shown in red. Not determined markers are shown in gray. Markers were ranked according to the amount of positive AMLs.
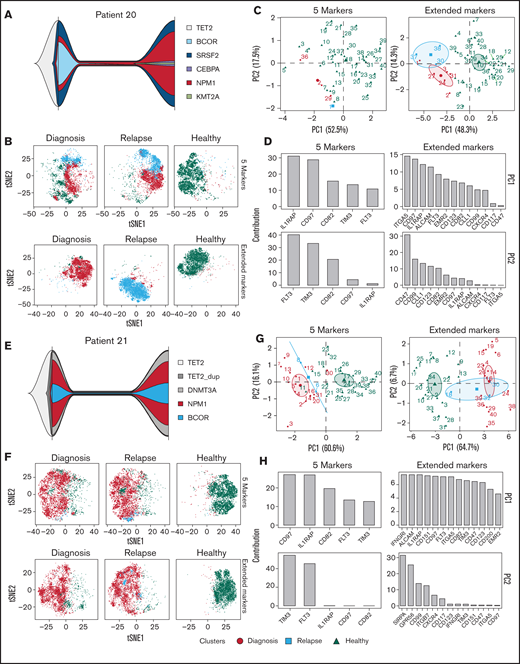
Further refinement of CombiFlow by including more PM markers. (A) Fish plots depicting mutational changes between diagnosis and relapse for Patient 20. (B) tSNE landscapes of Patient 20 created by the 5 markers (top) or aberrant markers selected from the 36-marker panel (bottom). (C) PCAs depicting 40 clusters colored by condition: diagnosis (red circle), relapse (blue square), and healthy (green triangle). PCAs were based on the 5 markers (left) or aberrant markers selected from the 36-marker panel (right). (D) Bar graphs depicting the ranking of the included markers for PC1 and PC2 based on the 5 markers (left) or aberrant markers selected from the extended 36-marker panel (right). (E) Fish plots depicting mutational changes between diagnosis and relapse for Patient 21. (F) tSNE landscapes of Patient 21 created by the 5 markers (top) or aberrant markers selected from the 36-marker panel (bottom). (G) PCAs depicting 40 clusters colored by condition: diagnosis (red circle), relapse (blue square), and healthy (green triangle). PCAs were based on the 5 markers (left) or aberrant markers selected from the 36-marker panel (right). (H) Bar graphs depicting the ranking of the included markers for PC1 and PC2 based on the 5 markers (left) or aberrant markers selected from the extended 36-marker panel (right).
Further refinement of CombiFlow by including more PM markers. (A) Fish plots depicting mutational changes between diagnosis and relapse for Patient 20. (B) tSNE landscapes of Patient 20 created by the 5 markers (top) or aberrant markers selected from the 36-marker panel (bottom). (C) PCAs depicting 40 clusters colored by condition: diagnosis (red circle), relapse (blue square), and healthy (green triangle). PCAs were based on the 5 markers (left) or aberrant markers selected from the 36-marker panel (right). (D) Bar graphs depicting the ranking of the included markers for PC1 and PC2 based on the 5 markers (left) or aberrant markers selected from the extended 36-marker panel (right). (E) Fish plots depicting mutational changes between diagnosis and relapse for Patient 21. (F) tSNE landscapes of Patient 21 created by the 5 markers (top) or aberrant markers selected from the 36-marker panel (bottom). (G) PCAs depicting 40 clusters colored by condition: diagnosis (red circle), relapse (blue square), and healthy (green triangle). PCAs were based on the 5 markers (left) or aberrant markers selected from the 36-marker panel (right). (H) Bar graphs depicting the ranking of the included markers for PC1 and PC2 based on the 5 markers (left) or aberrant markers selected from the extended 36-marker panel (right).
The further refinement of the CombiFlow pipeline was also reflected by the PCA performed with either the initial 5 markers (Figure 8C-D, G-H; supplemental Figure 5C-D, G-H), left panels) or a selection of aberrantly expressed markers from the extended, 36-marker panel (Figure 8C-D, G-H; supplemental Figure 5C-D, G-H), right panels). Although the AML clusters could already be separated from healthy cells based on expression of the 5 markers, and diagnosis and relapse populations could also be distinguished, the distinction was improved by increasing the number of markers. This is illustrated by the increase in the number of relapse-specific clusters in the extended markers analyses. The differences between diagnosis and relapse, as a consequence of clonal evolution, were more pronounced when the number of markers was increased as well. This can be seen in Figure 8C and supplemental Figure 5C and G. The overlap between the diagnosis and relapse clusters in Figure 8G, representing an absence of clonal evolution, remained after inclusion of more markers. The contribution of IL1RAP to the PCAs remained high in the analyses of the extended markers, further strengthening its diagnostic value. The same high contribution of IL1RAP was observed in a larger cohort of patients (n = 64) with 36-marker panel expression data available at diagnosis (supplemental Figure 6).
Thus, by increasing the number of markers included in the CombiFlow pipeline, the resolution of the output is improved, resulting in a better insight into clonal changes throughout disease development.
Discussion
Here, we created an analysis pipeline, termed CombiFlow, that allows tracking of disease progression based on previously defined aberrant AML PM marker expression,8 which may serve as a clinical tool to identify relapse-inducing cell populations. Importantly, the studied PM markers further refined MRD detection because aberrant expression at this time point was significantly correlated with reduced EFS. This was independent of covariates such as age and ELN risk group but also independent of immunophenotypic MRD based on EuroFlow marker status.7,21,23 Combined sequencing and flow data allowed us to define various layers of clonal evolution during disease progression by comparing AML at diagnosis and at relapse.
Although the prognostic value of the PM markers in the context of overall survival was limited at diagnosis, they showed significant independent predictive value at the time point of MRD assessment after induction therapy with standard intensive chemotherapy or multiple cycles of decitabine. No independent significance for immunophenotypic MRD based on the EuroFlow markers was identified. A possible explanation is the fact that clinical decisions are currently based on EuroFlow marker expression, and patients were treated accordingly. However, with the addition of these novel PM markers to the routine diagnostic pipeline, an LAIP could be determined for more patients at diagnosis, and standard immunophenotypic MRD detection could be further improved. This can potentially refine treatment decisions and reduce the number of future relapses.
The CombiFlow pipeline can be applied to examine differences between AML and healthy samples, track disease progression, study clonal evolution, and identify potential relapse-inducing cells. An advantage of CombiFlow in a diagnostic setting is that it provides an overview of the combined marker expression data by visualization in a tSNE landscape, whereby the clustering of cells enables identification of healthy and aberrant populations. At follow-up time points remaining, aberrant cell populations can be identified with different-from-normal expression profiles. This may eventually affect treatment decisions following an expansion of the longitudinal cohort, thereby gaining more insight into what type of aberrant populations at MRD may be relapse-inducing. Merging of acquired flow data based on a shared backbone provides a high level of flexibility in the markers that can be included in the analysis, making this a very versatile pipeline. We examined the effect of increasing the number of markers on the resolution of the clustering and visualization of 4 paired diagnosis/relapse samples. In line with our expectations, we observed that by increasing the number of markers, the separation of AML and healthy cells, as well as cells with different mutational backgrounds, was further improved. This allows the tracking of clonal evolution in patients with AML and indicates whether the relapsing cells were already present at diagnosis or if they emerged throughout disease progression. It also underlines the importance of more personalized flow panels for patients with AML at MRD time points. Such personalized flow panels should not only be based on aberrant expression profiles at diagnosis (LAIP), as this might not take into account immunophenotypic shifts that may occur due to treatment or clonal evolution.
Obviously, measurement of a large panel of antibodies is often not feasible at an MRD time point because the amount of aberrant cells that can be obtained from a patient is limited. This also affected patient inclusion in the longitudinal cohort, which is currently composed of the relatively small number of 72 patients. We propose that a combination of markers detected at diagnosis, together with a ranked list of markers capable of detecting aberrant, relapse-inducing cells in a regenerating bone marrow, could enhance detection sensitivity. This is also in line with a recommendation from the ELN MRD Working Party, who suggests a combination of the LAIP approach with the different-from-normal approach, which is based on aberrant differentiation expression profiles at follow-up time points.34 A promising alternative method of expanding the clinical marker panel is the measurement of up to 40 markers in a single tube with Cytek Aurora spectral flow cytometry. This greatly reduces the required amount of input material, which particularly at MRD time points is a bottleneck.
The next step to further optimize CombiFlow is to expand the number of longitudinally analyzed AMLs. The generation of larger longitudinal data sets will also allow us to implement a more automated assignment of clusters, including a self-learning approach to annotate the most likely MRD populations. By using CombiFlow, aberrant (MRD) populations can now be identified. The next steps will be to sort such identified subpopulations, in particular at MRD time points, to perform mutation detection based on next-generation sequencing, and possibly also more molecular and functional studies. Our approach provides a major advance over other technologies such as single-cell DNA sequencing technologies. Such approaches were recently used to show that AML is a highly dynamic oligoclonal disease whereby clonal evolution occurs both in linear as well as branched trajectories14,15,35 ; a clear disadvantage, however, is that no viable cells can be isolated using such technologies for functional studies. The CombiFlow pipeline does allow for the prospective isolation of viable subpopulations, and in previous8 and ongoing studies (S.M. Hogeling et al, manuscript in progress; Erdem et al, manuscript submitted), we were able to show that such subclones are not only genetically distinct but also differ considerably in their signaling networks and cell biological characteristics. Interesting other new technologies include CITE-seq (Cellular Indexing of Transcriptomes and Epitopes by Sequencing), which combines immunophenotypic data with single-cell transcriptome data,36 and it will be worthwhile to combine such approaches with our CombiFlow pipeline. The versatility of the CombiFlow pipeline also allows for the inclusion of additional markers should they emerge in the future, which will help to further improve and personalize this diagnostic tool.
Acknowledgments
The authors thank Rinus Verspiek and Geert Postema for their contributions to the flow cytometry measurements in the routine diagnostics. GlycoMimetics is acknowledged for providing E-selectin ligand antibody for flow cytometry.
This work was supported by a grant from the Dutch Cancer Foundation (J.J.S., 11013).
Authorship
Contribution: R.H., N.K.v.d.M., S.M.H., B.d.B., and J.J.S performed the research; R.H., N.K.v.d.M., and L.M.M. created the patient database; S.M.H., K.M., and A.B.M. performed genetic studies and analyzed mutational data; K.M., L.M.M., C.M.W., E.A., M.T.N., A.B.M., and G.H. interpreted and discussed data; K.M., M.T.N., and A.B.M. supplied flow cytometry data; and R.H., N.K.v.d.M., and J.J.S. wrote the manuscript, which was approved by all authors.
Conflict-of-interest disclosure: The authors declare no competing financial interests.
The current affiliation for B.d.B. is Finsen Laboratory, Biotech Research and Innovation Centre (BRIC), University of Copenhagen, Copenhagen, Denmark.
Correspondence: Jan Jacob Schuringa, Department of Experimental Hematology, University Medical Center Groningen, Hanzeplein 1, PO Box 30.001, 9700 RB Groningen, The Netherlands; e-mail: j.j.schuringa@umcg.nl.

