

Key Points
Patients with IDH1-R132C have a lower complete remission rate and a trend toward reduced OS.
Patients with IDH2-R172K in the European LeukemiaNet intermediate/adverse-risk group have significantly better relapse-free survival and OS.

Abstract
Mutations of the isocitrate dehydrogenase-1 (IDH1) and IDH2 genes are among the most frequent alterations in acute myeloid leukemia (AML) and can be found in ∼20% of patients at diagnosis. Among 4930 patients (median age, 56 years; interquartile range, 45-66) with newly diagnosed, intensively treated AML, we identified IDH1 mutations in 423 (8.6%) and IDH2 mutations in 575 (11.7%). Overall, there were no differences in response rates or survival for patients with mutations in IDH1 or IDH2 compared with patients without mutated IDH1/2. However, distinct clinical and comutational phenotypes of the most common subtypes of IDH1/2 mutations could be associated with differences in outcome. IDH1-R132C was associated with increased age, lower white blood cell (WBC) count, less frequent comutation of NPM1 and FLT3 internal tandem mutation (ITD) as well as with lower rate of complete remission and a trend toward reduced overall survival (OS) compared with other IDH1 mutation variants and wild-type (WT) IDH1/2. In our analysis, IDH2-R172K was associated with significantly lower WBC count, more karyotype abnormalities, and less frequent comutations of NPM1 and/or FLT3-ITD. Among patients within the European LeukemiaNet 2017 intermediate- and adverse-risk groups, relapse-free survival and OS were significantly better for those with IDH2-R172K compared with WT IDH, providing evidence that AML with IDH2-R172K could be a distinct entity with a specific comutation pattern and favorable outcome. In summary, the presented data from a large cohort of patients with IDH1/2 mutated AML indicate novel and clinically relevant findings for the most common IDH mutation subtypes.
Introduction
Isocitrate dehydrogenase-1 (IDH1), localized in the cytoplasm, and IDH2, localized in mitochondria, belong to a group of enzymes involved in cellular metabolism and response to oxidative damage. They are encoded by the IDH1 and IDH2 genes located on chromosome 2 band q33 and chromosome 15 band q26, respectively.1 Physiologically, their main function is the oxidative decarboxylation of isocitrate to α-ketoglutarate as part of the citric acid cycle. Somatic mutations of IDH1 and IDH2 genes are among the most frequent alterations in acute myeloid leukemia (AML). They can be found in ∼20% of patients at diagnosis, with IDH2 mutations occurring more frequently,2,3 and seem to be early events in leukemogenesis.4
There are inconsistent results regarding the impact of IDH1 and IDH2 mutations on patient outcomes with respect to complete remission (CR) rate, relapse-free survival (RFS), and overall survival (OS).5 These conflicting results are possibly explained by the differential effects of certain subtypes of mutations. Although mutations at the hotspots IDH1 codon 132, IDH2 codon R140, and IDH2 codon R172 share the functional consequence of increased 2-hydroxyglutarate (2-HG) production, several lines of evidence suggest that there are important differences in the biology of these mutation types.6 For example, IDH1 gene mutations in glioma predominantly involve the R132H substitution (found in >80% of patients), whereas in AML, the R132C and R132H mutations are found at comparable frequencies.7
In addition, the comutation spectrum differs between different types of IDH1/2 mutations. Consequently, IDH2-R172K has recently been suggested to define a distinct genomic category of AML, being mutually exclusive from NPM1 mutations and other class-defining lesions and yielding favorable outcome.2,6
Recently, IDH inhibitors have been established as targeted therapies, with ivosidenib8 and enasidenib9 showing promising results in patients with relapsed or refractory AML. They are currently under further investigation as monotherapy as well as in combination with multiple other established treatments in AML.
A detailed analysis of clinical and genetic associations with prognosis is needed to thoroughly assess the impact of the different subtypes of leukemia-associated IDH1/2 gene mutations, which is only feasible in a large, well-characterized cohort of patients with AML. We therefore analyzed a large group of patients with newly diagnosed AML receiving intensive treatment to investigate the impact of IDH1/2 mutations on outcome.
Patients and methods
Patient population
All patients with AML consecutively enrolled in intensive AML treatment protocols or the patient registries of the Study Alliance Leukemia (SAL) and AML Cooperative Group (AMLCG) study groups with sufficient biomaterial available were included in this analysis. All patients received intensive chemotherapy based on anthracyclines in combination with cytarabine within clinical trials AML96,10 AML2003,11 AMLCG1999,12 AML60+,13 AMLCG2008,14 and SORAML15 or were enrolled in the prospective SAL AML registry (registered at www.clinicaltrials.gov as #NCT03188874). Detailed information on treatment regimens used is provided in the corresponding publications. Patients were not treated with IDH1/2 mutation inhibitors. The study was conducted in accordance with the Declaration of Helsinki and approved by the responsible ethics committees. Only data from patients who signed informed consent on analyses of data were included.
Molecular analysis
Screening for IDH1 and IDH2 mutations was performed using genomic DNA isolated from pretreatment bone marrow or peripheral blood samples. Patients enrolled in SAL trials were screened by denaturing high-performance liquid chromatography (DHPLC) as described previously.16 All samples with an aberrant DHPLC chromatogram were analyzed by Sanger sequencing or by sensitive ultradeep next-generation sequencing (NGS).17 In addition, a subset of SAL patients was analyzed using an NGS panel–based approach focusing on genes frequently mutated in hematopoietic disease (TruSight Myeloid Panel; Illumina).18 Both methods were concordant in all samples analyzed with both procedures. The lower limit of detection of these methods was 0.1% (ultradeep NGS) and 1% to 5% (DHPLC and panel NGS). All patients enrolled in AMLCG trials were analyzed using a custom targeted NGS assay.19 Mutations in FLT3 and NPM1 were analyzed as described in detail in previous work.20,21
Definitions
De novo AML excludes patients with previous malignancy and treatment with chemotherapy and/or radiotherapy. AML in patients with a documented history of myelodysplasia or myeloproliferative disorders was considered secondary AML. Therapy-associated myeloid neoplasms comprised patients with prior exposure to chemotherapy and/or radiotherapy. CR and OS were defined according to the current European LeukemiaNet (ELN) criteria.22
Statistical analysis
CR rate and OS are reported for the whole cohort. Cox regression, stratified for the different study protocols, was used to compare survival and estimate univariate and adjusted hazard ratios (HRs). For the binary end point of CR, logistic regression models were fitted to estimate univariate and adjusted odds ratios (ORs).
To compare categorical variables between mutational groups, the χ2 test was used. Continuous variables were compared with the Kruskal-Wallis test.
Results
IDH1 and IDH2 mutations
In the entire cohort (N = 4930), we found IDH1 mutations in 423 (8.6%) and IDH2 mutations in 575 patients (11.7%). Fourteen patients (0.3%) harbored both an IDH1 and an IDH2 mutation. The median follow-up for patients alive was 88 months (95% confidence interval [CI], 85.9-91.0). Table 1 summarizes patient characteristics. The median age for all patients was 56 years (IQR, 45-66). NPM1, FLT3-ITD, and CEBPA mutations were found in 32%, 22%, and 7% (54% of which were biallelic) of the patients, respectively.
Patient characteristics
| All patients analyzed for IDH(N = 4930) | |
|---|---|
| Age, median (IQR), y | 56 (45-66) |
| Female sex | 2429/4930 (49.3) |
| Disease status | |
| De novo | 3988/4891 (81.5) |
| Secondary AML | 626/4891 (12.8) |
| tMN | 277/4891 (5.7) |
| WBC count, median (IQR), (×109/L) | 14.7 (3.6-49.4) |
| Platelets, median (IQR), (×109/L) | 53 (29-99) |
| Bone marrow blasts, median (IQR), % | 65 (42-81) |
| Normal karyotype | 2539/4613 (55) |
| Complex karyotype | 452/3626 (12.5) |
| Trisomy 8 | 387/4613 (8.4) |
| ELN 2017 risk | |
| Favorable | 1578/4515 (35) |
| Intermediate | 1628/4515 (36.1) |
| Adverse | 1309/4515 (29) |
| NPM1 mutated | 1545/4895 (31.6) |
| FLT3-ITD mutated | 1088/4910 (22.2) |
| CEBPA mutated | 324/4862 (6.7) |
| Monoallelic | 108 (45.8) |
| Biallelic | 128 (54.2) |
| IDH1 mutated | 423/4930 (8.6) |
| IDH2 mutated | 575/4930 (11.7) |
| IDH1 and IDH2 mutated | 14/4930 (0.3) |
| IDH VAF, median (IQR) | 38.3 (30-43.3) |
| IDH1 mutation type | |
| R132C | 179/423 (42.3) |
| R132G | 28/423 (6.6) |
| R132H | 177/423 (41.8) |
| R132L | 18/423 (4.3) |
| R132S | 20/423 (4.7) |
| IDH2 mutation type | |
| R140G | 4/572 (0.7) |
| R140L | 8/572 (1.4) |
| R140Q | 438/572 (76.6) |
| R172K | 110/572 (19.2) |
| R172S | 1/572 (0.2) |
Data are presented as n/N (%) unless otherwise indicated.
IQR, interquartile range; ITD, internal tandem duplication; tMN, therapy-associated myeloid neoplasm; VAF, variant allele fraction.
The median variant allele fraction for IDH mutations was 38% (IQR, 30-43), with no difference in variant allele fraction between mutational subgroups (supplemental Table 1).
Compared with patients with wild-type (WT) IDH1/2, patients with mutated IDH1/2 showed significantly lower white blood cell (WBC) count (P = .002), were more likely to have a normal karyotype (P < .001), and more often had mutated NPM1 (P < .001). Details of differences between WT IDH1/2 and mutated IDH1/2 are provided in supplemental Table 2. Overall, no significant differences were observed between patients with WT IDH and those with mutated IDH1 or IDH2 regarding CR rate (73%; 95% CI, 72% to 75%, 69%; 95% CI, 64% to 73%, and 73%; 95% CI, 69% to 77%, respectively; P = .17), median RFS (17 vs 17 vs 18 months, respectively; P = .52), or median OS (20 vs 18 vs 22 months, respectively; P = .58), as shown in Figure 1. However, IDH mutational status influenced OS in distinct ELN 2017 subgroups (Figure 2). In the ELN 2017 favorable-risk category, mutations in IDH1/2 were associated with worse OS compared with WT IDH1/2 (mutated IDH1: HR, 1.43; 95% CI, 1.14-1-79; P < .01 and mutated IDH2: HR, 1.39; 95% CI, 1.13-1.72; P < .01). In the ELN 2017 adverse-risk category, mutated IDH2 did not significantly affect OS, whereas there was a trend toward poorer survival for mutated IDH1 (HR, 1.31; 95% CI, 1.00-1.73; P = .042). There was no impact of IDH1/2 mutations on OS in the ELN 2017 intermediate-risk category.
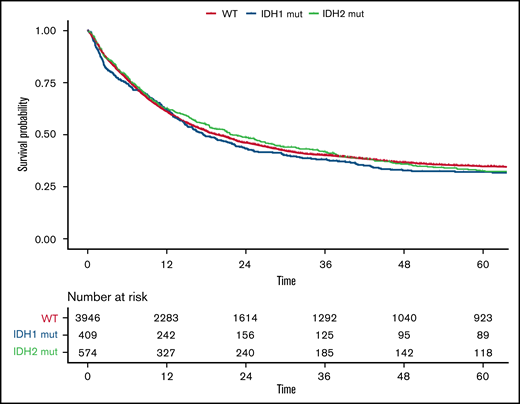
OS according to IDH mutations. Kaplan-Meier plot for OS of patients with AML with mutated IDH1 (blue), mutated IDH2 (green), and WT IDH1/2 (orange); time in months.
OS according to IDH mutations. Kaplan-Meier plot for OS of patients with AML with mutated IDH1 (blue), mutated IDH2 (green), and WT IDH1/2 (orange); time in months.
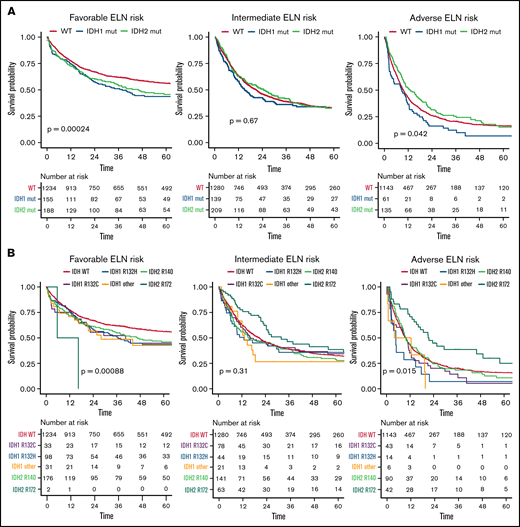
OS according to different mutational subtypes of IDH in ELN 2017 risk categories. Kaplan-Meier plots for OS of patients with AML according to ELN 2017 favorable-, intermediate-, and adverse-risk categories for patients with mutated IDH1 (blue), mutated IDH2 (green), and WT IDH1/2 (orange) (A) and for respective mutational variants of IDH1/2: IDH1-R132H (blue), IDH1-R132C (purple), IDH1 other (R132G, R132S, or R132L; yellow), IDH2-R140 (green), IDH2-R172 (turquoise), and WT IDH (orange) (B). P values were determined with the log-rank test; time in months.
OS according to different mutational subtypes of IDH in ELN 2017 risk categories. Kaplan-Meier plots for OS of patients with AML according to ELN 2017 favorable-, intermediate-, and adverse-risk categories for patients with mutated IDH1 (blue), mutated IDH2 (green), and WT IDH1/2 (orange) (A) and for respective mutational variants of IDH1/2: IDH1-R132H (blue), IDH1-R132C (purple), IDH1 other (R132G, R132S, or R132L; yellow), IDH2-R140 (green), IDH2-R172 (turquoise), and WT IDH (orange) (B). P values were determined with the log-rank test; time in months.
IDH1 mutational variants
The most common IDH1 variants were R132C (n = 179 patients; 42%) and R132H (n = 177 patients; 42%). Other IDH1 mutations were R132G, identified in 7%, R132S in 4%, and R132L in 5% of patients with IDH1 mutations. Because previous analyses have suggested differences in outcome according to individual amino acid exchanges,5 we analyzed these individual groups in more detail.
In patients with IDH1 mutations, we observed significant differences in baseline characteristics (Table 2) between the 2 most common mutational subtypes: R132C and R132H. Patients carrying the R132C mutation were older (62 vs 54 years; P < .001), had lower WBC count (4.3 vs 22.5 × 10⁹/L; P < .001), and were less likely to have an additional NPM1 (24% vs 71%; P < .001) and/or FLT3-ITD mutation (10% vs 27%; P < .001) compared with those with the R132H variant. Patients with the R132C mutation frequently showed comutations in DNMT3A (53%), NPM1 (25%), and RUNX1 (21%). The R132H variant was frequently associated with mutations in NPM1 (78%), DNMT3A (50%), and PTPN11 (25%) as well as FLT3-ITD (23%) and FLT3 tyrosine kinase domain (19%; Figure 3A). Furthermore, in patients with an FLT3-ITD mutation, the median ITD/WT ratio was significantly lower in patients with an R132C mutation (0.3 vs 0.7; P = .029). Patients with R132C more often had secondary AML compared with those with R132H (16% vs 7%) and were less likely to have a normal karyotype (63.5% vs 83.5%; P < .001). Given this, R132C mutations were underrepresented in the ELN 2017 favorable-risk category (21% vs 63%; P < .001) but were more often grouped into ELN 2017 intermediate- (51% vs 28%; P < .001) and adverse-risk categories (28% vs 9%; P < .001) compared with R132H mutations. In a univariate analysis, the CR rate was significantly lower in patients with IDH1-R132C compared with those with the R132H variant (62%; 95% CI, 54-69 vs 77%; 95% CI, 70-83; OR, 0.48; 95% CI, 0.30-0.76; P = .002) and those with WT IDH1/2 (62%; 95% CI, 54-69 vs 73%; 95% CI, 72-75; P = .003), whereas RFS and OS did not differ. In multivariate analysis including age, WBC count, type of AML, and ELN 2017 risk, the CR rate was significantly lower in patients with IDH1-R132C compared with those with other IDH1 mutations (OR, 0.63; 95% CI, 0.43-0.92; P = .016; supplemental Table 3.1). For OS, univariate analysis showed reduced survival for patients with R132C compared with R132H mutations, without reaching statistical significance (15 months; 95% CI, 12-22 vs 23 months; 95% CI, 16-36; HR, 1.18; 95% CI, 0.91-1.53; P = .22; Figure 4A). There was no significant impact of R132C or R132H mutations on OS within the different ELN 2017 risk categories.
Patient characteristics and outcomes by IDH mutation type
| IDH1/2 WT (n = 3946) | IDH1-R132C (n = 179) | IDH1-R132H (n = 177) | IDH1 other (n = 67) | IDH2-R172 (n = 110) | IDH2-R140 (n = 446) | P | |
|---|---|---|---|---|---|---|---|
| Age, median (IQR), y | 55 (44-65) | 62 (53-69) | 54 (44-65) | 60 (51-67) | 61 (50-66) | 59 (51-68) | <.0001 |
| Disease status | .0553 | ||||||
| De novo | 3168/3913 (81) | 140/179 (78.2) | 156/176 (88.6) | 57/67 (85.1) | 94/110 (85.5) | 368/441 (83.4) | |
| Secondary AML | 511/3913 (13.1) | 28/179 (15.6) | 13/176 (7.4) | 9/67 (13.4) | 14/110 (12.7) | 51/441 (11.6) | |
| tMN | 234/3913 (6) | 11/179 (6.1) | 7/176 (4) | 1/67 (1.5) | 2/110 (1.8) | 22/441 (5) | |
| WBC count, median (IQR), (×109/L) | 15.3 (3.9-50.5) | 4.3 (1.6-25.3) | 22.5 (3.8-67) | 15.2 (3.6-51.9) | 2.3 (1.2-9.2) | 16.8 (4.1-56.6) | <.0001 |
| Platelets, median (IQR), (×109/L) | 51 (28-92) | 55 (30-110) | 74 (40-124) | 58 (33-137) | 82 (42-158) | 65 (37-117) | <.0001 |
| Bone marrow blasts, median (IQR), % | 63 (40-80) | 71 (55-86) | 70 (51-84) | 80 (60-89) | 64 (43-81) | 70 (44-85) | <.0001 |
| Normal karyotype | 1897/3717 (51) | 101/159 (63.5) | 132/158 (83.5) | 44/61 (72.1) | 58/101 (57.4) | 304/412 (73.8) | <.0001 |
| Complex karyotype | 424/2949 (14.4) | 8/127 (6.3) | 5/127 (3.9) | 1/48 (2.1) | 3/74 (4.1) | 11/296 (3.7) | <.0001 |
| Trisomy 8 | 313/3717 (8.4) | 2/159 (13.8) | 7/158 (4.4) | 5/61 (8.2) | 16/101 (15.8) | 24/412 (5.8) | .0012 |
| ELN 2017 risk | <.0001 | ||||||
| Favorable | 1234/3640 (33.9) | 33/152 (21.7) | 98/155 (63.2) | 31/58 (53.4) | 2/100 (2) | 177/405 (43.7) | |
| Intermediate | 1280/3640 (35.2) | 78/152 (51.3) | 44/155 (28.4) | 21/58 (36.2) | 63/100 (63) | 141/405 (34.8) | |
| Adverse | 1126/3640 (30.9) | 41/152 (27) | 13/155 (8.4) | 6/58 (10.3) | 35/100 (35) | 87/405 (21.5) | |
| NPM1 mutated | 1110/3914 (28.4) | 43/178 (24.2) | 125/176 (71) | 43/67 (64.2) | 2/110 (1.8) | 220/445 (49.4) | <.0001 |
| FLT3-ITD mutated | 890/3928 (22.7) | 18/178 (10.1) | 47/176 (26.7) | 18/67 (26.9) | 5/110 (4.5) | 108/446 (24.2) | <.0001 |
| FLT3 ratio, median (IQR) | 0.6 (0.2-0.8) | 0.3 (0.1-0.5) | 0.7 (0.3-0.9) | 0.4 (0.2-0.7) | 0.6 (0.6-0.6) | 0.5 (0.2-0.7) | .1018 |
| CEBPA mutated | 288/3886 (7.4) | 7/177 (4) | 1/175 (0.6) | 4/67 (6) | 6/110 (5.5) | 17/442 (3.8) | .0005 |
| IDH VAF, median (IQR) | — | 37.2 (27.6-41) | 37.6 (25.4-42) | 40 (28.6-47.6) | 38.3 (31.2-45) | 39 (32.8-45) | .0008 |
| Allogeneic HSCT in CR1 | 732/3946 (18.6) | 25/179 (14) | 23/177 (13) | 9/67 (13.4) | 21/110 (19.1) | 65/446 (14.6) | .0674 |
| CR | 2892/3946 (73.3) | 110/179 (61.5) | 136/177 (76.8) | 46/67 (68.7) | 80/110 (72.7) | 327/446 (73.3) | .0143 |
| OS, median (95% CI), mo | 19.7 (18.1-21.4) | 14.7 (12.2-21.9) | 23 (16.4-36.1) | 18.7 (13.3-61.4) | 25.6 (21.6-46.3) | 18.9 (15.7-27.4) | .2407 |
CR1, first CR; HSCT, hematopoietic stem cell transplantation; tMN, therapy-associated myeloid neoplasm; VAF, variant allele fraction.
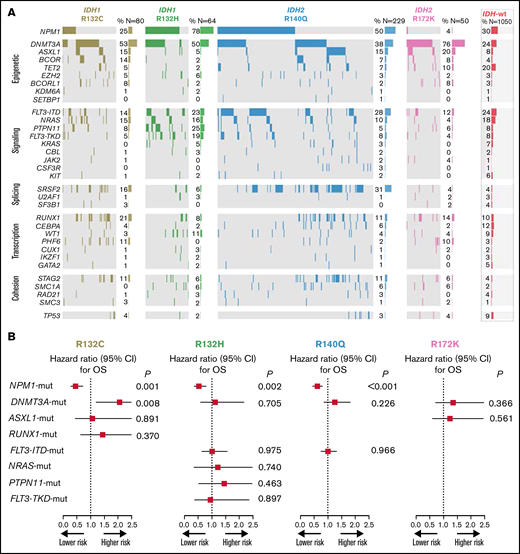
Heatmap of frequent comutations of IDH mutational subtypes and impact on survival. (A) Heatmap grouped for epigenetic, signaling, splicing, transcription, and cohesion pathways for IDH1/2 mutational subtypes. (B) OS analysis of the impact of frequent comutations.
Heatmap of frequent comutations of IDH mutational subtypes and impact on survival. (A) Heatmap grouped for epigenetic, signaling, splicing, transcription, and cohesion pathways for IDH1/2 mutational subtypes. (B) OS analysis of the impact of frequent comutations.
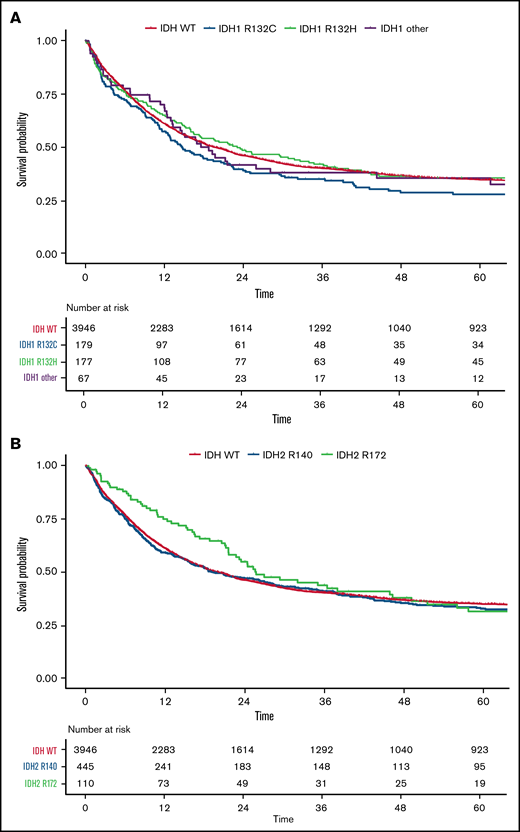
OS for all patients according to IDH1 and IDH2 mutations. Kaplan-Meier plots for OS of patients with AML with mutated IDH1: IDH1-R132C (blue), IDH1-R132H (green), IDH1 other (R132G, R132S, or R132L) (purple), and WT IDH (orange) (A) and mutated IDH2: IDH2-R140 (blue), IDH2-R172 (green), and WT IDH (orange) (B); time in months.
OS for all patients according to IDH1 and IDH2 mutations. Kaplan-Meier plots for OS of patients with AML with mutated IDH1: IDH1-R132C (blue), IDH1-R132H (green), IDH1 other (R132G, R132S, or R132L) (purple), and WT IDH (orange) (A) and mutated IDH2: IDH2-R140 (blue), IDH2-R172 (green), and WT IDH (orange) (B); time in months.
For the less common IDH1 mutational variants (ie, R132G, R132S, and R132L), we found significantly lower CR rates in a multivariate analysis including WBC count, type of AML, FLT3-ITD, NPM1, and ELN 2017 risk (OR, .52; 95% CI, 0.28-0.96; P = .036; supplemental Table 3.2), with no differences between the subgroups (supplemental Table 4). For RFS and OS, there were no significant differences compared with other IDH1 mutation variants.
IDH2 mutational variants
Among patients with IDH2 mutations, 438 had the R140Q (77%) and 110 the R172K (19%) substitution. Rarely found were R140G (1%), R140L (1%), or R172S (0.2%) mutations. For patients with mutated IDH2, R172K was associated with a significantly lower WBC count at diagnosis (P < .001), higher platelet count (P < .001), lower rate of normal karyotype (P < .001), and higher rate of trisomy 8 (P < .01) and was less frequently accompanied by NPM1 (P < .001) and/or FLT3-ITD (P < .001) mutations compared with variants at R140. Patients with IDH2-R172K mutations were less likely to be in the ELN 2017 favorable-risk category (2% vs 43%; P < .001) and were more often in the intermediate- (59% vs 35%; P < .001) or adverse-risk category (39% vs 22%; P < .001) compared with those with R140 variants (Table 2). Patients with the R140Q variant often carried comutations in NPM1 (50%), DNMT3A (38%), SRSF2 (31%), and FLT3-ITD (28%), whereas the most frequent comutations in patients carrying the R172K variant were DNMT3A (76%) and ASXL1 (20%; Figure 3A).
Overall, there was no significant difference when we compared R172K with variants at R140 in CR rate (73%; 95% CI, 63-81 vs 73%; 95% CI, 69-77; P = .99; OR, 0.97; 95% CI, 0.61-1.55; P = .90). Likewise, RFS (28 months; 95% CI, 17-50 vs 17 months; 95% CI, 14-24; P = .22; HR, 0.92; 95% CI, 0.68-1.23; P = .57) and OS (26 months; 95% CI, 22-46 vs 19 months; 95% CI, 16-27; P = .21; HR, 0.89; 95% CI, 0.68-1.17; P = .40) were not significantly different between the groups (Figure 4B). However, in multivariate analysis including age, WBC count, ELN risk, type of AML, and mutational variants of IDH1 and IDH2, IDH2-R172K was identified as an independent predictor of improved RFS (HR, 0.675; 95% CI, 0.50-0.92; P = .013) and OS (HR, 0.737; 95% CI, 0.57-0.95; P = .018) compared with other IDH1/2 mutations (supplemental Table 3.3).
Because only 2 patients with the IDH2-R172K mutation were in the favorable-risk group, we focused on the ELN 2017 intermediate- and adverse-risk groups in more detail to investigate the impact of different IDH2 mutations. Although again no difference was observed in the CR rate, OS was significantly longer in patients harboring IDH2-R172K mutations (n = 105) in univariate testing (26 months; 95% CI, 22-49 vs 13 months; 95% CI, 10-17; HR, 0.68; 95% CI, 0.5-0.9; P = .003) compared with those with R140Q mutations (n = 231; Figure 4). In a multivariate analysis including age, WBC count, type of AML, and ELN 2017 risk as well as the different subtypes of IDH1/2 mutations, we found that patients harboring the R172 mutation had significantly improved OS compared with WT IDH1/2 patients, with an HR of 0.72 (95% CI, 0.56-0.93; P = .012; supplemental Table 3.32). In contrast, neither the R140Q mutation nor IDH1 mutations had a significant impact. This effect was more pronounced within the ELN 2017 adverse-risk category, where IDH2-R172K was associated with significantly better OS (HR, 0.59; 95% CI, 0.41-0.86; P = .015), whereas within the ELN 2017 intermediate-risk category, there was no significant difference in OS for IDH2-R172K (HR, 0.73; 95% CI, 0.52-1.04; P = .31; Figures 2B and 5) in univariate analysis.
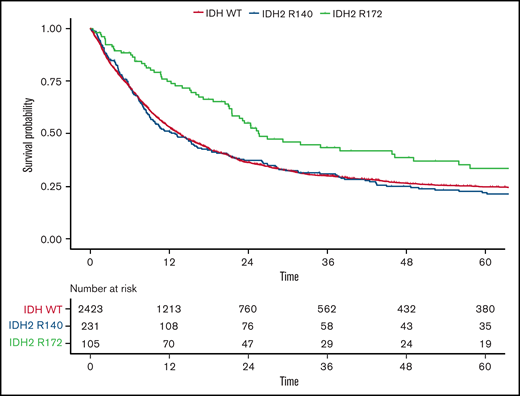
OS according to IDH2 mutational status in ELN 2017 intermediate- and adverse-risk patients. Kaplan-Meier plots for OS of patients with AML within the ELN 2017 intermediate- and adverse-risk group in regard to mutated IDH2-R140 (blue), mutated IDH2-R172 (green), and WT IDH (orange); time in months.
OS according to IDH2 mutational status in ELN 2017 intermediate- and adverse-risk patients. Kaplan-Meier plots for OS of patients with AML within the ELN 2017 intermediate- and adverse-risk group in regard to mutated IDH2-R140 (blue), mutated IDH2-R172 (green), and WT IDH (orange); time in months.
Based on the current ELN 2017 classification, the treatment of patients with FLT3 and/or NPM1 mutations is clearly defined. Given the strong correlation between IDH2 mutation subtypes and NPM1 and FLT3 mutations, we aimed to identify the impact of IDH1/2 mutations in the subset of patients without NPM1 or FLT3-ITD mutations (n = 294). Although again CR rate did not differ for R172K compared with R140Q, RFS (33 months; 95% CI, 17-50 vs 12 months; 95% CI, 9-18; P < .01) and OS (27 months; 95% CI, 23-52 vs 14 months; 95% CI, 10-19; P < .01; OR, 0.68; 95% CI, 0.50-0.93; P = .02) were significantly better for R172K, irrespective of ELN 2017 risk group (supplemental Figure 1).
Comutations in IDH1/2 patients and effect on outcome
Because of the heterogenous comutation spectrum of the different IDH mutation subtypes, we investigated the impact of these mutations on outcome (restricted to a prevalence of >15% per subgroup). NGS showed frequent comutations of IDH variants, predominantly in epigenetic modifiers, especially DNMT3A for all variants, whereas mutations in genes affecting the signaling pathway were most frequently found in IDH1-R132H. NPM1 was frequently associated with IDH1-R132C, IDH1-R132H, and IDH2-R140Q mutations; however, it was only very rarely found in patients with IDH2-R172K mutations (Figure 3A).
The results of this analysis clearly indicated a profound effect of the presence of NPM1 mutations on outcome, irrespective of the accompanying mutational variant of IDH. We also saw a negative prognostic effect of the presence of DNMT3a mutations in patients with IDH1-R312C. None of the other common comutations tested had a significant effect in any of the given subgroups (Figure 3B).
Discussion
We analyzed a cohort of 4930 patients diagnosed with AML with respect to their IDH1/2 mutational status. In concordance with recent reports,2,3 we found IDH1/2 to be mutated in ∼20% of AML cases, with mutations in IDH2 slightly more common than in IDH1. Overall, mutations in IDH1/2 were associated with a significantly lower WBC count and a higher proportion of cases with normal karyotype and were more often accompanied by NPM1 mutations. In general, there was no difference in outcome between patients with mutations in IDH1/2 and those with WT IDH1/2 in our analysis. Because previous reports showed conflicting results concerning the prognostic value of IDH1/2 mutational status on outcome, with several reports suggesting an adverse impact23-27 and others indicating a favorable28,29 or no impact at all,30-33 we focused on the mutational variants of IDH1 and IDH2.
We found comparable proportions of different IDH gene variants as reported in previous cohorts.3,6,24 Patients with IDH1-R132C were significantly older, had fewer NPM1 and FLT3-ITD mutations, and were less likely to have a normal karyotype. Therefore, they were underrepresented in the favorable-risk group according to ELN 201722 when compared with other IDH1 mutation variants. Although CR rate for patients with IDH1-R132C mutations was lower in comparison with that for patients with IDH1-R132H mutations, RFS and OS did not differ. Wagner et al31 also did not report an adverse outcome for IDH1-R132C, but they identified an adverse impact on outcome for a single-nucleotide polymorphism located in codon 105 in the same exon as the IDH1-R132 variant.
The IDH2-R172 mutation was recently suggested as a new provisional AML entity, given its comutational landscape and improved outcome.2,6 Papaemmanuil et al2 analyzed 1540 AML samples and found AML with IDH2-R172 (1%) to be mutually exclusive with NPM1 and other class-defining lesions; Meggendorfer et al6 demonstrated a favorable outcome for patients harboring the IDH2-R172 mutations in a study population of 306 patients with mutated IDH1/2 de novo AML. These results, however, are not undisputed. The accumulation of the oncometabolite 2-HG leads to enhanced proliferation and blocks differentiation of immature hematopoietic cells,34 and IDH2-R172 has been shown to induce higher levels of 2-HG and R-enantiomer of 2-HG than IDH2-R140.35 Serum 2-HG has been shown to be a prognostic indicator, with higher levels of 2-HG yielding unfavorable outcomes.36,37 DiNardo et al38 found a trend toward inferior OS for patients with AML harboring IDH2-R172 mutations (n = 9 of 223) in CR after induction chemotherapy who showed higher levels of serum 2-HG. Regarding IDH1-R132H mutations, Losman et al34 demonstrated increased 2-HG levels compared with WT IDH in an in vitro model with TF-1 erythroleukemia cells and reported a blockage of differentiation in hematopoiesis triggered by the R-enantiomer of 2-HG. However, further evidence is needed to provide a better molecular understanding of the interplay between IDH mutational subtypes and 2-HG activity, especially with respect to clinical outcome.
Recently, Duchmann et al39 reported the impact of IDH1, IDH2-R140, and IDH2-R172 associated with different comutations. The proportions of different IDH variants were comparable to those in our study. In line with our study, Duchmann et al reported IDH2-R172 to be associated with fewer comutations and to be mutually exclusive with NPM1. In their analysis, comutations of NPM1 and IDH2-R140 or IDH1-R132 were associated with higher rates of CR, and patients with comutations of NPM1 and IDH2-R140 had significantly prolonged OS, but in contrast to our findings and other recent studies,2,6 they did not find an association with favorable outcome for IDH2-R172. Whereas Duchmann et al referred to the ELN 2010 classification40 for subgroup analysis, we used the more recent ELN 2017 classification.22 Within the ELN 2017 adverse-risk group, IDH2-R172K was associated with significantly improved RFS and OS, whereas in ELN 2017 intermediate-risk patients, there was a trend toward improved RFS and OS, although statistical significance was not reached, even in this large data set. First, this provides further evidence for improved outcomes in patients with AML with IDH2-R172K mutations without other class-defining lesions, thereby yielding potential implications for future patient care and treatment selection. Second, this highlights the need for coordinated multicenter big data efforts like the HARMONY Consortium41 to illuminate the clinical and biological importance of rare mutations in myeloid neoplasms.
It is important to note that patients in our study were not treated with specific IDH inhibitors. The advent of targeted therapy with IDH mutation inhibitors like ivosidenib8 and enasidenib9 warrants new studies to evaluate the outcomes of patients with different IDH1/2 mutations in response to selective inhibitors.
Furthermore, in older patients with AML ineligible for intensive chemotherapy, IDH mutational status has an impact on response to therapy with hypomethylating agents (HMAs) and/or the BCL2 inhibitor venetoclax.42 Regarding venetoclax, as a single agent or in combination with HMAs, several recent studies found significantly improved response rates and OS in older patients with AML harboring IDH1/2 mutations, especially in IDH2.43-47
A variety of ongoing trials are set to further illuminate the effects of targeted therapies and HMAs in mutated IDH AML, with some specifically investigating the impact of different mutations on treatment response and outcome (registered at www.clinicaltrials.gov as #NCT03471260,48 #NCT02677922,49 #NCT03683433, #NCT03383575, #NCT02719574, and #NCT03173248).
In conclusion, we analyzed a large cohort of patients with AML for the prevalence and prognostic impact of IDH mutations. A detailed analysis of different mutations revealed distinct clinical and comutational features of the IDH1-R132C mutation, and we provide additional evidence in support of delineating the IDH2-R172K mutation as a distinct entity based on its comutational landscape and significant impact on outcome. The differences in outcome of distinct mutations of IDH must be considered in future trials. Our analysis serves as a benchmark for future studies incorporating novel agents to show improvements compared with conventional intensive regimens.
Acknowledgments
The authors thank all patients and caretakers for their support of the trials, and all SAL and AMLCG centers for their commitment in the conduct of the respective trials and registry.
Authorship
Contribution: G.E. and M.B. provided administrative support; G.E., M.B., J.M.M., K.H.M., F.S., and C.T. designed the study; all authors collected clinical and/or genetic data; J.M.M., K.H.M., M.K., J.-N.E., F.S., and C.T. analyzed and interpreted the data and wrote the paper; all authors approved the manuscript, gave their final approval for publication, and agreed to be accountable for all aspects of the work.
Conflict-of-interest disclosure: The authors declare no competing financial interests.
Correspondence: Jan M. Middeke, Medizinische KIinik und Poliklinik I, Universitätsklinikum Carl Gustav Carus, Fetscherstr. 74, 01307 Dresden, Germany; e-mail: janmoritz.middeke@ukdd.de.

