

Key Points
Age- and sex-dependent bone loss occurs in a Townes mouse model of SCD, with female mice more prone to trabecular bone loss.
Reduced cathepsin activity leads to increased thickness and density of cortical and trabecular bone in the Townes mouse model of SCD.

Abstract
Sickle cell disease (SCD) is the most common hereditary blood disorder in the United States. SCD is frequently associated with osteonecrosis, osteoporosis, osteopenia, and other bone-related complications such as vaso-occlusive pain, ischemic damage, osteomyelitis, and bone marrow hyperplasia known as sickle bone disease (SBD). Previous SBD models have failed to distinguish the age- and sex-specific characteristics of bone morphometry. In this study, we use the Townes mouse model of SCD to assess the pathophysiological complications of SBD in both SCD and sickle cell trait. Changes in bone microarchitecture and bone development were assessed by using high-resolution quantitative micro–computed tomography and the three-dimensional reconstruction of femurs from male and female mice. Our results indicate that SCD causes bone loss and sex-dependent anatomical changes in bone. SCD female mice in particular are prone to trabecular bone loss, whereas cortical bone degradation occurs in both sexes. We also describe the impact of genetic knockdown of cathepsin K– and E-64–mediated cathepsin inhibition on SBD.
Introduction
Sickle cell disease (SCD), the most common hereditary blood disorder in the United States, affects ∼100 000 people domestically and ∼300 000 new births globally per year.1,2 Upon deoxygenation, a point mutation in the β-globin subunit of hemoglobin causes the protein to assemble into rod-shaped polymers that consequently distort red blood cells, into a “sickle” shape. A collection of pathologies, including osteonecrosis, osteoporosis, osteopenia, and other bone-related complications such as vaso-occlusive pain, ischemic damage, osteomyelitis, and bone marrow (BM) hyperplasia known as sickle bone disease (SBD), are common complications of SCD that progress from adolescence and ultimately become problematic in 50% of individuals with SCD by 35 years of age.3-5 To prevent progressive joint damage, bed rest and avoidance of certain activities are recommended, but these methods drastically reduce the patient’s quality of life.6,7 Surgical treatments such as a total hip replacement (occurring as early as age 18 years) have an elevated risk of complications, including acute chest syndrome, infection, and congestive heart failure for individuals with SCD.8,9 With these inadequacies, there is a great need for new therapeutic options. Inflammatory vasculopathy and chronic hemolysis disrupt the anabolic and catabolic balance that regulates bone remodeling.10 Preclinical models that allow for high-resolution quantitative micro–computed tomography (microCT) are therefore needed.
Recent studies using transgenic SCD mice found progressively worsening structural modifications in the microarchitecture of trabecular and cortical bone over time.11 Furthermore, although bone morphometry varies with sex and age in individuals with SCD,12-15 previous SBD transgenic mouse studies have either focused on one sex7,11,16 or reported combined observations and data from both sexes.17 Thus, we sought to characterize the sickle bone phenotype of male and female mice at 3 and 5 months in the Townes SCD mouse model.
We assessed regional changes in bone microarchitecture using the Townes SCD mouse model in which mouse hemoglobin genes have been knocked out and the human hemoglobin genes have been knocked in, and with a mutation for β-globin S.18 The homozygous sickle cell mice possessing two β-globin S alleles (SS) produce HbS and recapitulate symptoms of human SCD; heterozygous mice produce HbA and HbS (AS) and are sickle cell trait, and mice homozygous wild type produce only HbA, which can be used as a control group. We characterized bone development and the sickle bone phenotype through microCT analysis of femurs from 3- and 5-month-old male and female mice. Homozygous sickle (SS) mice were compared with heterozygous sickle (AS) and homozygous (AA) mice regarding their bone microarchitecture. We show for the first time that SBD implements bone loss in different regions of the femurs of male and female mice and could cause different bone pathologies in male and female mice.
One key player in bone resorption is cathepsin K (catK), a potent collagenase that is highly expressed by osteoclasts.19 Song et al20 showed that increased catK activation in SCD disrupts vascular integrity. Dalle Carbonare et al17 have also shown an increase in catK messenger RNA from total bone extraction in SS mice during an SCD crisis. We investigated the expression of cathepsins during osteoclast differentiation of sickle BM–derived osteoclast cultures compared with wild-type BM-derived osteoclasts, and we generated a chimeric SCD mouse model by BM transplantation (BMT) from SS BM or control AA BM into either catK null mice (catK−/−) or C57BL6 control mice. Finally, treating mice with the cysteine cathepsin inhibitor E-64 showed that cathepsins are viable targets for SBD treatments.
Materials and methods
Animals
Animal procedures and animal care protocols were performed in accordance and with approval from the Georgia Institute of Technology Institutional Animal Care and Use Committee. We used the Townes SCD transgenic mouse model [B6; 129-Hbatm1(HBA) Tow Hbbtm2 (HBG1, HBB*) Tow/Hbbtm3 (HBG1, HBB) Tow/J] from The Jackson Laboratory.21 The phenotypes of the Townes mice were determined through native polyacrylamide gel electrophoresis (PAGE) of their blood obtained via tail vein. C57BL/6 mice were purchased from Jackson Laboratories. We have had a longstanding colony of catK−/− mice.22 In some studies, 1-month-old male and female SS mice were injected with sterile saline or 9 mg/kg of E-64 via intraperitoneal injection daily for 2 months. Femurs from 3- and 5-month-old male and female mice were harvested for microCT analysis or isolated for 4-point bending mechanical testing. Whole mouse legs were wrapped in gauze moistened with phosphate-buffered saline and preserved at −20°C until the time of evaluation.
Mechanical testing
Using force and displacement data gathered from an MTS 858 Mini Bionix system, the mechanical properties of stiffness, ultimate stress, and maximum force were determined for femurs via 4-point bending as previously reported.7,23 A load was administered to the mid-diaphyseal region of freshly thawed femurs at a rate of 0.04 mm/s until failure. The femurs were tested posterior-side up, with the mid-diaphyseal region at ∼3.1 mm between 2 support pins with a radius of curvature of 0.5 mm. The stiffness was determined as the slope of the linear portion of the force-deflection curve. The maximum moment of inertia about the medial-lateral axis was determined via microCT imaging to calculate the ultimate stress.
MicroCT analysis
Bone mineral density (BMD) and cortical and trabecular bone morphology within the femurs of 3- and 5-month-old male and female mice were examined by using microCT imaging (μCT 40, Scanco Medical) as previously reported.7,23 The mid-diaphysis (1-mm region at femur mid-point, 66 slices), distal epiphysis (0.32 mm in length distal from the growth plate, 25 slices), and metaphysis (0.8 mm in length starting from 0.05 mm proximal to the growth plate) were scanned at 12 μm isotropic voxel size. The analysis settings were as follows: 55 kVp voltage, 144 μA current, and a medium resolution (1024 × 1024-pixel image detection matrix). Cortical and trabecular bone were separated in each region by using an auto-contouring program, with additional manual adjustments for proper boundary.24 Mineralized and soft tissue were distinguished within the mid-diaphysis, distal epiphysis, and metaphysis by using a Gaussian noise filter of 0.8, support of 1, and thresholding bone at 205 to 1000 mg hydroxyapatite/cm3, 62 to 1000 mg hydroxyapatite/cm3, and 155 to 1000 mg hydroxyapatite/cm3, respectively.
Using direct distance transformation algorithms in Scanco software,23,25 necessary bone parameters were measured according to the guidelines set by the American Society for Bone and Mineral Research.26 For the mid-diaphyseal region, we measured the cortical bone area (BA), total area (TA), cortical bone area fraction (BA/TA), and cortical thickness. For the trabecular bone in the distal epiphysis and metaphysis, we measured trabecular spacing, trabecular thickness, trabecular number, trabecular connectivity density, trabecular bone volume (BV), total volume (TV), and bone volume fraction (BV/TV).
Characterization of osteoclast progenitor cells
BM was harvested from femurs and tibias of Townes mice euthanized by carbon dioxide inhalation. BM-derived cells were isolated in phosphate-buffered saline supplemented with 2% fetal bovine serum to characterize osteoclast progenitor cells (OPCs) via fluorescence-activated single cell sorting analysis. Flow cytometry immunophenotyping was performed according to standard procedures, and data were analyzed on a BD FACSAria II or Fusion cytometer. Fluorophore- conjugated monoclonal antibodies for CD11b, CD3, CD45R/B220, CD117, and CD115 were used for OPCs as previously described.27 Live cells were determined by using the live/dead stain of Zombie Violet (BioLegend).
Osteoclast differentiation
BM-derived cells isolated from Townes mice were cultured in 24-well plates at density of 1 million cells per well in Dulbecco’s modified Eagle medium supplemented with 10% heat-inactivated fetal bovine serum, 1% l-glutamine, 1% sodium pyruvate (Gibco), 5% heat-inactivated horse serum, 1% penicillin-streptomycin (Gibco), 1% minimum essential medium/essential amino acids (Gibco), 50 μM β-mercaptoethanol, and 10 ng/mL macrophage colony–stimulating factor (M-CSF) for 24 hours. After 1 day, the media were changed, and the control wells were supplemented with 10 ng/mL M-CSF while the experimental wells were supplemented with 30 ng/mL M-CSF and 100 ng/mL RANKL. The media were changed every other day for 21 days. Osteoclast differentiation was verified via a tartrate-resistant acid phosphatase and nuclear staining kit (Takara Bio).
Cathepsin zymography
AA and SS osteoclast samples were collected in lysis buffer (20 nM Tris-HCl [pH 7.5], 5 mM EGTA, 150 mM sodium chloride, 20 mM β-glycerol-phosphate, 10 mM sodium fluoride, 1 mM sodium orthovanadate, and 1% Triton X-100, 0.1% Tween-20) supplemented with 0.1 mM leupeptin. Cathepsin zymography was performed according to a previously described protocol.28,29 Briefly, an equal amount of protein from each sample was loaded onto 12.5% sodium dodecyl sulfate (SDS)-PAGE gels incorporated with a 0.2% gelatin substrate at 4°C. After gels were washed in renaturing buffer, they were incubated with a sodium phosphate buffer (pH6) supplemented with 2 mM dithiothreitol and 1 mM EDTA for 18 hours at 37°C. Each gel was stained with Coomassie Blue, destained, and imaged with an ImageQuant LAS 4000 (GE Healthcare). Proteolytic activity was visualized as clear bands in the gels and quantified through densitometry with ImageJ (National Institutes of Health).
CatK western blot
AA and SS osteoclast cell lysates were resuspended in lysis buffer for SDS-PAGE and western blotting. The Micro Bicinchoninic Acid Total Protein Assay (Pierce Chemicals) was performed, and equal amounts of cell lysate were loaded for SDS-PAGE. After electrophoresis, the proteins were transferred onto nitrocellulose membranes and incubated with rabbit anti-catK polyclonal antibody (1:500; Proteintech) overnight and with donkey anti-rabbit secondary antibody (LI-COR Biosciences). The membranes were imaged with an LI-COR Odyssey CLx (LI-COR Biosciences).
BM transplant studies
The irradiation protocol used in this study is a well-established protocol for BMT followed by reconstitution.30 Tibias and femurs were excised from 2-month-old male AA and SS mice. The BM was collected by flushing the long bones with sterile saline by using a 25-gauge needle and 10-mL syringe. One week before BMT, recipient mice were treated with 0.5 mg/mL of Baytril (enrofloxacin) in their drinking water. After a lethal irradiation dose of 5 Gy with an X-ray irradiator (RS 2000), 2-month-old recipient C57/BL6 or catK null (catK−/−) male mice received BM-derived cells (∼3 × 10⁶ cells) from either AA or SS mice resuspended in 100 µL of sterile saline through jugular vein injection. After BMT, recipient mice were given drinking water with 0.5 mg/mL of Baytril for 7 days. Recipient mice were euthanized 4 months after BMT at 6 months of age, HbS expression from blood was confirmed by using native PAGE, and microCT analysis was performed on the excised femurs.
Statistical analysis
Statistical comparisons were performed by using GraphPad Prism (GraphPad Software). The resulting analysis is conveyed as mean ± standard deviation. The two-tailed Student t test was used for column analysis. For grouped analyses, one-way analysis of variance with Tukey’s posttest for multiple comparisons was used. For grouped analyses comparing data between genotype and age, two-way analysis of variance with Tukey’s multiple comparisons test was used. A P value <.05 was considered statistically significant.
Results
SS mouse bone have reduced mechanical properties compared with AA and AS genotype controls
To evaluate mechanical property changes in sickle mouse bones, the maximum moment of inertia around the medial-lateral axis was measured with 4-point bending analysis of the mid-diaphyseal region in 3-month-old mice from AA, AS, and SS genotypes (Figure 1A). Results show that SS bones were significantly more brittle than AA mouse bones (Figure 1B). Measurements of maximum force and ultimate stress generated from mouse femurs were significantly lower in SS mice compared with AA and AS mouse genotype control mice (Figure 1C-D).
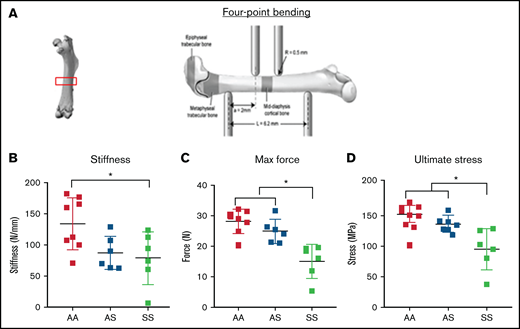
Bone mechanical testing parameters generated by 4-point bending technique in 3-month-old AA, AS, and SS mice. *P < .05, determined by two-way ANOVA with Tukey’s post hoc test, n = 4-6 mice per group, scale bar 100 μm. (A) Schematic diagram of 4-point bending mechanical testing on femoral cortical bone. Based on displacement and force measurement graph and geometry obtained from microCT imaging, stiffness (B) and ultimate stress (D) were calculated, and maximum force (C) were compared (n = 6-8 mice per group).
Bone mechanical testing parameters generated by 4-point bending technique in 3-month-old AA, AS, and SS mice. *P < .05, determined by two-way ANOVA with Tukey’s post hoc test, n = 4-6 mice per group, scale bar 100 μm. (A) Schematic diagram of 4-point bending mechanical testing on femoral cortical bone. Based on displacement and force measurement graph and geometry obtained from microCT imaging, stiffness (B) and ultimate stress (D) were calculated, and maximum force (C) were compared (n = 6-8 mice per group).
Trabecular bone morphology from SCD varies with sex
We used microCT imaging and three-dimensional heat map reconstruction in the distal epiphysis of mice at 3 and 5 months according to guidelines set by the American Society for Bone and Mineral Research.26 The distal epiphysis (Figure 2A) was scanned at 12 µm isotropic voxel size to reconstruct a three-dimensional heat map of trabecular morphology (Figure 2B). AA female mice exhibited a 16% increase in trabecular thickness from age 3 to 5 months; in SS female mice, trabecular thickness was significantly less than in AA female mice at both 3 and 5 months (Figure 2C; supplemental Table 1). In comparison, male AS and SS mice trabecular thickness increased 20% and 26%, respectively, from age 3 to 5 months. For BMD, 5-month-old female SS mice had 79% less BMD compared with AA and AS mice (Figure 2D; supplemental Table 1). Reduced trabecular bone growth with age occurred only in SS and AS female mice.
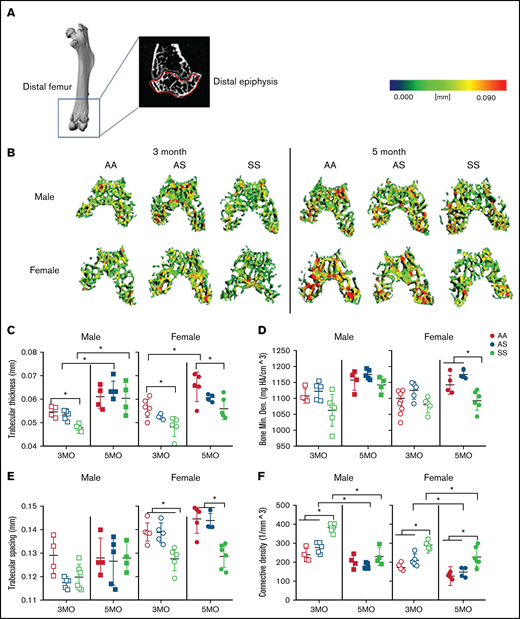
Sex-specific differences in SCD-mediated reduction of trabecular bone in distal epiphysis of mice at 3 and 5 months. (A) Representative microCT image of an entire femoral bone, including a microCT scan of the distal femur with the distal epiphysis outlined in red. (B) Representative three-dimensional heat maps of trabecular morphology in the epiphyseal region of the distal femur in AA, AS, and SS in 3-month-old (left) and 5-month-old (right) male and female mice. A pseudocolor scale of blue (0 mm) to red (0.09 mm) depicts trabecular thickness. Trabecular bone parameters generated by microCT scans include: trabecular thickness (C); BMD (D); trabecular spacing (E); and connective density (F). AA = black, AS = gray, SS = red. Data are expressed as mean ± standard deviation. Statistical significance, *P < .05, determined by two-way analysis of variance with Tukey’s post hoc test; n = 4 to 6 mice per group; scale bar, 100 μm. Bone Min. Den., BMD; HA, hydroxyapatite.
Sex-specific differences in SCD-mediated reduction of trabecular bone in distal epiphysis of mice at 3 and 5 months. (A) Representative microCT image of an entire femoral bone, including a microCT scan of the distal femur with the distal epiphysis outlined in red. (B) Representative three-dimensional heat maps of trabecular morphology in the epiphyseal region of the distal femur in AA, AS, and SS in 3-month-old (left) and 5-month-old (right) male and female mice. A pseudocolor scale of blue (0 mm) to red (0.09 mm) depicts trabecular thickness. Trabecular bone parameters generated by microCT scans include: trabecular thickness (C); BMD (D); trabecular spacing (E); and connective density (F). AA = black, AS = gray, SS = red. Data are expressed as mean ± standard deviation. Statistical significance, *P < .05, determined by two-way analysis of variance with Tukey’s post hoc test; n = 4 to 6 mice per group; scale bar, 100 μm. Bone Min. Den., BMD; HA, hydroxyapatite.
In terms of the microarchitecture, the trabecular spacing in SS female mice at both 3 and 5 months was reduced by 10% compared with that in AS and AA female control mice (Figure 2E; supplemental Table 1); however, in male mice, no significant differences in trabecular spacing were found. Moreover, the trabecular bone interconnectivity in AS and SS female mice decreased by 37% and 18%, respectively, with aging bone (Figure 2F; supplemental Table 1). For male mice, the connectivity density decreased by 35% and 21% in AS and SS male mice from 3 to 5 months.
In the metaphyseal region, no significant difference in trabecular thickness or BMD was seen regardless of age, sex, or genotype (supplemental Table 2). At 3 months, connectivity density in male and female SS mice was up to 33% greater than that of their AA controls. A statistically significant difference in connectivity density was also seen between male SS and AS mice. Both AS and SS female mice exhibited a significant decrease in connectivity density by 60% and 47%, respectively, from age 3 to 5 months. Similarly, in male mice, connectivity density decreased in AA, AS, and SS mice by 48%, 53%, and 47%, respectively, between 3 and 5 months of age. In both male and female AS and SS mice, up to a 34% decrease in trabecular number was seen as the mice aged. Collectively, these results suggest a difference in the trabecular microarchitecture between SS male and female mice, mainly in the epiphyseal region (not the metaphyseal). There are mainly age-related differences (supplemental Tables 1-2).
Cortical bone is decreased in SCD mice
Cortical thickness, a main contributor to bone strength, was determined by examining the cortical bone within the mid-diaphyseal region of murine femurs (Figure 3A). A three-dimensional heat map reconstruction shows decreased cortical thickness in SS mice. This is visually indicated by less red being present in the renderings of both male and female mice at 3 and 5 months compared with AA and AS control mice (Figure 3B). Furthermore, SS femurs had a maximum 27% and 5% reduction in cortical thickness and BMD, respectively, compared with AA and AS genotypes at the same age (Figure 3C-D; supplemental Table 3). Age-related differences for the individual genotypes were also evident. For all 3 male genotypes, cortical thickness increased up to 29% from 3 to 5 months, whereas among the female mice, only AA mice had a significant increase (16%) in cortical thickness. During this age period, this distinction is further highlighted when comparing BMD; only AA female mice had a significant (16%) increase with age between 3 and 5 months.
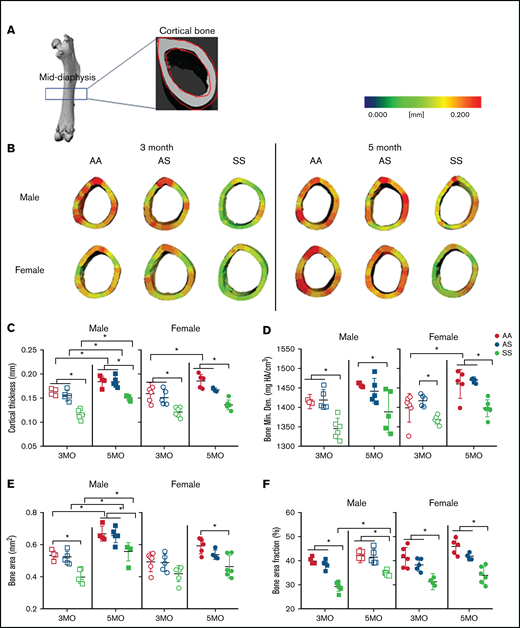
SCD mediates reduced cortical bone thickness in male and female mice. (A) Representative microCT image of an entire femoral bone, including a microCT scan of the mid-diaphysis outlined in red. (B) Representative three-dimensional heat maps of cortical thickness in the mid-diaphyseal region in AA, AS, and SS of 3-month-old (left) and 5-month-old (right) male and female mice. A pseudocolor scale of blue (0 mm) to red (0.2 mm) depicts cortical thickness. Cortical bone parameters generated by microCT scans for male and female mice include: cortical thickness (C); BMD (D); BA (E); and BA/TA (F). AA = black, AS = gray, SS = red. Data are expressed as mean ± standard deviation. Statistical significance, *P < .05, determined by two-way analysis of variance with Tukey’s post hoc test; n = 4 to 6 mice per group; scale bar, 100 μm. Bone Min. Den., BMD; HA, hydroxyapatite.
SCD mediates reduced cortical bone thickness in male and female mice. (A) Representative microCT image of an entire femoral bone, including a microCT scan of the mid-diaphysis outlined in red. (B) Representative three-dimensional heat maps of cortical thickness in the mid-diaphyseal region in AA, AS, and SS of 3-month-old (left) and 5-month-old (right) male and female mice. A pseudocolor scale of blue (0 mm) to red (0.2 mm) depicts cortical thickness. Cortical bone parameters generated by microCT scans for male and female mice include: cortical thickness (C); BMD (D); BA (E); and BA/TA (F). AA = black, AS = gray, SS = red. Data are expressed as mean ± standard deviation. Statistical significance, *P < .05, determined by two-way analysis of variance with Tukey’s post hoc test; n = 4 to 6 mice per group; scale bar, 100 μm. Bone Min. Den., BMD; HA, hydroxyapatite.
In addition, male SS mice at 3 and 5 months of age had up to 33% less mineralized tissue or BA compared with AA control mice. For the SS female mice, BA was only reduced significantly at 5 months (21%) compared with AA control mice (Figure 3E; supplemental Table 3). Similarly, BA/TA decreased up to 25% in SS mice of both sexes compared with AA and AS at both 3 and 5 months. Interestingly, BA/TA in male SS mice increased by 18% from 3 to 5 months but not to the level of AA or AS mice (Figure 3F; supplemental Table 3). Collectively, this finding suggests that although both female and male SS mice have reduced cortical thickness, BMD, BA, and BA/TA compared with control mice, AS and SS female mice tend to show reduced cortical bone growth and BMD with age.
BM osteoclast progenitors are increased in SCD and produce increased amounts of active catK
Osteoclasts are the primary cells responsible for bone resorption. During maturation, OPCs circulate in the blood, migrate into the BM cavity, and attach to the bone surface, and differentiate into bone-resorbing osteoclasts.6 To investigate whether the numbers of OPCs are increased in the sickle BM, we performed flow cytometry, gating for CD11b–, CD3–, CD45R/B220–, and CD117+/CD115+ cells (Figure 4A). When comparing the percentages of OPCs in the BM, there was an increase in SS mice (0.11 ± 0.05%) vs AA mice (0.02 ± 0.02%) (Figure 4B).
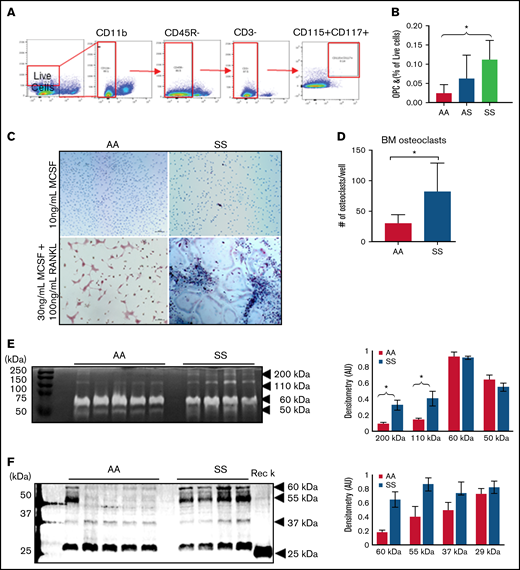
BM osteoclast progenitors are increased in SCD and produce increased amounts of active catK. (A) Flow cytometry identification of OPCs in the BM by gating for cells, live cells, CD11b–, CD45R/B220–, CD3–, and finally CD117+/CD115+ cells. (B) Quantification of OPC percentage of live cells in the BM of AA, AS, and SS mice (n = 5-8 mice per group). Data are expressed as mean ± standard deviation. Statistical significance, *P < .05, determined by one-way analysis of variance with Tukey’s post hoc test. (C) Representative images of BM cells from AA and SS mice treated with either 10 ng/mL M-CSF or 30 ng/mL M-CSF + 100 ng/mL RANKL for 21 days. Osteoclasts were determined as tartrate-resistant acid phosphatase–positive (pink) with at least 3 nuclei (blue). (D) Quantified number of osteoclasts per well (n = 4 mice and 8 wells per group). (E) Representative cathepsin zymograms of AA and SS osteoclasts. Active protein appears as white bands. Densitometry quantification of 200 kDa, 110 kDa, 60 kDa, and 50 kDa bands of active cathepsins in AA and SS osteoclasts (n = 4 mice per group). (F) Representative western blots of catK protein in AA and SS osteoclasts. Recombinant catK was used as a positive control. Densitometry quantification of 60 kDa, 55 kDa, 37 kDa, and 25 kDa bands of catK protein in AA and SS osteoclasts (n = 4-5 mice per group). AA = black, SS = red. Data are expressed as mean ± standard deviation. Statistical significance, *P < .05, determined by Welch’s t test. AU, arbitrary unit.
BM osteoclast progenitors are increased in SCD and produce increased amounts of active catK. (A) Flow cytometry identification of OPCs in the BM by gating for cells, live cells, CD11b–, CD45R/B220–, CD3–, and finally CD117+/CD115+ cells. (B) Quantification of OPC percentage of live cells in the BM of AA, AS, and SS mice (n = 5-8 mice per group). Data are expressed as mean ± standard deviation. Statistical significance, *P < .05, determined by one-way analysis of variance with Tukey’s post hoc test. (C) Representative images of BM cells from AA and SS mice treated with either 10 ng/mL M-CSF or 30 ng/mL M-CSF + 100 ng/mL RANKL for 21 days. Osteoclasts were determined as tartrate-resistant acid phosphatase–positive (pink) with at least 3 nuclei (blue). (D) Quantified number of osteoclasts per well (n = 4 mice and 8 wells per group). (E) Representative cathepsin zymograms of AA and SS osteoclasts. Active protein appears as white bands. Densitometry quantification of 200 kDa, 110 kDa, 60 kDa, and 50 kDa bands of active cathepsins in AA and SS osteoclasts (n = 4 mice per group). (F) Representative western blots of catK protein in AA and SS osteoclasts. Recombinant catK was used as a positive control. Densitometry quantification of 60 kDa, 55 kDa, 37 kDa, and 25 kDa bands of catK protein in AA and SS osteoclasts (n = 4-5 mice per group). AA = black, SS = red. Data are expressed as mean ± standard deviation. Statistical significance, *P < .05, determined by Welch’s t test. AU, arbitrary unit.
With increased OPCs, we then investigated whether cultured SS BM cells would lead to increased osteoclasts in vitro. In AA BM, most of the cells were multinucleated, whereas in SS BM, activated osteoclasts, cells with ruffled borders, were noted (Figure 4C). There was a 64% increase in the number of osteoclasts (tartrate-resistant acid phosphatase–positive, ≥3 nuclei) per well that differentiated from SS BM cells relative to AA BM cells (Figure 4D). We further characterized these cultured AA and SS osteoclasts’ cathepsin activity by using zymography. Figure 4E depicts the amount of active cathepsins visualized at different molecular weights. Densitometry quantification revealed that compared with AA BM-derived osteoclasts, SS BM-derived osteoclasts had 2.5 times and 3.5 times statistically significant more active cathepsin at 110 kDa and 200 kDa, respectively. In addition, the amount of catK protein expression in AA and SS osteoclasts was analyzed by using western blot. Densitometry was used to quantify the expression of the different molecular weights of catK identified, including the mature catK at 29 kDa and pro-catK at 37 kDa (Figure 4F). There was increased catK expression at higher molecular weights of 55 kDa and 60 kDa in SS BM-derived osteoclasts vs AA BM-derived osteoclasts.
Loss of catK provides partial protection in mice
In SS mice, elevated numbers of osteoclast progenitors had increased catK production. We therefore investigated, by performing BMT studies, whether catK affects bone loss. Wild-type C57BL6 mice and mice genetically null for catK (catK−/−) received BM from AA or SS mice after lethal irradiation to test the hypothesis that induction of SCD would cause bone loss but less so in the catK−/− mice (Figure 5A).
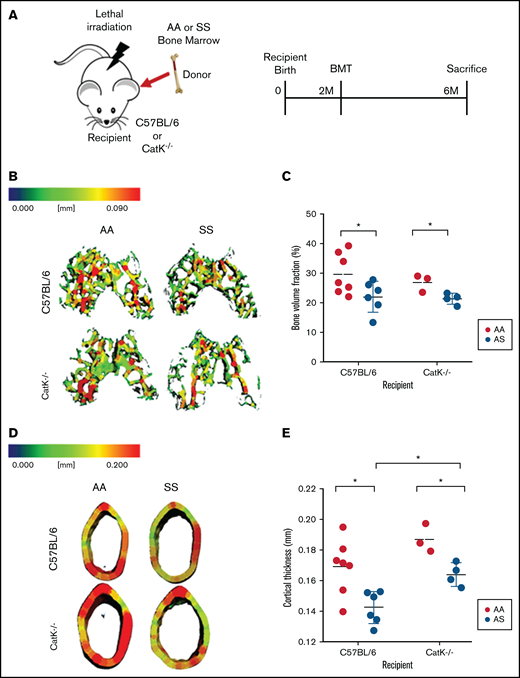
Absence of catK partially mitigates bone loss in SS BM chimeras. (A) Schematic and timeline of BMT studies. (B) Representative three-dimensional heat maps of trabecular morphology in the epiphysis region of the distal femur in C57BL/6 (top) and catK−/− (bottom) that were reconstituted with AA or SS BM. A pseudocolor scale of blue (0 mm) to red (0.09 mm) depicts trabecular thickness. (C) Trabecular BV/TV in the epiphyseal region generated by microCT imaging. AA BM = black; SS BM = red. (D) Representative three-dimensional heat maps of cortical thickness in the mid-diaphyseal region in C57BL/6 (top) and catK−/−(bottom) that were reconstituted with AA or SS BM. A pseudocolor scale of blue (0 mm) to red (0.2 mm) depicts cortical thickness. (E) Cortical thickness in the mid-diaphyseal region generated by microCT analysis. Data are expressed as mean ± standard deviation. Statistical significance, *P < .05, determined by multiple Student t tests with Holm-Šidák’s post hoc test; n = 3 to 7 mice per group; scale bar, 100 μm.
Absence of catK partially mitigates bone loss in SS BM chimeras. (A) Schematic and timeline of BMT studies. (B) Representative three-dimensional heat maps of trabecular morphology in the epiphysis region of the distal femur in C57BL/6 (top) and catK−/− (bottom) that were reconstituted with AA or SS BM. A pseudocolor scale of blue (0 mm) to red (0.09 mm) depicts trabecular thickness. (C) Trabecular BV/TV in the epiphyseal region generated by microCT imaging. AA BM = black; SS BM = red. (D) Representative three-dimensional heat maps of cortical thickness in the mid-diaphyseal region in C57BL/6 (top) and catK−/−(bottom) that were reconstituted with AA or SS BM. A pseudocolor scale of blue (0 mm) to red (0.2 mm) depicts cortical thickness. (E) Cortical thickness in the mid-diaphyseal region generated by microCT analysis. Data are expressed as mean ± standard deviation. Statistical significance, *P < .05, determined by multiple Student t tests with Holm-Šidák’s post hoc test; n = 3 to 7 mice per group; scale bar, 100 μm.
In the distal epiphysis, C57BL/6 mice reconstituted with SS BM had 35% less mineralized tissue (BV/TV) compared with wild-type mice reconstituted with AA BM (Figure 4B-C). Similarly, catK−/− mice given SS BM had a 26% reduction in BV/TV compared with catK−/− mice reconstituted with AA BM (Figure 5B-C). In the mid-diaphyseal region, the cortical thickness decreased by 5% in C57BL/6 male mice transplanted with SS BM compared with those given AA BM (Figure 5D-E). cortical thickness lessened by 12% in catK−/− mice that received SS BM compared with AA BM reconstituted mice. BMT of SS BM donors into catK−/− recipient mice had significantly higher cortical thicknesses than that of C57Bl/6 (catK+/+) mice transplanted with SS BM (Figure 5B, D).
The metaphyseal region showed a significant increase in BV/TV for catK−/− recipients reconstituted with AA BM compared with C5BL/6 recipients reconstituted with SS BM (supplemental Figure 1A-B). In summary, regardless of the presence of catK, bone loss was induced in mice given SS BM, but absence of catK partially protected cortical thickness.
E64 treatment increases cortical and trabecular bone in SCD mice
To test if small molecule inhibition of cathepsins with E-64, a cathepsin inhibitor,31 could protect from bone loss in SCD, microCT analysis was performed on the distal end of femurs of mice after 2 months of E64 treatment, beginning at 1 month of age and ending at 3 months. E-64 significantly increased trabecular thickness in the epiphyseal regions by 8% compared with saline treatment in SS mice (Figure 6A). For trabecular epiphyseal BMD, E-64–treated SS mice had a 5% enhancement compared with untreated control mice. To test the hypothesis that E-64 treatment inhibits cortical bone loss in SS femurs, microCT analysis of the mid-diaphyseal region was conducted at 3 months of age following 2 months of E-64 injections (Figure 6B). Quantitatively, cortical thickness, BA, and BA/TA significantly increased by 9%, 10%, and 10%, respectively, in SS mice after 2 months of E-64 treatment. These data show that E-64 treatment attenuates the cortical bone loss that is characteristic of SBD.
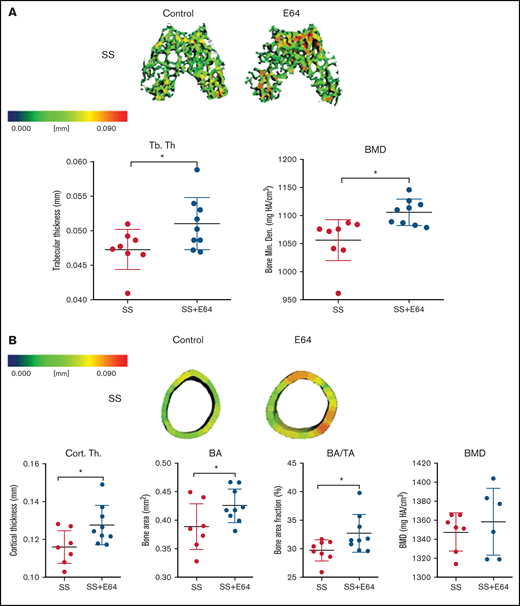
Two months of E-64 treatment of SS mice from 1 to 3 months of age shows increased trabecular and cortical bone thickness when analyzed at 3 months of age. (A) Representative three-dimensional heat maps of the epiphyseal region in SS 3-month-old mice administered saline or E-64 for 2 months, beginning at 1 month of age. A pseudocolor scale of blue (0 mm) to red (0.2 mm) depicts trabecular thickness. Trabecular bone parameters of trabecular thickness and BMD generated by microCT scans. (B) Representative three-dimensional heat maps of the mid-diaphyseal region in SS 3-month-old mice administered saline or E-64 for 2 months. A pseudocolor scale of blue (0 mm) to red (0.2 mm) depicts cortical thickness. Cortical bone parameters of cortical thickness, BA, BA/TA, and BMD generated by microCT scans. Data are expressed as mean ± standard deviation. Statistical significance, * P < .05, scale bar, E-64 or saline treated mice compared via t test. SS = black, SS with E-64 = red (n = 6-9 mice per group). Bone Min. Den., BMD; HA, hydroxyapatite.
Two months of E-64 treatment of SS mice from 1 to 3 months of age shows increased trabecular and cortical bone thickness when analyzed at 3 months of age. (A) Representative three-dimensional heat maps of the epiphyseal region in SS 3-month-old mice administered saline or E-64 for 2 months, beginning at 1 month of age. A pseudocolor scale of blue (0 mm) to red (0.2 mm) depicts trabecular thickness. Trabecular bone parameters of trabecular thickness and BMD generated by microCT scans. (B) Representative three-dimensional heat maps of the mid-diaphyseal region in SS 3-month-old mice administered saline or E-64 for 2 months. A pseudocolor scale of blue (0 mm) to red (0.2 mm) depicts cortical thickness. Cortical bone parameters of cortical thickness, BA, BA/TA, and BMD generated by microCT scans. Data are expressed as mean ± standard deviation. Statistical significance, * P < .05, scale bar, E-64 or saline treated mice compared via t test. SS = black, SS with E-64 = red (n = 6-9 mice per group). Bone Min. Den., BMD; HA, hydroxyapatite.
No significant increase in BMD was noted after 2 months of E-64 treatment, nor were there any significant differences in the metaphyseal trabecular thickness or BMD between E-64 and saline treatment in SS mice (supplemental Figure 1C-D).
E-64 treatment does not improve mechanical properties of sickle bone
To test the hypothesis that E-64 could have a positive improvement on the mechanical properties of bone, 4-point bending was performed on the murine femurs of mice treated with E-64 or saline. E-64 treatment did not significantly increase the maximum force endured by SS femurs (supplemental Figure 2A-B).
Discussion
SCD presents with numerous bone complications, including osteoporosis, osteonecrosis, and osteopenia. With age, these complications progress and lead to orthopedic surgeries at a young age. The underlying mechanisms of SBD have not yet been elucidated. Furthermore, these complications vary between sexes. Here we present novel findings distinguishing SS bone morphology in male and female mice. We also studied the correlation between osteoclast progenitor population, number of osteoclasts, and the expression of catK in the SS BM. Finally, we explored cathepsin inhibition by BM chimera in a catK−/− model and E-64 treatment as a potential therapeutic route. Our findings indicate that SS female mice are prone to trabecular disruption and that OPC, osteoclasts, and catK are increased in the SCD BM and contribute to bone loss. Moreover, E-64 serves as a potent inhibitor of cathepsins and reduces bone loss.
Sex-specific differences in Townes SCD mice are evident in trabecular and cortical bone morphology and growth, and they relate to the bone’s incapacity to withstand high mechanical stress.7,32 In our study, structural bone parameters in both the male and female mice were analyzed through microCT analysis. In SS female mice, reduced BMD and trabecular thickness were noted, indicating less dense trabecular bone. In addition, SS female mice exhibited greater connectivity and less spacing in the trabecular bone compared with control mice, indicating that SBD affects the overall trabecular network. Contrastingly, no reduction in trabecular thickness or BMD was observed in SS male mice, indicating that both sickle cell trait and the homozygous sickle cell anemia condition decreases growth in aging trabecular bone in female mice. Previous studies noted similar outcomes in male and female mice at similar ages.7,11 Based on our data, trabecular bone parameters are the distinguishing factors between the male and female sickle bone phenotype. Therefore, future therapeutic options should be sex based and focused on trabecular bone loss.
In addition, our data support the idea that increased BM OPCs lead to increased amounts of active catK in SCD. This suggests that the chronic inflammatory state of SCD promotes osteoclastogenesis, prolonged osteoclast activity, and catK activation causing bone resorption in both mice and humans.33 Cathepsin zymography and western blot data displayed increased amounts of active catK and other cathepsins in SS osteoclasts. Nonreducing zymography generates a human catK signal of ∼50 kDa.28 The higher molecular sized active bands in the zymography (200 kDa, 110 kDa) suggest that other active cathepsins are present or that catK is bound to other extracellular matrix proteins.34,35 Reducing western blots revealed expression of mature catK (25 kDa) and pro-catK (37 kDa) in SS (and one AA) BM-derived osteoclasts, with larger sized bands appearing that also indicate catK bound likely to cleaved matrix proteins or glycosaminoglycans.
Our BMT studies further suggest increased SS osteoclast cathepsin activity in SCD bone loss. After reconstituting irradiated wild-type mice with SS BM, effectively giving these mice SCD, cortical thickness and trabecular BV/TV were diminished compared with mice reconstituted with AA BM. This reduction in the bone parameters was also seen when reconstituting catK−/− mice with SS BM compared with those given AA BM. There was a statistically significantly increased cortical thickness of catK−/− mice reconstituted with SS vs C57Bl/6 reconstituted with SS BM. Because catK−/− mice have an osteopetrotic phenotype with more dense bone,22 this result is not surprising; however, it does indicate that osteoclasts generated in the SCD environmental trigger bone resorption and loss in the presence or absence of catK. It is also possible that chimeras with remaining catK−/− hematopoietic stem cells could also still differentiate into osteoclasts with reduced bone resorptive abilities.
Finally, a broad cathepsin inhibitor, E64, was introduced to determine the effectiveness of cathepsin inhibition for bone integrity protection. E-64 inhibits the activity of several cysteine proteases such as catK and cathepsin S, L, B, and H, leading to attenuated bone loss in SCD.36 After initiating E-64 treatment, an increase in the thickness and BMD of cortical and trabecular bone in SS mice was observed. Overall, the bone parameters in E-64–treated SS improved by ∼10% compared with untreated mice. Thus, SS-mediated cathepsin activity is contributory to SCD-mediated bone loss.
Although our data are promising and could contribute substantially to the field of SCD, there are limitations to be noted. No significant sex-related changes were noted in the metaphyseal bone (supplemental Table 2), suggesting that the changes are regional and the metaphyseal region has limited impact. It is acknowledged that our BM chimera studies may suffer from reduced bone growth and bone cell activity, as was shown in larger rabbit models.37,38 Mesenchymal stem cells, which are precursors to osteoblasts, are known to be more resistant to lethal irradiation than hematopoietic stem cells,39 and it has been shown that high-dose radiation exposure results in increased osteoclast activity and reduced osteoblast activity.40 Future studies will have to determine if these phenomena are occurring under the conditions of our study. In addition, the mechanical testing studies showed little significance between mechanical testing parameters in treated and untreated sickle bone (supplemental Figure 1). This points to the complexity of SBD, the potential utility of combined therapy, and the need for future studies in this area.
Here we established trabecular morphometry as the most important factor when characterizing the sickle bone phenotype. We also elucidate the sex-dependent architectural differences and identify increased cathepsin production as a major contributor in SBD. Variations in pain presentation tend to be sex and age related, with female subjects reporting greater degrees of pain, and previous studies have shown that vaso-occlusive bone damage in SCD is related to acute and chronic pain.41-43 The present analyses highlight the need for studies to establish the molecular mechanisms leading specifically to sex-dependent manifestations of SCD, and we hope our work will improve the development of more highly effective SBD approaches.
Acknowledgments
The authors thank Georgia Tech Petit Institute for Bioengineering and Bioscience core facility managers, Steven Woodard, Angela Lin, and Sommer Durham, and all the animal facility staff.
The work was supported by grants from the National Institutes of Health (NIH) (National Institute of Arthritis and Musculoskeletal and Skin Diseases, R01AR056445; National Institute of Dental and Craniofacial Research, R01DE019935), grants from the Department of Defense (W81XWH-10-1-0928, E.A.B.) and the NIH (National Heart, Lung, and Blood Institute, R56HL136210-01, M.O.P.), and by the American Heart Association Grant-in-Aid (17GRNT33710016, M.O.P.). The study was in part supported by the Regenerative Engineering and Medicine Center’s “Georgia Partners in Regenerative Medicine” seed grants and the Marcus Center for Therapeutic Cell Characterization and Manufacturing (MC3 M) research grant (E.A.B.). It was also supported by the National Science Foundation grant NSF GRFP DGE-1148903, an NIH/National Institute of General Medical Sciences Cells and Tissue Engineering Biotechnology training grant (T32GM008433), and the Alfred P. Sloan graduate fellowship awarded to J.S.
Authorship
Contribution: J.S. and H.S. designed and performed experiments, collected and analyzed data, and wrote the manuscript; C.R. performed the microCT analysis; S.D. performed the osteoclast western blots, cathepsin zymography, and data analysis; A.A. and K.B. analyzed data; N.T. edited the manuscript; and E.A.B. and M.O.P. served as principal advisors and contributed to experimental design and manuscript editing.
Conflict-of-interest disclosure: The authors declare no competing financial interests.
Correspondence: Edward A. Botchwey, The Parker H. Petit Institute for Bioengineering & Bioscience, 315 Ferst Dr NW, Atlanta, GA 30332; e-mail: edward.botchwey@bme.gatech.edu.

