

Key Points
This study describes a new laboratory-developed test (LDT) for the LSC17 score in a CAP/CLIA-certified diagnostic laboratory.
The LSC17 LDT will enable rapid risk stratification at diagnosis and a personalized treatment approach for patients with AML.

Abstract
Leukemia stem cells (LSCs) are linked to relapse in acute myeloid leukemia (AML). The LSC17 gene expression score robustly captures LSC stemness properties in AML and can be used to predict survival outcomes and response to therapy, enabling risk-adapted, upfront treatment approaches. The LSC17 score was developed and validated in a research setting. To enable widespread use of the LSC17 score in clinical decision making, we established a laboratory-developed test (LDT) for the LSC17 score that can be deployed broadly in clinical molecular diagnostic laboratories. We extensively validated the LSC17 LDT in a College of American Pathologists/Clinical Laboratory Improvements Act (CAP/CLIA)-certified laboratory, determining specimen requirements, a synthetic control, and performance parameters for the assay. Importantly, we correlated values from the LSC17 LDT to clinical outcome in a reference cohort of patients with AML, establishing a median assay value that can be used for clinical risk stratification of individual patients with newly diagnosed AML. The assay was established in a second independent CAP/CLIA-certified laboratory, and its technical performance was validated using an independent cohort of patient samples, demonstrating that the LSC17 LDT can be readily implemented in other settings. This study enables the clinical use of the LSC17 score for upfront risk-adapted management of patients with AML.
Introduction
Acute myeloid leukemia (AML) is a heterogeneous malignancy of hematopoietic stem cells.1 Significant evidence links therapy resistance and relapse in AML to properties of the leukemia stem cells (LSCs) that drive disease.1 We recently described a 17-gene LSC weighted-sum expression score (LSC17) derived from functionally validated LSC populations from a large number of AML patient samples. The LSC17 score is highly associated with survival outcomes and is predictive of initial therapy response across a spectrum of patients with newly diagnosed AML of diverse subtypes. Furthermore, it refines currently used risk classifications, including the European LeukemiaNet risk groups,2,3 and has superior prognostic accuracy when tested against other published LSC signatures in multivariate analyses.2 The prognostic value of the LSC17 score has recently been confirmed by other groups for both adult and pediatric AML.3,4
Prognostic criteria in AML are complex and require multiple laboratory assays that have variable turnaround times.5 As a result, most patients receive standard induction chemotherapy with an anthracycline-containing regimen (eg, 3 + 7) and risk-adapted management decisions, such as whether to proceed with stem cell transplantation, are deferred until after the initial therapy. However, it is clear that not all patients with AML benefit equally from standard therapy. In particular, patients with a high LSC17 score do poorly with standard induction and should be prioritized for alternative upfront therapies or clinical trials.2 Thus, a rapid laboratory test to measure the LSC17 score would enable upfront, risk-adapted treatment decisions for patients with newly diagnosed AML and potentially have a high clinical impact. To enable implementation, the LSC17 score must be measurable by a validated, reliable clinical assay with a turnaround time of a few days. In addition, to facilitate broad uptake, the test should ideally be inexpensive and easy to perform and should have an established quality control process.
We describe the development, validation, and implementation of a laboratory-developed test (LDT) for the LSC17 score in a College of American Pathologists/Clinical Laboratory Improvements (CAP/CLIA)-certified diagnostic laboratory that fulfills all of these criteria. The test is performed on the NanoString nCounter platform, with an in-laboratory running time of 2 workdays. The assay was readily established in a second independent CAP/CLIA laboratory, demonstrating ease of technical implementation and reproducibility. The LSC17 LDT will provide clinicians with a rapid and powerful tool that can be incorporated into risk-stratified management algorithms for patients with AML.
Methods
Additional descriptions of patients and methods are provided in the supplemental Methods.
NanoString Elements assay design
A custom assay was designed for the NanoString nCounter Analysis System (nCAS), using first-generation Elements reagents and procedures.6 The LSC17 score is calculated based on expression levels of the 17 genes that make up the LSC17 signature, normalized to 12 housekeeping genes chosen to represent a range of absolute expression levels.2 Pairs of probes ∼75 nucleotides in length, with target sequences of 50 bp, were designed by NanoString Technologies to target the 17 LSC signature genes and 12 reference genes and were synthesized as polyacrylamide gel electrophoresis–purified ultramers (IDT, Coralville, IA). RNA hybridization sequences were chosen to best overlap the target regions of the probes used in the original research assay design described previously.2
Assay protocols
Assay protocols followed the manufacturer’s standard procedures for sample preparation, probe hybridization, and analysis using the nCAS. The assay was run with both the Elements and Elements XT reagent kits. Cartridges were loaded with 150 ng RNA per sample, 20 μL reporter probe mix, and 5 μL capture probe mix (TagSets; NanoString). For validation runs, a mix of oligonucleotides (300 fM each) matching the target sequence for each probe was run on each cartridge as a normalization control. Samples were incubated at 67°C for a minimum of 16 hours for hybridization using the nCAS Prep Station (version, 4.0.11.1). After hybridization, excess probes were washed out with a 2-step magnetic bead-based purification according to the manufacturer’s protocol, and purified TagSet-target complexes were immobilized onto the streptavidin-coated internal surface of the cartridge, using the nCAS Prep Station.
Transcript counts were measured with the nCAS Digital Analyzer (version 2.1.2.3) at the high-resolution setting. Cartridges were sealed and scanned on the nCAS Digital Analyzer, and fluorescent barcodes were counted at a high sensitivity of 280 fields of view for data collection. Digital images were processed with final barcode counts collected in reporter code count output files. Quality control and normalization were performed with nSolver analysis software v.4.0, using default settings for gene expression analysis (supplemental Methods).
Reporter code count files generated by the nCAS Digital Analyzer were used to calculate LSC17 scores for individual patient samples with a custom script in R2. Gene expression values were scaled to be comparable to those of the clinical reference cohort, using a multiplicative factor computed from the expression of the 12 housekeeping genes. The LSC17 score was computed from the normalized gene expression as a sum of the scaled expression values, weighted by gene-specific coefficients, as described previously.2 The calculated LSC17 scores, which ranged between –0.15 and +1.4, were classified as high or low based on whether they were above or below the median LSC17 score of the clinical reference cohort, respectively.
Synthetic reference control
To construct a synthetic control for the LSC17 LDT, the targeted exon sequences from the 17 signature genes that form part of the LSC17 score, as well as additional flanking upstream and downstream sequences, were combined into a single contiguous plasmid sequence. As each of the 17 signature genes is represented at single copy number within the control, their abundance in the assay should be equal in the absence of technical variation. Housekeeping gene exon sequences were incorporated within the synthetic control staggered at 1×, 2×, 3×, and 4× copy numbers, thereby forming a quantitative reference ladder (supplemental Figure 1).
Statistical analysis
For the measurement of technical variation of LDT, log2-transformed probe counts were used to calculate LSC17 scores of representative high- and low-score patient samples over 9 replicate runs (Figure 4). The standard deviations for the sets of high and low scores were averaged to approximate the technical variation of the LDT at a mean standard deviation of ≈0.05.
Results
Assay design and conversion to Elements format
To establish a clinical grade LDT for the LSC17 score that can be run efficiently and transferred easily to other clinical molecular diagnostics laboratories, we adapted a research assay that was developed for the NanoString nCounter Analysis System (nCAS).2 This research assay measures the expression of 29 genes: 17 signature genes that contribute to the LSC17 score, plus 12 housekeeping genes used for normalization.
The original LSC17 assay used a custom codeset for standard NanoString reagents, in which pairs of gene-specific oligonucleotide probes were synthesized, with 1 probe of the pair biotinylated and the other conjugated to a fluorescent reporter tag.6 To make the LSC17 LDT more easily transferable, we adapted the assay protocol to use Elements reagents, an updated NanoString sample prep kit that employs user-supplied, gene-specific oligonucleotide probes along with generic manufacturer-supplied adapters. This design allows for the assay to be easily integrated into the workflow in a laboratory running multiple NanoString assays. Elements-compatible RNA sequence hybridization probes were designed to bind and evaluate the expression of the 17 signature genes used to calculate the LSC17 score, plus the 12 housekeeping genes, along with internal negative and positive control probes. Probe sequences were designed to match or overlap target regions from the original research assay as closely as possible.
Because rapid turnaround time is necessary for clinical AML risk assessment, we developed a workflow in which results from the LSC17 LDT using Elements reagents can be made available within 48 hours after sample receipt (Figure 1A). RNA extraction and quantification for all samples on a run can be completed in approximately half a workday (4 hours), followed by setup of hybridization reactions. Hybridization of RNA to oligonucleotide probes requires a 16-hour overnight incubation. The setup of the nCounter cartridge and the on-machine run time (6 hours) occur on the second day. The LSC17 score is calculated by feeding the generated data files into a custom R2 script. Results can be returned by the end of the second workday.
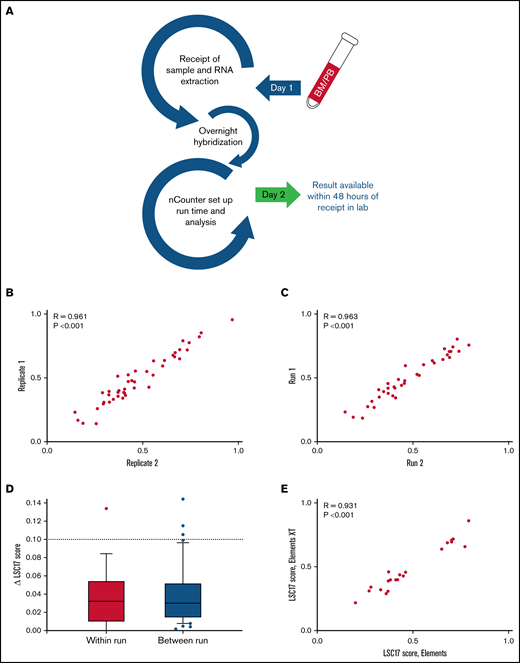
A NanoString-based laboratory-developed test reproducibly measures LSC17 score. (A) Workflow in the clinical laboratory for the LSC17 LDT. Samples received by the middle of a workday can be reported by the end of the next workday. (B-C) Plots showing within-run (B) and between-run (C) correlation in replicate measurements of the LSC17 score. (D) Box-and-whisker plots showing difference (Δ) in within-run and between-run replicate measurements of the LSC17 score. Boxes represent interquartile range (IQR), with median indicated. Whiskers represent 10th and 90th percentiles. The dotted line (Δ0.1) indicates 2 standard deviations of the technical variation of the assay. (E) Plot showing correlation between LSC17 scores measured using Elements and Elements XT reagents. In panels B-D, each dot represents an independent patient sample; R, Spearman correlation coefficient.
A NanoString-based laboratory-developed test reproducibly measures LSC17 score. (A) Workflow in the clinical laboratory for the LSC17 LDT. Samples received by the middle of a workday can be reported by the end of the next workday. (B-C) Plots showing within-run (B) and between-run (C) correlation in replicate measurements of the LSC17 score. (D) Box-and-whisker plots showing difference (Δ) in within-run and between-run replicate measurements of the LSC17 score. Boxes represent interquartile range (IQR), with median indicated. Whiskers represent 10th and 90th percentiles. The dotted line (Δ0.1) indicates 2 standard deviations of the technical variation of the assay. (E) Plot showing correlation between LSC17 scores measured using Elements and Elements XT reagents. In panels B-D, each dot represents an independent patient sample; R, Spearman correlation coefficient.
After design and workflow implementation, we tested both within- and between-run reproducibility of LSC17 scores from patient samples. Within-run variability was assessed by testing multiple replicates of samples within a single run. Thirty-six samples collected from patients with AML for clinical validation of the assay were tested in duplicate on the same NanoString cartridges, with parallel sample processing using identical reagents. Within-run variability was very small, with replicates displaying high correlation in LSC17 scores (R = 0.961; P < .001; Figure 1B). The LSC17 score was also highly stable when tested between runs: 45 samples were tested twice on different days, using different batches of reagents. These tests also showed a high correlation in LSC17 scores between the 2 runs for each sample (R = 0.963; P < .001; Figure 1C). In 97% and 93% of within-run and between-run replicates, respectively, the LSC17 scores differed by <0.1 (equivalent to 2 standard deviations; see “Methods”). In fact, in most cases, the difference in the LSC17 scores between replicates was much smaller than 0.1 (Figure 1D). Thus, 0.1 represents a conservative estimate of the expected technical variation between measurements.
In addition, we tested whether the use of Elements XT reagents, a newer version of the NanoString reagent kit that allows for smaller reaction volumes, would affect assay performance. LSC17 scores for 21 samples from patients with AML tested with both Elements and Elements XT reagents were highly correlated (R = 0.931; P < .001; Figure 1E), indicating that Elements XT reagents have equivalent performance to original Elements reagents for this assay.
Establishment of a reference data set for clinical interpretation of the LSC17 LDT
The prognostic value of the LSC17 score was originally validated retrospectively in a large number of patients with AML from multiple independent cohorts, by classifying patients as having high or low LSC17 scores based on the median score within each cohort.2 Prospectively, to classify a patient with newly diagnosed AML as high vs low risk, that individual’s LSC17 score can be compared with the median score of a reference patient cohort, as long as the scores are measured using the same validated LDT. To establish a reference data set for the LSC17 LDT, we used a clinical cohort from our original LSC17 validation study, a group of 306 patients with AML of diverse subtypes treated with induction chemotherapy at Princess Margaret Cancer Centre (PM). LSC17 scores measured in this cohort were highly correlated with clinical outcomes.2
We first compared the LSC17 score of individual patient samples measured with the LDT to the score previously obtained by the research assay. To make this comparison, we adjusted gene expression values using batch correction and normalization to the housekeeping reference gene counts in all sample lanes (see “Methods”). After normalization, LSC17 scores from the LDT were comparable to those obtained from the original research assay (R = 0.826; P < .001; Figure 2A). Normalized scores for the Elements-based LDT were in general higher than for the assay using standard reagents (median LSC17 score 0.51 vs 0.44, respectively). Twenty-four of 306 samples (8%) had a normalized LSC17 score that differed by more than 0.3 between the 2 assays. Eight samples (3%) had a change in classification of their LSC17 score, switching from a clear high to clear low score or vice versa (higher or lower than the median by at least 0.1). Underlying gene expression values were well preserved in the LDT. Expression values for all 17 LSC17 genes and 12 housekeeping controls were well correlated between the original assay and the LDT.

LSC17 score measured by the LDT is strongly associated with survival outcomes. (A) Plot showing LSC17 scores of 306 patients with AML from PM measured by the original research assay2 and by the LSC17 LDT. Each dot represents 1 patient sample. R, Spearman correlation coefficient. (B-C) Kaplan-Meier estimates of overall (B) and relapse-free (C) survival of 306 patients in the PM AML cohort according to LSC17 scores measured by the LDT and classified as high (above median) or low (below median). The median LSC17 score for the cohort was 0.51.
LSC17 score measured by the LDT is strongly associated with survival outcomes. (A) Plot showing LSC17 scores of 306 patients with AML from PM measured by the original research assay2 and by the LSC17 LDT. Each dot represents 1 patient sample. R, Spearman correlation coefficient. (B-C) Kaplan-Meier estimates of overall (B) and relapse-free (C) survival of 306 patients in the PM AML cohort according to LSC17 scores measured by the LDT and classified as high (above median) or low (below median). The median LSC17 score for the cohort was 0.51.
We evaluated the correlation of the LSC17 score measured by the LDT with survival outcomes in the reference cohort, using the normalized median LSC17 score (0.51) to divide the cohort into patients with high (above-median) and low (below-median) scores. As seen with the original research assay, a high LSC17 score measured by the clinical LDT was strongly associated with shorter overall survival and relapse-free survival (Figure 2B-C, respectively). Moreover, LSC17 scores measured by the LDT achieved better risk stratification than the original assay, with higher hazard ratios in both univariate and multivariate analyses compared with those from the original assay, and smaller P-values (Table 1). Risk stratification was superior both when LSC17 score was treated as a continuous variable and when it was discretized into high and low categories. These results indicate that the LSC17 LDT is at least equal to and likely superior to the original research assay in capturing the clinically relevant stemness features of this gene expression signature. Furthermore, the median LSC17 score of this reference data set provides a basis for clinical interpretation of the Elements-based LSC17 LDT. LSC17 scores higher than the reference median score of 0.51 are associated with worse outcomes for patients treated with standard induction chemotherapy and vice versa.
Overall survival for PM cohort of 306 patients with AML by LSC17 score, continuous or discretized, as measured by research and clinical assays
| Overall survival | Continuous scores univariate analysis (n = 306)* | Discretized scores univariate analysis (n = 306)* | ||
|---|---|---|---|---|
| Covariate | Hazard ratio (95% CI)† | P‡ | Hazard ratio (95% CI)† | P‡ |
| High score (research) | 4.82 (2.98-7.78) | <.001 | 2.72 (2.04-3.63) | <.001 |
| High score (clinical) | 6.69 (4.31-10.39) | <.001 | 3.33 (2.48-4.47) | <.001 |
| Continuous scores multivariate analysis 1 (n = 283)* | Discretized scores multivariate analysis 1 (n = 283)* | |||
| High score (research) | 4.35 (2.42-7.82) | <.001 | 2.51 (1.79-3.51) | <.001 |
| Age | 1.00 (0.99-1.01) | .18 | 1.00 (0.99-1.01) | .29 |
| WBC count | 1.00 (1.00-1.00) | .001 | 1.00 (1.00-1.00) | .002 |
| Favorable cytogenetics | 0.46 (0.27-0.80) | .006 | 0.46 (0.26-0.79) | .005 |
| Adverse cytogenetics | 1.92 (1.28-2.88) | .001 | 1.91 (1.29-2.84) | .001 |
| Secondary/t-AML | 2.21 (1.49-3.28) | <.001 | 2.43 (1.64-3.60) | <.001 |
| Continuous scores multivariate analysis 2 (P < .001)§ | Discretized scores multivariate analysis 2 (P < .001)§ | |||
| High score (research) | 1.07 (0.38-2.97) | .88 | 1.55 (1.01-2.38) | .04 |
| High score (clinical) | 4.96 (1.94-12.6) | <.001 | 2.09 (1.36-3.21) | <.001 |
| Age | 1.01 (0.99-1.02) | .06 | 1.00 (0.99-1.01) | .15 |
| WBC count | 1.00 (1.00-1.00) | .01 | 1.00 (1.00-1.00) | .004 |
| Favorable cytogenetics | 0.52 (0.30-0.90) | .02 | 0.51 (0.29-0.88) | .01 |
| Adverse cytogenetics | 1.71 (1.14-2.55) | .008 | 1.73 (1.16-2.57) | .006 |
| Secondary/tAML | 2.13 (1.44-3.15) | <.001 | 2.26 (1.52-3.36) | <.001 |
CI, confidence interval; t-AML, therapy-related AML.
Number of patients with full clinical annotations are shown.
The 95% CI is displayed for each hazard ratio calculated by means of the multivariate Cox regression analysis.
The P-values were calculated by means of the Wald test.
Inclusion of LSC17 scores measured by the clinical assay in multivariate model 2 significantly improves predictions of patient outcomes compared with multivariate model 1. P-values were calculated by means of the likelihood ratio test.
Specimen requirements and sample processing
To facilitate clinical adoption of the LSC17 LDT, we examined clinical and laboratory parameters to determine the acceptable sample types and optimal collection conditions for the assay. Most of the samples used in our original research study had been viably frozen after Ficoll separation. However, Ficoll separation and freezing are not generally part of the normal handling of clinical samples. We therefore tested the effects of these sample-processing variables on the LDT assay. To compare fresh vs frozen samples, we extracted RNA from 4 peripheral blood (PB) samples, before and after the samples had been frozen. LSC17 scores were nearly identical for fresh and frozen samples (Figure 3A). LSC17 scores also were highly similar for Ficoll-separated and unseparated bone marrow (BM) samples collected in EDTA (R = 0.95; P < .001; n = 41; Figure 3B), indicating that the Ficoll separation step does not affect the LSC17 score measurement.
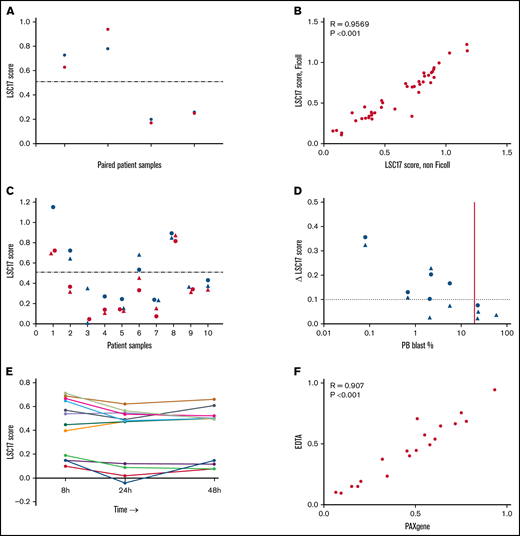
Measurement of LSC17 score under various sample collection and processing conditions. (A) Plot showing LSC17 scores measured in 4 PB samples processed either fresh (blue) or after being viably frozen and thawed (red). The dotted line represents the median LSC17 score (0.51). (B) Plot showing correlation between LSC17 score measured in Ficoll-separated and unseparated (non-Ficoll) BM samples from 41 patients with AML. (C) Plot showing LSC17 scores measured by the LDT in PB (blue) and BM (red) samples collected from 10 patients with AML at diagnosis. The dotted line represents the median LSC17 score. Patient samples are shown in order left to right by increasing PB blast percentage. Triangles, Ficoll-separated samples; circles, unseparated (non-Ficoll) samples. (D) Plot showing the difference (Δ) between paired PB and BM LSC17 scores compared with PB blast percentage. The horizontal dotted line indicates the extent of technical variation (Δ0.1 = 2 standard deviations); the vertical red line indicates the threshold (20% PB blasts) below which BM should be used as the sample source for the assay. (E) Plot showing LSC17 scores measured in 13 BM samples processed 8, 24, and/or 48 hours after collection. (F) Plot showing correlation between LSC17 scores measured in BM samples collected in EDTA tubes processed 8 hours after collection vs samples collected in PAXgene tubes and processed up to 5 days after collection. R, Spearman correlation coefficient.
Measurement of LSC17 score under various sample collection and processing conditions. (A) Plot showing LSC17 scores measured in 4 PB samples processed either fresh (blue) or after being viably frozen and thawed (red). The dotted line represents the median LSC17 score (0.51). (B) Plot showing correlation between LSC17 score measured in Ficoll-separated and unseparated (non-Ficoll) BM samples from 41 patients with AML. (C) Plot showing LSC17 scores measured by the LDT in PB (blue) and BM (red) samples collected from 10 patients with AML at diagnosis. The dotted line represents the median LSC17 score. Patient samples are shown in order left to right by increasing PB blast percentage. Triangles, Ficoll-separated samples; circles, unseparated (non-Ficoll) samples. (D) Plot showing the difference (Δ) between paired PB and BM LSC17 scores compared with PB blast percentage. The horizontal dotted line indicates the extent of technical variation (Δ0.1 = 2 standard deviations); the vertical red line indicates the threshold (20% PB blasts) below which BM should be used as the sample source for the assay. (E) Plot showing LSC17 scores measured in 13 BM samples processed 8, 24, and/or 48 hours after collection. (F) Plot showing correlation between LSC17 scores measured in BM samples collected in EDTA tubes processed 8 hours after collection vs samples collected in PAXgene tubes and processed up to 5 days after collection. R, Spearman correlation coefficient.
Most patients with newly diagnosed AML undergo BM aspiration. However, PB samples may be tested at diagnosis if the PB blast percentage is high or when a high-quality BM sample is not available. We therefore tested whether PB and BM samples from the same patient would yield similar LSC17 scores. We measured the LSC17 score from paired PB and BM samples that were collected from 10 patients in our validation cohort. PB and BM LSC17 scores agreed well (Figure 3C), although scores were more concordant when the PB blast percentage was high (Figure 3D). For the 3 samples with PB blast percentage >20%, the difference between the PB and BM scores was within the technical variation of the assay (ie, <0.1; Figure 1D). Thus, although the LSC17 score can be measured in either PB or BM samples, facilitating clinical application, BM should be used as the sample source in cases where the PB blast percentage is less than 20%.
In clinical practice, diagnostic laboratories may not be able to process samples immediately after collection. We therefore assessed whether time between sample collection and RNA extraction affected LSC17 score results. For 13 patients, BM samples were collected in EDTA tubes and left at 4°C for 8, 24, or 48 hours before RNA extraction. The LSC17 scores measured at all 3 extraction time points were similar (R > 0.762; P ≤ .01), with the magnitude of the difference in scores comparable to the between-run differences seen with replicate samples (mean difference in LSC17 score = 0.15; maximum = 0.23; Figure 3E). Scores for individual patients measured at different time points were identically classified.
In some cases, a sample may have to be transported from the clinical center where it is collected to a distant laboratory for measurement of the LSC17 score. To increase RNA stability in such cases, samples can be collected in PAXgene tubes (Qiagen), which are designed to preserve intracellular RNA. We therefore collected BM specimens for 19 patients in both PAXgene and EDTA tubes for comparison of resultant LSC17 scores. PAXgene samples were stored for up to 5 days at 4°C before RNA extraction, whereas samples collected in EDTA were processed after 8 hours. LSC17 scores between the 2 conditions correlated highly (R = 0.907; P < .001; Figure 3F). Based on these results, PAXgene tubes may be preferred for collection of samples that cannot be processed immediately, such as for reference laboratories that receive samples from distant sites.
Synthetic control development
We initially used validated patient samples as reference standards for the performance of the LSC17 assay. However, patient samples are not ideal controls for assay performance in the long term because of their limited supply. We therefore designed a synthetic plasmid control for the assay encompassing the 17 signature genes and the 12 housekeeping genes (supplemental Figure 1A). We used the synthetic control to evaluate the performance of individual probes in the LSC17 LDT, by testing 2 patient samples with known high and low LSC17 scores in parallel with the synthetic plasmid control over 9 consecutive runs. Performance across all 17 probes, as well as the housekeeping genes, was comparable (Figure 4A). The calculated LSC17 score of the patient samples and the synthetic control was highly reproducible over the 9 consecutive runs (Figure 4B). This synthetic control thus provides a sustainable and constant reference for performance of the LSC17 LDT over time.
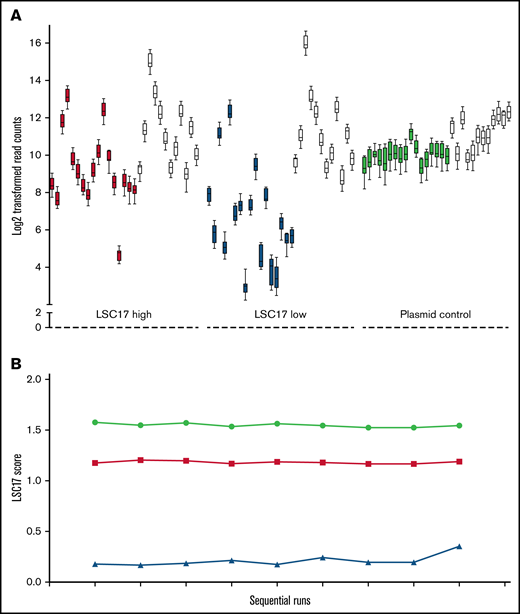
A synthetic plasmid control for the LSC17 LDT performs equivalently to patient RNA samples. (A) Box-and-whisker plots showing log2-transformed read counts for each of the 17 score genes (filled boxes) and the 12 housekeeping genes (white boxes) on 9 consecutive runs of the LSC17 LDT measured in a patient sample with high LSC17 score (red boxes), a patient sample with low LSC17 score (blue boxes), and the synthetic plasmid control (green boxes). Each box represents the replicate read counts from a single probe. (B) Plot showing the LSC17 scores calculated from the data shown in panel A (high LSC17 score, red; low LSC17 score, blue; synthetic control, green.
A synthetic plasmid control for the LSC17 LDT performs equivalently to patient RNA samples. (A) Box-and-whisker plots showing log2-transformed read counts for each of the 17 score genes (filled boxes) and the 12 housekeeping genes (white boxes) on 9 consecutive runs of the LSC17 LDT measured in a patient sample with high LSC17 score (red boxes), a patient sample with low LSC17 score (blue boxes), and the synthetic plasmid control (green boxes). Each box represents the replicate read counts from a single probe. (B) Plot showing the LSC17 scores calculated from the data shown in panel A (high LSC17 score, red; low LSC17 score, blue; synthetic control, green.
Establishment of the LSC17 LDT in an independent laboratory
The design of the LSC17 LDT is intended to facilitate broad implementation in independent molecular diagnostics laboratories. After successful validation of the clinical assay at PM, we collaborated with the Mayo Clinic (Rochester, MN) to establish the LSC17 score assay in their molecular hematopathology laboratory (MH Laboratory), a high-volume academic and reference laboratory testing facility. The Mayo Clinic MH Laboratory independently obtained reagents, including TagSets from NanoString Technologies and probe sets synthesized by IDT. The LSC17 LDT was run at the MH Laboratory following the standard protocol provided by the PM laboratory, with RNA inputs ranging from 100 to 200 ng.
A reciprocal sample analysis was performed to assess the reproducibility of LSC17 scores measured at the 2 sites. Twenty-four patient samples from PM and 36 patient samples from Mayo Clinic were tested at both sites, with RNA extraction performed independently at each site for each sample. LSC17 scores measured at PM and at Mayo Clinic MH Laboratory correlated highly (R = 0.981; P < .001; Figure 5A). Notably, the difference in scores measured at the 2 sites was quantitatively similar to the variation between runs in our single-site validation studies (Figure 1C-D), indicating that the assay was highly reproducible between laboratories. These results demonstrate that the LSC17 LDT is robust and can be easily implemented at independent clinical molecular testing facilities with high accuracy and precision.

Establishment of the LSC17 LDT in a second clinical diagnostic laboratory. (A) Plot showing correlation between LSC17 scores measured in 24 patient samples collected and processed at PM (red dots) and 36 patient samples collected and processed at Mayo Clinic (blue dots). Each sample was tested independently in the laboratories at both sites. The dotted line represents no difference between the paired score measurements. R, Spearman correlation coefficient. (B) Kaplan-Meier estimates of overall survival of 26 patients with AML from Mayo Clinic treated with intensive induction therapy, according to LSC17 score classified as high (above median) or low (below median) using the PM reference median score of 0.51.
Establishment of the LSC17 LDT in a second clinical diagnostic laboratory. (A) Plot showing correlation between LSC17 scores measured in 24 patient samples collected and processed at PM (red dots) and 36 patient samples collected and processed at Mayo Clinic (blue dots). Each sample was tested independently in the laboratories at both sites. The dotted line represents no difference between the paired score measurements. R, Spearman correlation coefficient. (B) Kaplan-Meier estimates of overall survival of 26 patients with AML from Mayo Clinic treated with intensive induction therapy, according to LSC17 score classified as high (above median) or low (below median) using the PM reference median score of 0.51.
Finally, we tested whether the median LSC17 score from our reference data set could be used to assess risk in Mayo Clinic patients. The LSC17 score was measured by the Mayo Clinic MH Laboratory for 45 diagnostic samples obtained from patients with AML for whom clinical follow-up data were available (supplemental Table 1). Of these, 26 patients were treated with intensive induction therapy (all but 1 with a 3 + 7 backbone) and were classified as having a high (n = 12) or low (n = 14) LSC17 score based on the PM reference median score of 0.51. Patients with a low LSC17 score had significantly better overall survival than patients with a high LSC17 score (hazard ratio, 4.19; 95% confidence interval, 1.10-15.9; P = .03; median survival, not reached vs 191 days, respectively, Figure 5B), confirming that stratification based on the median score of the reference data set provides a site-independent, technically reproducible assessment of risk for patients with AML at diagnosis.
Discussion
This study presents the first clinical development of a risk assessment tool based on an LSC gene expression signature. Our results establish the technical parameters for an LDT that measures the LSC17 score in AML at diagnosis and provide a stable and durable synthetic control for assay performance. We demonstrate the clinical predictive value of the assay based on a median score of 0.51 obtained from a reference data set. Importantly, we show that this clinical assay can be easily established at an independent test site with no loss of accuracy or precision. The design and optimization of this assay will allow for the LSC17 score to be used broadly as a clinical tool for risk assessment in patients with AML.
The LSC17 LDT has several characteristics that make it suitable for adoption in clinical laboratories. The LSC17 score can be reported on the second workday after a sample is received in the laboratory, thus providing upfront risk assessment in patients with newly diagnosed AML within a time frame equal to or better than current cytogenetic and molecular tests. The LSC17 LDT is also highly cost effective, as it can be run at a cost as low as US $200 per sample (reagent cost) assuming full-cartridge runs (11 samples plus control). Our studies indicate that the LSC17 LDT is robust to sample collection conditions that reflect real-world sample handling and collection, such as freeze/thaw and time between sample collection and RNA processing, with samples collected in PAXgene tubes producing accurate results with as much as 5 days between collection and processing. The development of a single high-quality synthetic control standard allows for monitoring of the stability of assay performance over time, with significant advantages over validated patient samples that are quickly exhausted or mixed oligonucleotide controls that are difficult to replicate accurately because of measurement and pipetting error.
Importantly, we have shown that the LSC17 LDT can be easily established in an independent laboratory setting. Expression signature assays such as the LSC17 score derive their clinical validity from testing cohorts of patients with known clinical outcomes after standardized treatment. In practice, it is very difficult to assemble an adequate clinical sample set to validate an assay de novo. Thus, the demonstration that the median score of the PM reference data set could be applied for risk stratification of the independent Mayo Clinic patient cohort obviates the need for independent laboratories to establish their own reference cohorts.
Because the LSC17 LDT does have some within- and between-run variability, it is necessary to interpret LSC17 scores near the median value with caution. Scores near the median value may be called “high” or “low” on different runs solely because of technical variability; thus it will be necessary to measure the between-run variability seen in a particular laboratory and to make the level of variation clear in reporting LSC17 scores. Reporting of the LSC17 score should incorporate a “gray zone” in which the distance from the median score is within technical variation of the assay. Reporting of the absolute LSC17 score will also be helpful to clinicians in interpretation of test results, by giving a sense of how close to the median value a patient’s score lies. However, it should be noted that clinical utility of the score has been established only for discretized scores classified as high or low based on the median of the reference data set. Of the 306 cases in our representative PM reference cohort, LSC17 scores in 55 (18%) fell within a gray zone defined as median ± 0.1 (ie, 0.41-0.61). Thus, in most cases, LSC17 scores can be unambiguously classified as high or low.
The LSC17 score has been clearly demonstrated to provide robust risk assessment beyond currently used systems, such as the European LeukemiaNet classification, for patients with newly diagnosed AML who receive standard induction chemotherapy.2,3 We have previously shown that patients with low LSC17 scores receive significant survival benefit from the addition of low fractionated doses of gemtuzumab ozogamicin to standard induction chemotherapy.2 With the development of a CAP/CLIA-certified LDT to measure the LSC17 score, such patients can now be identified soon after their AML diagnosis, allowing for the provision of gemtuzumab ozogamicin to the subset of patients who will benefit the most. Incorporation of the LSC17 score into clinical management of AML will also enable identification of high-risk patients who do poorly with standard induction and who may benefit from alternative upfront therapies or enrollment in clinical trials. The LSC17 score will also be of value in clinical trials as a correlative test to determine whether novel therapies are benefitting AML patients at highest risk. Wide availability of the LSC17 LDT has the potential to open up new approaches to AML care in both clinical and research settings.
Acknowledgments
The authors thank B. Basha for assistance in collecting the clinical data for the Mayo Clinic patient cohort.
This work was supported by grants from the Ontario Institute for Cancer Research with funds from the province of Ontario; the Cancer Stem Cell Consortium, with funding from the Government of Canada through Genome Canada and the Ontario Genomics Institute (OGI-047); the Canadian Institutes of Health Research (CSC-105367); Canadian Cancer Society; Terry Fox Foundation; a Canada Research Chair (J.E.D.); the Orsino Chair in Leukemia Research (M.D.M.), and a Collaborative Translational Cancer Research Grant from the Princess Margaret Cancer Centre (formerly Ontario Cancer Institute). This research was funded in part by the Leukemia and Lymphoma Society of Canada (493946) and the Stem Cell Network (492019), and the Ontario Ministry of Health and Long-Term Care (OMOHLTC). The views expressed do not necessarily reflect those of the OMOHLTC.
Authorship
Contribution: S.W.K.N., T.Z., and M. Mah worked with NanoString Technologies and IDT for codeset conversion from the standard to elements chemistry; T.Z. and M. Mah performed clinical sample quality control (QC), hybridization, and NanoString quantification of RNA samples from patients; A.M. provided instructions for control oligo storage and dilution strategy to AMDL; T. Murphy and S.C. coordinated the clinical data, sample collection and handling, and overall operational requirements for the LSC17 feasibility study; S.W.K.N. developed the bioinformatics workflow including the R code required for gene expression QC, processing, and normalization, as well as LSC17 score calculation, and applied the workflow to all study samples; Z.L., N.S., and C.V. implemented and documented the bioinformatics workflow at the PMCC with guidance from S.W.K.N., who performed statistical analyses and bioinformatics; M.D.M., T. Murphy, N.I., and A.A. provided access to AML samples, along with associated clinical annotations through the Leukemia Tissue Bank at Princess Margaret Cancer Centre/University Health Network; M. Mai worked with NanoString Technologies and IDT to obtain reagents and performed sample QC, hybridization and NanoString quantification of Mayo Clinic patient RNA samples; R.H. and D.S.V. coordinated clinical data, sample collection and storage, data analysis, and oversaw the operational requirements for the Mayo Clinic LSC17 studies; T. Mercer and B.S.M designed the synthetic controls and analyzed performance; S.W.K.N. and I.K. interpreted the data; J.C.Y.W. and T.S. supervised the study; J.E.D. and J.C.Y.W. obtained funding for the study; J.E.D supervised the work of S.W.K.N.; S.W.K.N., I.K.. and T. Murphy drafted the manuscript; and all authors reviewed and edited the manuscript.
Conflict-of-interest disclosure: J.E.D. has a sponsored research agreement with Celgene. There is an existing license agreement between Trillium Therapeutics Inc. and UHN, and J.E.D. and J.C.Y.W. may be entitled to receive financial benefits from this license and in accordance with UHN’s intellectual property policies.
Correspondence: Jean C. Y. Wang, University Health Network, 101 College St, MaRS PMCRT 8-363, Toronto, ON M5G 1L7, Canada; e-mail: jean.wang@uhnresearch.ca.

