

Key Points
PRMT5 is highly expressed in BPDCN, and pharmacological inhibition of PRMT5 activity disrupts splicing of key RNA methylation genes.
Depletion of METTL3 diminishes BPDCN cell response to PRMT5 inhibition due to elevated IFN signaling mediated via the IRF7-IFIT1 axis.

Abstract
Blastic plasmacytoid dendritic cell neoplasm (BPDCN) is a rare and aggressive hematologic malignancy with poor clinical outcomes. Dysregulated MYC expression, which is associated with protein arginine methyltransferase 5 (PRMT5) dependency, is a recurrent feature of BPDCN. Although recent studies have reported a PRMT5 gene signature in BPDCN patient samples, the role of PRMT5 in BPDCN remains unexplored. Here, we demonstrate that BPDCN is highly sensitive to PRMT5 inhibition. Consistent with the upregulation of PRMT5 in BPDCN, we show that pharmacological inhibition (GSK3326595) of PRMT5 inhibits the growth of the patient-derived BPDCN cell line CAL-1 in vitro and mitigated tumor progression in our mouse xenograft model. Interestingly, RNA-sequencing (RNA-seq) analysis revealed that PRMT5 inhibition increases intron retention in several key RNA methylation genes, including METTL3, which was accompanied by a dose-dependent decrease in METTL3 expression. Notably, the function of cellular m6A RNA modification of METTL3 was also affected by PRMT5 inhibition in CAL-1 cells. Intriguingly, METTL3 depletion in CAL-1 caused a significant increase in interferon (IFN) signaling, which was further elevated upon PRMT5 inhibition. Importantly, we discovered that this increase in IFN signaling attenuated the sensitivity of METTL3-depleted CAL-1 cells to PRMT5 inhibition. Correspondingly, stimulation of IFN signaling via TLR7 agonists weakened CAL-1 cell sensitivity to PRMT5 inhibition. Overall, our findings implicate PRMT5 as a therapeutic target in BPDCN and provide insight into the involvement of METTL3 and the IFN pathway in regulating the response to PRMT5 inhibition.
Introduction
Blastic plasmacytoid dendritic cell neoplasm (BPDCN) is a rare and clinically aggressive myeloid malignancy with a poor prognosis.1-3 BPDCN stems from transformed plasmacytoid dendritic cells (pDCs), which overexpress interleukin-3 receptor subunit α (IL3RA or CD123).1,4 This disease exhibits similar molecular characteristics to acute myeloid leukemia (AML) and myelodysplastic syndrome1 and hence has been often misdiagnosed. BPDCN is diagnosed based on the expression of specific surface markers (CD123, CD4, and CD56). The median survival of BPDCN patients is <2 years,2,3 and relapse is frequent despite high-dose chemotherapy and hematopoietic stem cell transplantation.3,5 In 2018, the US Food and Drug Administration approved tagraxofusp-erzs, a CD123-directed cytotoxin for BPDCN treatment.2,4,6 However, tagraxofusp-erzs has major adverse effects despite initial promising clinical outcomes.4,6 Hence, there is an urgent clinical need to discover novel therapeutic options for BPDCN.
Protein arginine methyltransferases (PRMTs) are ubiquitously expressed and serve as writers of arginine methylation, a type of posttranslational modification essential for the functional diversity of proteins.7-9 Nine PRMTs and 3 types of methylarginine species (ω-NG-monomethylarginine; ω-NG, NG-asymmetric dimethylarginine; and ω-NG, N’G-symmetric dimethylarginine [SDMA]) have been reported.7,9 PRMT5 is the major arginine methyltransferase that catalyzes SDMA on substrates, which contributes to its role in regulating diverse functions, including alternative splicing and cell proliferation.7,9-11 PRMT5 overexpression is often implicated in solid and hematologic malignancies,12-14 and its pharmacological inhibition was found to improve the prognosis of patients with AML and myelodysplastic syndrome.10,15
Transcriptionally, BPDCN patient samples and the patient-derived cell line (CAL-1) were found to exhibit a gene expression signature enriched for genes regulated by PRMT5, a key regulator of splicing.11,16 BPDCN patient samples were also shown to exhibit a gene signature for MYC targets and found to overexpress MYC.17 Interestingly, dysregulated MYC expression was reported to render B-cell lymphoma cells more dependent on PRMT5 for splicing fidelity maintenance.18 Furthermore, several splicing factors were found to be frequently mutated in BPDCN.19 Therefore, we hypothesize that PRMT5 is an important therapeutic target in BPDCN and contributes to the molecular pathogenesis of BPDCN.
In this study, we evaluated the role of PRMT5 in BPDCN, the potential of PRMT5 as a therapeutic target in BPDCN, and how the expression of methyltransferase-like protein 3 (METTL3), a writer of m6A modification on RNA,20-22 determines BPDCN cell response to PRMT5 inhibition. Overall, our findings have identified a new therapeutic target in BPDCN and uncovered a unique interconnection among PRMT5, METTL3, and interferon (IFN) signaling pathways, which has not been reported in hematological malignancies like BPDCN.
Materials and methods
Cell lines and cell culture
CAL-1, a BPDCN patient-derived cell line,23 was cultured as previously described.5,23 Leukemic cell lines were purchased from ATCC. All cell lines were cultured with RPMI1640 (Biowest), supplemented with 10% fetal bovine serum (FBS) (Biowest) and 1% antibiotic-antimycotic (Gibco). 293T cells were cultured in high-glucose Dulbecco's Modified Eagle Medium (Biowest), supplemented with 10% FBS and 1% penicillin-streptomycin (Gibco). Cells were cultured at 37°C in humidified conditions with 5% CO2.
Mice models
Male NOD SCID Gamma (NSG) mice at 7 to 8 weeks old purchased from The Jackson Laboratory were used for CAL-1 xenograft experiments. TET2 Δ/Δ P53 Δ/Δ DKO + MYC RUNX2 OE, a de novo BPDCN mouse model was generated by Kubota and colleagues (2019).5 RNA-sequencing (RNA-seq) data obtained from leukemic cells from this mouse model were used for gene expression analyses.
CAL-1 xenograft and drug treatment
CAL-1 xenografts were established as previously reported.24 Briefly, NSG mice were subcutaneously engrafted with 1 × 10⁶ of CAL-1 cells and resuspended in 1:1 phosphate-buffered saline/Matrigel (Corning) suspension. Engrafted mice were randomly assigned into control or treatment groups, and treatment commenced once tumors reached an average of 100 mm3. Mice in the treatment group received 150 mg/kg of GSK3326595 (Hy-101563l MedChemExpress) bidaily via oral gavage, while the control group received 0.5% methylcellulose. Weight, tumor growth, and overall mice condition were monitored daily until a humane endpoint. All experimental procedures were reviewed and approved by the Institutional Animal Care and Use Committee of the National University of Singapore.
Vectors and lentivirus infections
pLV-U6-hMETTL3, pLV-U6-hMETTL14, pLV-U6-hPRMT5, pLV-U6-hPRMT1, pLV-U6-hPRMT4 short hairpin RNA (shRNA) vectors and pLV-EF1A-FLAG/hPRMT5, METTL3 overexpressing vectors were designed and purchased from VectorBuilder. Lentiviruses were produced by cotransfecting 293Ts with shRNA vector and packaging plasmids using FuGENE 6 transfection reagent (Promega). Lentivirus supernatants were harvested and filtered before infecting CAL-1 cells via spin infection. Positively infected cells (GFP+ or mCherry+ cells) were isolated by fluorescence-activated cell sorting (FACS) 72 hours after infection.
CRISPR-CAS9 METTL3 knockout (KO)
CAL-1 cells were first transduced with FUCas9Cherry (#70182; Addgene) using the above-described lentivirus infection. METTL3 single guide RNA (sgRNA) sequences were obtained from GPP (Genetic Perturbation Platform) web portal (https://portals.broadinstitute.org/gpp/public/) and cloned into FgH1tUTG (#70183; Addgene). CAL-1 Cas9 cells were then infected with either NT, METTL3, or AAVS1 sgRNA plasmids, and double-positive cells (GFP+ and mCherry+) were isolated by FACS after 72 hours. METTL3 KO was induced with 3 µg/mL doxycycline (#24390-14-5; Sigma) for 48 hours. FUCas9Cherry and FgH1tUTG plasmids were gifts from Marco Herold (RRID: Addgene_70182 and RRID: Addgene_70183).
Western blotting
Cell pellets were lysed in 1× Laemmeli buffer and heated at 95°C. Lysates were then sonicated for protein extraction, and supernatants were quantified via bicinchoninic acid protein assay (Thermo Fisher Scientific). Protein was resolved by 4% to 20% gradient gels (Biorad) and transferred to polyvinylidene difluoride membranes. Blots were blocked with 5% bovine serum albumin and incubated overnight at 4°C with antibodies against PRMT5 (ab109451; Abcam), SDMA (13222S; Cell signaling), METTL3 (ab195352; Abcam), METTL14 (ABE1338; Millipore), cleaved caspase-3 (#9664; Cell signaling), c-MYC (#5605; Cell signaling), or β-Actin-HRP (A5441; Sigma). After washing, membranes were incubated with secondary antibodies for 1 hour at RT. Blots were developed using Western Lightning ECL Pro (Perkin Elmer) and imaged on Chemi-doc imaging system.
In vitro proliferation and viability assay
CAL-1 and AML cells were seeded at appropriate densities and treated with increasing concentrations of GSK3326595 (HY-101563; MedChemExpress), with dimethyl sulfoxide (DMSO) as control. Percentage viable and number of cells were determined using trypan blue exclusion and counted with an automated cell counter (Thermo Fisher Scientific). Cells were then harvested and pelleted down for protein and RNA analyses.
Annexin-V/hoechst assay
GSK3326595-treated cells were harvested and resuspended in annexin V binding buffer (#51-66121E; BD) and centrifuged. Pellets were resuspended in a suspension comprising annexin V-APC (A35110; Invitrogen) and Hoechst 33258 dye (H3569; Life Technologies), and apoptotic fraction was analyzed using FACS.
m6A enzyme-linked immunoassay (ELISA)
CAL-1 cells were harvested after GSK3326595 treatment and RNA was extracted. m6A ELISA (#185912; Abcam) was performed using 200 ng of RNA, according to the manufacturer’s protocol. Each biological replicate was done in triplicates, and 3 biological replicates were performed.
TLR7 agonists and GSK595 cotreatment
CAL-1 cells were seeded at a density of 6 × 10⁴/mL in a 6-well plate. Subsequent cells were stimulated with either resiquimod, gardiquimod, or imiquimod and treated with 0.31 and 5 µM of GSK3326595. Cells were concurrently harvested for downstream analyses and also stained for BPDCN markers for phenotypic analysis via FACS.
RNA extraction and gene expression analysis
RNA was extracted using RNeasy Micro or Mini kit (Qiagen) according to the manufacturer’s protocol, and complementary DNA (cDNA) was synthesized from extracted RNA using EVO Script Universal cDNA Master (#07912455001; Roche). PowerUp Sybr Green (#A25742; Invitrogen) was used for quantitative reverse transcription polymerase chain reaction (PCR) and was performed on the QuantStudio 3 Real-Time PCR system (Thermo Fisher Scientific). Primers used are listed in supplemental Table 1.
Analysis was performed using the comparative threshold cycle method (2 −ΔΔCt). Gene expression levels were normalized to housekeeping genes (Actin).
RNA-seq and analysis
Total RNA from GSK3326595-treated CAL-1 cells and METTL3 KO cells was extracted using TRIzol. Library preparation was performed using the Illumina TruSeq Stranded messenger RNA (mRNA) kit. NovaSeq6000 sequencer was used for 150 bp paired-end sequencing. RNA-seq data reads were mapped to the human hg38 genome, and differentially expressed genes (DEGs) between DMSO and GSK3326595-treated CAL-1 cells were identified using the following cutoff values: fold-change of 2 and an adjusted P value of .05. For splicing analysis, the difference in splice index was used to identify differential splicing events between DMSO and GSK3326595-treated CAL-1 cells. These differential splicing events were subsequently clustered into intron retention (IR), exon skipping, or cryptic splice based on the annotation from the University of California Santa Cruz Refseq library.
A similar approach was taken for the analysis of METTL3 KO cells, where DEGs between wild type (WT) and METTL3 KO were identified. Gene set enrichment was used to identify enriched gene sets between (1) DMSO and GSK3326595-treated CAL-1 and (2) WT and METTL3 KO. RNA-seq reads were mapped to transcript sequences of curated RefSeq (NM and NR transcripts) using salmon (version 1.4.0)25 with the options “–gcBias –seqBias –posBias.” The index file for the transcript sequences was created with default settings. Transcript-level read counts were converted to gene-level read counts using tximport (version 1.18.0).26 DEGs were estimated using DESeq2 (version 1.30.0).27,28
Splice variant expression analysis
cDNA was synthesized as described above and amplified by PCR using Go Taq G2 Hot Start Green Master Mix (M5122; Promega). Primers flanking the intron region of interest were designed based on sites identified from RNA-seq data (supplemental Table 1). Amplified products were resolved by agarose gel electrophoresis and visualized using Gel Doc XR+ system (Biorad).
Statistical analysis
All data are represented as mean ± standard deviation unless otherwise stated. Number of biological replicates are included in figure legends. Statistical analyses were calculated using Student 2-tailed paired t test.
Results
PRMT5 is essential in BPDCN, and pharmacological inhibition of PRMT5 induces apoptosis and mitigates tumor growth
To evaluate the potential of PRMT5 as a therapeutic target in BPDCN, we first analyzed PRMT5 and MYC mRNA expression in BPDCN cells and normal healthy donor pDCs. Compared with the pDCs, PRMT5 and MYC levels were significantly elevated in BPDCN patient-derived cell lines (CAL-1 and Gen2.2) (Figure 1A). Similarly, analysis of PRMT5 levels from RNA-seq data obtained from a previously established murine BPDCN model (Tet2 Δ/Δ;Trp53 Δ/Δ double KO with Myc and Runx2 overexpression)5 showed elevated expression compared with normal mouse pDCs (Figure 1B). These show that PRMT5 is highly expressed in BPDCN cells.
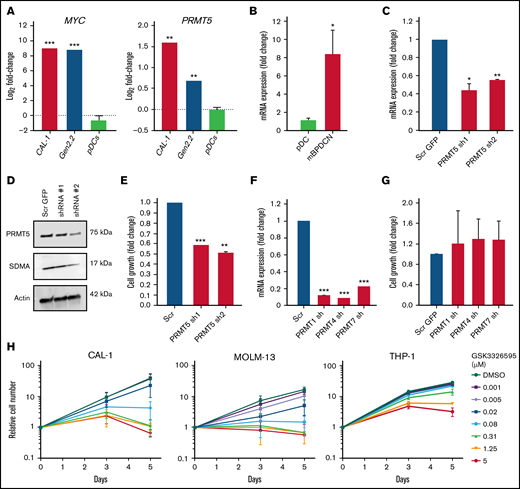
PRMT5 is highly expressed in BPDCN, and its inhibition perturbs cell growth. (A) BPDCN cell lines (CAL-1 and Gen2.2) express elevated levels of MYC and PRMT5 as compared with healthy pDCs. (B) High levels of PRMT5 in de novo BPDCN mouse model (TET2 Δ/Δ P53 Δ/Δ DKO + MYC RUNX2 OE). (C) mRNA and (D) protein expression of PRMT5 after 72 hours of shRNA KD. (E) Growth of CAL-1 after PRMT5 KD, cell counts normalized to scrambled. (F) mRNA expression of PRMTs, 72 hours after shRNA KD. (G) Growth of CAL-1 after PRMT1, 4, or 7 KD, cell counts normalized to scrambled. (H) A dose-dependent decrease in CAL-1, MOLM-13, and THP-1 growth 72 hours after GSK595 treatment. Data are shown as mean ± standard error of the mean of 3 independent experiments. *P < .05; **P < .01; ***P < .001.
PRMT5 is highly expressed in BPDCN, and its inhibition perturbs cell growth. (A) BPDCN cell lines (CAL-1 and Gen2.2) express elevated levels of MYC and PRMT5 as compared with healthy pDCs. (B) High levels of PRMT5 in de novo BPDCN mouse model (TET2 Δ/Δ P53 Δ/Δ DKO + MYC RUNX2 OE). (C) mRNA and (D) protein expression of PRMT5 after 72 hours of shRNA KD. (E) Growth of CAL-1 after PRMT5 KD, cell counts normalized to scrambled. (F) mRNA expression of PRMTs, 72 hours after shRNA KD. (G) Growth of CAL-1 after PRMT1, 4, or 7 KD, cell counts normalized to scrambled. (H) A dose-dependent decrease in CAL-1, MOLM-13, and THP-1 growth 72 hours after GSK595 treatment. Data are shown as mean ± standard error of the mean of 3 independent experiments. *P < .05; **P < .01; ***P < .001.
We next analyzed the effect of PRMT5 inhibition in CAL-1 cells, a MYC-dependent BPDCN patient-derived cell line.23 Genetic knockdown (KD) of PRMT5 using 2 independent shRNA successfully reduced PRMT5 expression at mRNA and protein levels in CAL-1 cells (Figure 1C-D). Notably, PRMT5 KD significantly suppressed CAL-1 cell growth by ∼50% to 60% (Figure 1E). In contrast, KD of other PRMT family members (PRMT1, PRMT4, and PRMT7) (Figure 1F) had no significant impact on CAL-1 cell growth (Figure 1G). Importantly, overexpression of PRMT5 before shRNA-mediated PRMT5 KD rescued the decrease in CAL-1 cell growth, thus excluding the possibility of off-target KD (supplemental Figure 1A-D). These illustrate that PRMT5 is specifically essential for BPDCN cell growth.
We then assessed the sensitivity of BPDCN to pharmacological inhibition of PRMT5 by comparing the response between CAL-1 and 3 AML cell lines (THP-1, MOLM-13, and MV-4-11) to treatment with the well-characterized PRMT5 inhibitor GSK3326595 (GSK595).15 GSK595 is a highly selective and potent small-molecule inhibitor of PRMT5, which binds to the catalytic site of PRMT5. This results in inhibition of the methyltransferase activity of PRMT5, causing a decrease in SDMA modifications on downstream targets.7,15 Compared with THP-1, which is relatively resistant to PRMT5 inhibition,29 the growth IC50 (gIC50) of CAL-1 was ∼30-fold lower (Figure 2A). Notably, the sensitivity of CAL-1 to GSK595 was comparable to MOLM-13 (Figure 2A), which was previously shown to be highly sensitive to PRMT5 inhibition.29 In agreement, GSK595 induced net cell death in CAL-1 and MOLM-13 cells, but not THP-1, at concentrations above 0.31 µM over 5 days (Figure 1H).

Pharmacological inhibition of PRMT5 induces apoptosis and mitigates tumor growth. (A) Treatment of BPDCN (CAL-1) and AML (THP-1, MOLM-13, MV-4-11) cells with GSK3326595. Decrease in (B) PRMT5 and (C) MYC mRNA expression after 72 hours of treatment. (D) Reduction in SDMA levels upon GSK595 treatment. (E) A dose-dependent increase in apoptotic fraction after treatment. (F) Expression of anti (BCL-2) and proapoptotic (PUMA) genes in GSK595-treated CAL-1 cells, normalized to DMSO. (G) Schematic illustration of treatment regimen (created with BioRender.com) (H) Decrease in tumor volume in GSK595-treated mice compared with vehicle-treated. (I) Loss of SDMA expression in tumors harvested from treated mice. (J) Mice body weight upon treatment with vehicle or GSK595. Data are shown as mean ± standard error of the mean of 3 independent experiments. *P < .05; **P < .01; ***P < .001.
Pharmacological inhibition of PRMT5 induces apoptosis and mitigates tumor growth. (A) Treatment of BPDCN (CAL-1) and AML (THP-1, MOLM-13, MV-4-11) cells with GSK3326595. Decrease in (B) PRMT5 and (C) MYC mRNA expression after 72 hours of treatment. (D) Reduction in SDMA levels upon GSK595 treatment. (E) A dose-dependent increase in apoptotic fraction after treatment. (F) Expression of anti (BCL-2) and proapoptotic (PUMA) genes in GSK595-treated CAL-1 cells, normalized to DMSO. (G) Schematic illustration of treatment regimen (created with BioRender.com) (H) Decrease in tumor volume in GSK595-treated mice compared with vehicle-treated. (I) Loss of SDMA expression in tumors harvested from treated mice. (J) Mice body weight upon treatment with vehicle or GSK595. Data are shown as mean ± standard error of the mean of 3 independent experiments. *P < .05; **P < .01; ***P < .001.
We then confirmed that the growth inhibition of CAL-1 by GSK595 was associated with a dose-dependent reduction in PRMT5 (Figure 2B) and MYC expression (Figures 2C and 3G), accompanied by a decrease in the functional activity of PRMT5 (ie, SDMA modification) (Figure 2D). Importantly, PRMT5 inhibition induced significant apoptosis, reflected by increased levels of the apoptosis marker cleaved caspase-3 (Figure 2D) and an increased proportion of annexin-V–positive cells (Figure 2E). This was also accompanied by reduced expression of the antiapoptotic gene BCL-2 and increased expression of the proapoptotic gene PUMA (Figure 2F).

PRMT5 inhibition causes increased IR in genes associated with RNA methylation. (A) Increase in IR events in the treated group compared to the DMSO control group. (B) Biological processes are overrepresented among genes with increased IR. (C) GSEA plots illustrating gene sets affected by GSK595 treatment. (D) Decrease in expression of genes associated with RNA methylation after treatment with GSK595 (0.31 and 5 µM). (E) A dose-dependent increase in IR transcripts of METTL3 after PRMT5 inhibition. Decrease in (F) mRNA expression of PRMT5 and METTL3 (normalized to DMSO) and (G) protein levels of PRMT5, METTL3, MYC, and cleaved caspase-3 after GSK595 treatment. (H) Dose-dependent reduction in m6A activity in treated cells normalized to DMSO. Data are shown as mean ± standard error of the mean of 3 independent experiments. *P < .05; **P < .01. GSEA, gene set enrichment.
PRMT5 inhibition causes increased IR in genes associated with RNA methylation. (A) Increase in IR events in the treated group compared to the DMSO control group. (B) Biological processes are overrepresented among genes with increased IR. (C) GSEA plots illustrating gene sets affected by GSK595 treatment. (D) Decrease in expression of genes associated with RNA methylation after treatment with GSK595 (0.31 and 5 µM). (E) A dose-dependent increase in IR transcripts of METTL3 after PRMT5 inhibition. Decrease in (F) mRNA expression of PRMT5 and METTL3 (normalized to DMSO) and (G) protein levels of PRMT5, METTL3, MYC, and cleaved caspase-3 after GSK595 treatment. (H) Dose-dependent reduction in m6A activity in treated cells normalized to DMSO. Data are shown as mean ± standard error of the mean of 3 independent experiments. *P < .05; **P < .01. GSEA, gene set enrichment.
We next evaluated the in vivo efficacy of PRMT5 inhibition on BPDCN. We established a mouse xenograft model by subcutaneously injecting CAL-1 cells into NSG mice and then orally administered either GSK595 (150 mg/kg body weight) or vehicle (0.5% methylcellulose) bidaily (Figure 2G). Notably, drug treatment suppressed tumor growth at day 6, as shown by the significantly reduced tumor volume in GSK595-treated mice compared with vehicle-treated mice (Figure 2H). This was associated with in vivo target inhibition, as shown by the decreased levels of SDMA-modified proteins in tumors harvested from GSK595-treated mice (Figure 2I). GSK595 was also well-tolerated, with minimal changes in body weight throughout the treatment period (Figure 2J). Taken together, these findings indicate that PRMT5 activity is essential for the growth and survival of MYC-driven BPDCN and suggest that PRMT5 is a potential therapeutic target in BPDCN.
PRMT5 inhibition causes increased IR in genes associated with RNA methylation
To elucidate the molecular mechanisms underlying the observed cell growth inhibition of MYC-driven BPDCN cells upon PRMT5 inhibition, we performed a transcriptome analysis of GSK595-treated CAL-1 cells. Consistent with prior reports on the role of PRMT5 in regulating RNA splicing,11,14,29 -31 PRMT5 inhibition in CAL-1 cells was associated with a significant increase in IR events (Figure 3A). Intriguingly, we found that biological processes associated with DNA repair, cell division, and RNA methylation were significantly overrepresented among these upregulated IR events (Figure 3B).
These observations prompted us to focus our investigation on RNA methylation. Correspondingly, gene set enrichment with curated gene sets demonstrated that the target genes of METTL14, a core component of the m6A methyltransferase complex, were found to be coordinately downregulated in GSK595-treated CAL-1 cells (Figure 3C). METTL14 forms the Methyltransferase complex (MTC) together with METTL3, and the MTC is responsible for performing m6A modification on mRNAs.21,32,33 Although METTL14 expression was not significantly changed in CAL-1 cells after GSK595 treatment, the catalytic component of the MTC, namely METTL3, was significantly downregulated (Figure 3D,F). Strikingly, GSK595 treatment was associated with a dose-dependent increase in METTL3 IR events in CAL-1 cells (Figure 3E), corroborating the in silico observation of increased IR events in GSK595-treated CAL-1 cells. In agreement with evidence indicating that IR events generally reduce protein expression,30 we also observed a corresponding dose-dependent decrease in METTL3 protein levels in GSK595-treated CAL-1 cells (Figure 3G).
To determine if dysregulated METTL3 expression caused by PRMT5 inhibition affects cellular RNA modification function, we performed an ELISA-based assay using RNA from GSK595-treated CAL-1 cells and found that the levels of m6A RNA modification decreased in a dose-dependent manner (Figure 3H). Therefore, these findings indicate that PRMT5 inhibition in BPDCN perturbs RNA splicing of the METTL3 gene, which in turn affects multiple biological processes, including cellular m6A RNA methylation.
METTL3 depletion attenuates the effect of PRMT5 inhibition on BPDCN cells
Given the above findings, we next sought to understand the requirement of m6A RNA methylation in MYC-driven BPDCN cells. Notably, shRNA-mediated KD of METTL3 or METTL14 significantly affected CAL-1 cell growth (Figure 4A-B). Interestingly, KD of METTL3 affected the expression of METTL14 and vice versa (Figure 4A). As both these genes are key components in the MTC,34 we speculate that targeting one component affects the expression of the other. Next, we used a doxycycline-inducible CRISPR-CAS9 system as validation and observed that CAL-1 cell growth was significantly suppressed upon METTL3 KO (Figure 4C-E). These observations indicate that m6A RNA methylation machinery is likely required for the growth of MYC-driven BPDCN cells.

METTL3 depletion attenuates the effect of PRMT5 inhibition on BPDCN cells. (A) Reduction in mRNA expression of METTL3 and METTL14 after 72 hours of shRNA KD (normalized to NT). (B) CAL-1 cell growth after 72 hours shRNA KD, normalized to NT. (C) Expression of METTL3 upon KO induction with 2 independent METTL3 sgRNAs (72 hours, 3 µg/mL Dox). (D) mRNA expression of METTL3, 72 hours after Dox induction, normalized to NT. (E) CAL-1 cell growth after METTL3 KO (72 hours, 3 µg/mL Dox), normalized to noninduced. (F) mRNA expression of PRMT5 and METTL3 in GSK595-treated KO cells. (G) Cell growth of CAS9 and METTL3 KO cells after GSK595 treatment, normalized to DMSO. (H) Lack of cleaved caspase-3 activation upon treatment in KO cells only. (I) mRNA expression of PUMA in GSK595-treated KO cells. (J) Quantification of the apoptotic fraction. Data are shown as mean ± standard error of the mean of 3 independent experiments. *P < .05; **P < .01; ***P < .001.
METTL3 depletion attenuates the effect of PRMT5 inhibition on BPDCN cells. (A) Reduction in mRNA expression of METTL3 and METTL14 after 72 hours of shRNA KD (normalized to NT). (B) CAL-1 cell growth after 72 hours shRNA KD, normalized to NT. (C) Expression of METTL3 upon KO induction with 2 independent METTL3 sgRNAs (72 hours, 3 µg/mL Dox). (D) mRNA expression of METTL3, 72 hours after Dox induction, normalized to NT. (E) CAL-1 cell growth after METTL3 KO (72 hours, 3 µg/mL Dox), normalized to noninduced. (F) mRNA expression of PRMT5 and METTL3 in GSK595-treated KO cells. (G) Cell growth of CAS9 and METTL3 KO cells after GSK595 treatment, normalized to DMSO. (H) Lack of cleaved caspase-3 activation upon treatment in KO cells only. (I) mRNA expression of PUMA in GSK595-treated KO cells. (J) Quantification of the apoptotic fraction. Data are shown as mean ± standard error of the mean of 3 independent experiments. *P < .05; **P < .01; ***P < .001.
To study how METTL3 depletion influences CAL-1 cell response to PRMT5 inhibition, we induced METTL3 KO with doxycycline and simultaneously treated the cells with GSK595. Similar to PRMT5 inhibition, we observed a dose-dependent decrease in the expression of PRMT5, METTL3, and c-MYC (Figure 4F,H). Surprisingly, METTL3 KO cells were approximately 30% to 40% less sensitive to GSK595 as compared with nontargeting (NT; scramble sgRNA) controls (Figure 4G). Correspondingly, GSK595-induced apoptosis of CAL-1 cells was suppressed upon METTL3 KO; as evidenced by the reduced levels of cleaved caspase-3 (Figure 4H), reduced PUMA expression (Figure 4I), and lower proportion of annexin-V–positive cells (Figure 4J). Taken together, these results indicate that METTL3 depletion attenuates the sensitivity of MYC-driven BPDCN cells to PRMT5 inhibition.
Loss of METTL3 induces IFN signaling upon PRMT5 inhibition
To elucidate the mechanisms underlying this unique phenomenon, we analyzed the transcriptomes of METTL3-depleted CAL-1 cells in the presence and absence of GSK595 by RNA-seq. Analysis of the DEGs between METTL3 WT (noninduced) and METTL3 KO (Dox-induced) CAL-1 cells revealed that upregulated DEGs in METTL3-depleted cells were highly enriched for genes associated with the IFN-α and IFN-γ response pathways (Figure 5A). In addition, among the DEGs between METTL3 KO and WT control cells, we observed that several IFN-associated genes such as OAS1, OAS2, and IFIT1 were highly and significantly upregulated in METTL3-depleted CAL-1 cells (Figure 5B). In agreement, a comparison of IFN signaling-associated genes across 4 settings (METTL3 WT cells treated with DMSO, METTL3 WT cells treated with GSK595, METTL3 KO cells treated with DMSO, and METTL3 KO cells treated with GSK595) revealed an upregulation of multiple IFN-associated genes upon METTL3 KO (Figure 5C). Notably, the expression of these IFN-associated genes was further upregulated in GSK595-treated METTL3 KO cells (Figure 5C). This compelled further investigation into the IFN signaling pathway and how this regulates response to PRMT5 inhibition.
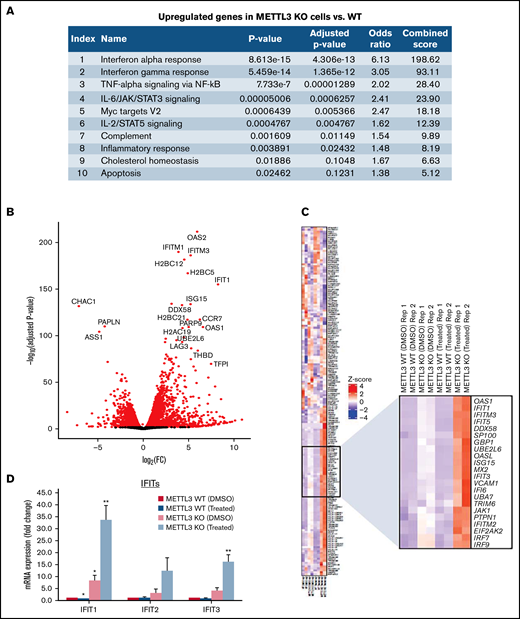
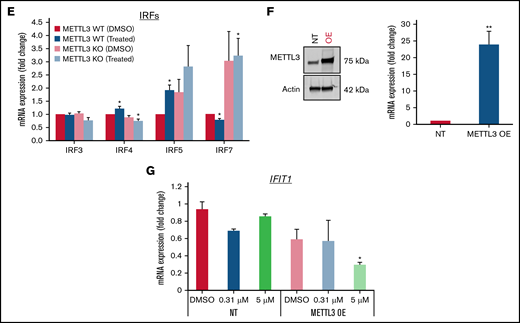
Loss of METTL3 induces IFN signaling upon PRMT5 inhibition. (A) Enriched pathways within upregulated genes in KO cells (analyzed using “Enrichr”; https://maayanlab.cloud/Enrichr/). (B) Volcano plot depicting up and downregulated genes upon METTL3 KO. (C) Heatmap showing the expression pattern of IFN pathway signaling genes. Z-scores were calculated for each gene using DESeq2 normalized counts. Gene expression clustering was performed using the Euclidean distance and complete linkage method. mRNA expression of (D) IFIT genes and (E) IRFs in WT, METTL3 KO - DMSO and GSK595-treated cells (normalized to WT DMSO). (F) Validation of METTL3 overexpression in CAL-1 cells. (G) Expression of IFIT1 in WT and METTL3 OE cells after GSK595 treatment. Data are shown as mean ± standard error of the mean of 3 independent experiments. *P < .05; **P < .01; P < .001.
Loss of METTL3 induces IFN signaling upon PRMT5 inhibition. (A) Enriched pathways within upregulated genes in KO cells (analyzed using “Enrichr”; https://maayanlab.cloud/Enrichr/). (B) Volcano plot depicting up and downregulated genes upon METTL3 KO. (C) Heatmap showing the expression pattern of IFN pathway signaling genes. Z-scores were calculated for each gene using DESeq2 normalized counts. Gene expression clustering was performed using the Euclidean distance and complete linkage method. mRNA expression of (D) IFIT genes and (E) IRFs in WT, METTL3 KO - DMSO and GSK595-treated cells (normalized to WT DMSO). (F) Validation of METTL3 overexpression in CAL-1 cells. (G) Expression of IFIT1 in WT and METTL3 OE cells after GSK595 treatment. Data are shown as mean ± standard error of the mean of 3 independent experiments. *P < .05; **P < .01; P < .001.
It is noteworthy that PRMT5 has been reported to regulate IFN signaling, whereas SDMA modification supports the upregulation of IFN stimulated genes, including the IFIT gene family.35 Thus, we examined the expression of various IFIT gene family members. In particular, IFIT1 was significantly upregulated upon METTL3 KO (Figure 5D), and its expression further increased after GSK595 treatment (Figure 5C-D). Importantly, IFIT1 upregulation was not observed upon doxycycline induction of NT scramble sgRNA (supplemental Figure 2A). To clarify the relationship between IFN response and METTL3 in the context of PRMT5 inhibition, we next examined the key transcriptional regulators of IFIT1.36-38 Among the various IRF genes which regulate IFIT1, IRF7 was found to be predominantly expressed by pDCs, as compared with other immune cell types (supplemental Figure 3A) and was reported to be upregulated in colorectal cancer upon METTL3 depletion.39 In agreement, we found that IRF7, but not the other IRF family members, was significantly upregulated after METTL3 KO and GSK595 treatment (Figure 5E). In contrast, IRF7 was not upregulated upon doxycycline induction of NT scramble sgRNA (supplemental Figure 2B). To corroborate these results, we overexpressed METTL3 in CAL-1 cells (Figure 5F) and observed that METTL3 overexpression suppressed IFIT1 expression, which was further reduced upon GSK595 treatment (Figure 5G).
We further verified the specificity of METTL3 KO on IFN signaling via KO of the safe harbor locus AAVS1. Unlike METTL3 KO, AAVS1 KO in CAL-1 did not suppress cell growth (supplemental Figure 2C-D). Instead, there was a dose-dependent decrease in cell growth of AAVS1 KO cells in response to GSK595 treatment (supplemental Figure 2E). Unexpectedly, we observed an upregulation of IRF7 and IFIT1 upon AAVS1 KO (supplemental Figure 2F-G). However, in contrast to METTL3 KO (Figure 5D-E), the expression of IFIT1 and IRF7 in AAVS1 KO cells was significantly suppressed upon GSK595 treatment (supplemental Figure 2F-G). Taken together, this suggests that the observed effect of METTL3 KO on the IFN pathway is distinct from any potential nonspecific effects associated with doxycycline-induced targeting.
Therefore, our findings indicate that activated IFN signaling confers resistance to PRMT5 inhibition in METTL3-depleted BPDCN cells and that this is potentially mediated by the upregulation of prominent IFN stimulated genes like IFIT1 and IRF7.
Stimulation with TLR7 agonist impairs CAL-1’s response GSK595
Based on these results, we hypothesized that loss of METTL3 relieves the inhibition of IRF7 to promote transcriptional upregulation of IFIT1, which then results in increased IFN signaling. This increase in IFN response could be mediating resistance to PRMT5 inhibition due to an elevation in proinflammatory cytokines. To test this hypothesis, we administered TLR7 agonists to CAL-1 cells and examined if this renders CAL-1 cells less responsive to GSK595 treatment. We first verified the degree to which the various TLR7 agonists resiquimod (TLR7/8), gardiquimod (TLR7), and imiquimod (TLR7) stimulated IFN signaling in CAL-1 by measuring the changes in IFIT1 and IRF7 expression after stimulation (supplemental Figure 3B-C). From this, we chose imiquimod for further downstream analyses as it increased the expression of IFIT1 and IRF7 specifically in a dose-dependent manner (Figure 6A-B).
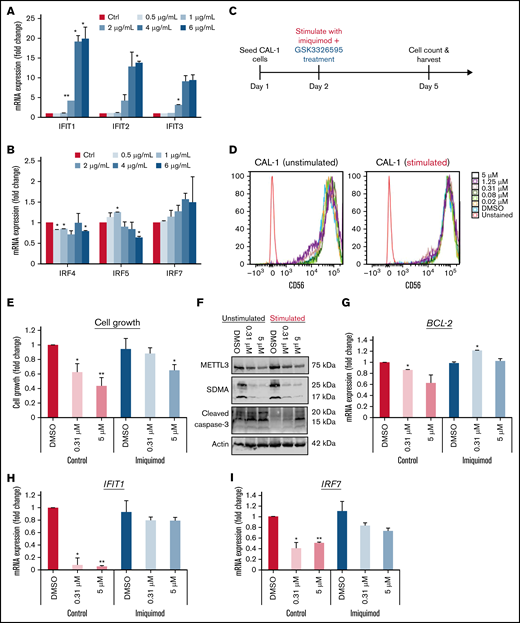
Stimulation with TLR7 agonist impairs the response of CAL-1 to GSK3326595. Gene expression of (A) IFITs and (B) IRFs after stimulation with imiquimod. (C) Schematic illustration of the dual treatment regimen. (D) Phenotypic analysis of BPDCN surface markers after dual treatment (imiquimod + GSK595). (E) CAL-1 growth after stimulation with imiquimod and concurrent treatment with GSK595. (F) Lack of apoptosis activation upon treatment in imiquimod-stimulated cells. Gene expression of (G) BCL-2, (H) IFIT1, and (I) IRF7 after imiquimod stimulation and GSK595 treatment (normalized to WT DMSO). Data are shown as mean ± standard error of the mean of 3 independent experiments. *P < .05; **P < .01; P < .001.
Stimulation with TLR7 agonist impairs the response of CAL-1 to GSK3326595. Gene expression of (A) IFITs and (B) IRFs after stimulation with imiquimod. (C) Schematic illustration of the dual treatment regimen. (D) Phenotypic analysis of BPDCN surface markers after dual treatment (imiquimod + GSK595). (E) CAL-1 growth after stimulation with imiquimod and concurrent treatment with GSK595. (F) Lack of apoptosis activation upon treatment in imiquimod-stimulated cells. Gene expression of (G) BCL-2, (H) IFIT1, and (I) IRF7 after imiquimod stimulation and GSK595 treatment (normalized to WT DMSO). Data are shown as mean ± standard error of the mean of 3 independent experiments. *P < .05; **P < .01; P < .001.
Next, we treated CAL-1 cells with imiquimod (6 µg/mL) and GSK595 (0.31 and 5 µM) concurrently (Figure 6C). To investigate if cotreatment (GSK595 + imiquimod) promotes terminal differentiation, we analyzed the surface expression of CD56, which is a key marker of pDC differentiation that is also known to be highly expressed in reactive pDCs.40 No significant change in CD56 expression was observed across treatment conditions (Figure 6D), suggesting that imiquimod and GSK595 treatment does not affect the differentiation or activation status of BPDCN cells.
Notably, stimulation with imiquimod attenuated GSK595-mediated growth suppression of CAL-1 cells (Figure 6E). Correspondingly, imiquimod stimulation suppressed GSK595-induced apoptosis, as evidenced by the lower cleaved caspase-3 levels (Figure 6F) and higher antiapoptotic BCL-2 expression (Figure 6G). Importantly, the attenuated effect of PRMT5 inhibition on CAL-1 cells was associated with increased IFIT1 (Figure 6H) and IRF7 (Figure 6I) expression relative to nonstimulated CAL-1 cells. Taken together, these results support our hypothesis that increased IFN signaling due to the absence of METTL3 attenuates the response of MYC-driven BPDCN to PRMT5 inhibition.
Discussion
BPDCN is a rare hematologic malignancy of unmet clinical need. The treatment of BPDCN remains a challenge, and consensus on an ideal therapeutic approach remains to be defined. In this study, we demonstrate the therapeutic potential of PRMT5 inhibition in BPDCN. We also identify m6A RNA modification as a downstream process modulated by PRMT5 via splicing and show that METTL3 is crucial for BPDCN sensitivity to PRMT5 inhibition.
MYC expression status is a clinically relevant feature in BPDCN. The overexpression of MYC in BPDCN has been attributed to MYC rearrangement,41 which is a recurrent cytogenetic abnormality with a prevalence of between 4% and 38%, depending on the population.42 Since MYC rearrangement has been associated with poor prognosis,17,43 such patients may benefit from novel therapeutic options. Previous studies have clarified the functional importance of MYC rearrangement and overexpression in BPDCN.5 In agreement, we observed that GSK595-mediated cell growth inhibition was associated with a dose-dependent reduction in MYC expression. Paradoxically, a reduction in MYC expression upon METTL3 KO was instead associated with an attenuated response to PRMT5 inhibition. Thus, our findings suggest that MYC overexpression and perhaps proliferative status, in general, may be a key determinant of BPDCN response to treatment with PRMT5 inhibitors. As such, further studies on the sensitivity of different BPDCN subsets to PRMT5 inhibition are warranted. Nonetheless, given that our study employed a patient-derived cell line that harbors the t(6;8) (p21;q24) MYC rearrangement,5,23 our findings may be generalized to BPDCN with MYC rearrangement and overexpression.
RNA modification has the potential to influence clinical outcomes in hematologic cancers. Apart from AML,33 the therapeutic significance of m6A RNA modification in other hematologic malignancies remain largely unexplored to date. Interestingly, we discovered that PRMT5 inhibition led to a loss of splicing fidelity and reduced expression of METTL3, a core component of the MTC that catalyzes m6A modification,21,44,45 with a consequent reduction in m6A levels. In line with reports on the role of METTL3 in myeloid differentiation and promoting the proliferation of leukemic stem cells,33,45 we also show that BPDCN cell growth requires METTL3.
Intriguingly, our findings indicate that METTL3-depleted BPDCN cells are less sensitive to PRMT5 inhibition and reveal that upregulation of IFN signaling upon METTL3 depletion contributes to this reduced sensitivity. In agreement, METTL3 has been reported to negatively regulate IFN signaling in other cancer models via m6A modification of IFN target transcripts.46 Interestingly, PRMT5 is also known to regulate IFN signaling, particularly in activated immune cells, where it is required for induction of IFN responses.35 Thus, METTL3 and PRMT5 have opposing roles in the regulation of IFN signaling. Taken together, our findings showcase how altered RNA modification may influence cellular response to PRMT5 inhibition due to modulation of IFN signaling.
Recurrent mutations in BPDCN are of potential clinical relevance to therapy with PRMT5 inhibitors. Loss-of-function mutations in the epigenetic modifier TET2 are the most frequent mutations in BPDCN.16,19,47 -49 In pDCs, TET2 was shown to promote IRF7 expression and IFN production, while TET2 loss disrupted splicing and conferred a growth advantage.19,50 Since CAL-1 harbors a TET2 loss-of-function mutation,23 our findings suggest that TET2-mutant BPDCN is susceptible to PRMT5 inhibition, which may act by disrupting splicing and/or IFN signaling below the threshold required for BPDCN cell survival.
Splicing factors are another class of genes frequently mutated in BPDCN.19 A recent study on BPDCN showed that mutations in the splicing factors ZRSR2, SRSF2, and SF3B1 were associated with IR and impaired expression of IRF7.19 Togami and colleagues recently reported the occurrence of IRF7 IR in ZRSR2-mutant BPDCN cells.19 Likewise, we detected the same IR event and reduced expression of IRF7 upon PRMT5 inhibition, which suggests that IRF7 expression is sensitive to splicing perturbations. The effect of impaired IRF7 expression on BPDCN sensitivity to the dual TLR7/TLR8 agonist R848 (resiquimod) appears to be context-dependent. In ZRSR2-mutant BPDCN, impaired IRF7 expression was associated with reduced pDC activation and resistance to R848-induced apoptosis. In contrast, we did not observe a significant impact on CAL-1 viability upon treatment with the TLR7-selective agonist imiquimod. This difference in sensitivity to TLR agonists may be attributed to a difference in agonistic activity between resiquimod (R848) and imiquimod. In our study, resiquimod concentrations as low as 0.5 to 1 µg/mL induced a 60-fold increase in IFIT1 expression (supplemental Figure 2Bi), while there was a 2.5-fold increase in IRF7 expression (supplemental Figure 2Ci). In comparison, 6 µg/mL imiquimod only induced a 20-fold increase in IFIT1 expression (supplemental Figure 2Biii), which better corresponds to the IFIT1 levels observed upon METTL3 depletion (Figure 5D). Thus, the difference in BPDCN cell sensitivity to TLR agonists may be related to the significantly greater agonistic activity and IFN signaling induced by resiquimod than imiquimod. Additionally, there is a possibility that sensitivity to TLR agonists may be a feature of ZRSR2-mutant BPDCN.
Since our findings indicate that IFN signaling confers protection against GSK595-induced apoptosis, BPDCN with splicing factor mutations may be more sensitive to PRMT5 inhibition due to the cumulative suppression of IRF7 expression and IFN signaling resulting from both PRMT5 inhibition and splicing factor mutations. Likewise, malignancies with splicing factor mutations were reported to be more susceptible to splicing factor inhibitors.51 Therefore, PRMT5 inhibition may be generally effective against BPDCN with splicing factor mutations, irrespective of the METTL3 expression status.
Signaling pathway dysregulation in BPDCN is also of interest in the context of PRMT5 inhibition. The NF-κB pathway was reported to be aberrantly activated in BPDCN.52 PRMT5 inhibition may counteract NF-κB pathway activation as PRMT5 has a role in facilitating NF-κB activity via dimethylation of the p65 subunit of NF-κB.53 Apart from monotherapy, drug combination strategies that target different mechanisms may yield synergistic effects against BPDCN. Inhibition of the bromodomain and extra terminal protein BRD4 is a potential choice for combination therapy as its mechanism of action in BPDCN (disruption of the TCF4 transcriptional network that is essential for BPDCN54 ) appears to be distinct from that of PRMT5 inhibition.
BPDCN patients often present with skin lesions, and disease progression can involve other sites like bone marrow, spleen, and the central nervous system (CNS),55 highlighting the importance of future therapies to be able to penetrate the CNS in order to have optimal therapeutic outcomes. The PRMT5 tool compound GSK3203591 has been shown to penetrate the blood–brain barrier and suppress the growth of glioblastoma.56 In addition, 4-second generation PRMT5 inhibitors have also been reported to efficiently curb GBM tumor growth in zebrafish with intracranial tumors.55 These studies suggest that PRMT5 inhibition has the potential to treat BPDCN with CNS involvement. Therefore, follow-up studies on PRMT5 inhibitors in BPDCN should confirm the ability of PRMT5 inhibitors to target BPDCN in the CNS.
In conclusion, our findings highlight the potential relevance of RNA methylation status in the treatment of BPDCN and justify further investigation of the use of PRMT5 inhibitors in treating BPDCN patients. Specifically, subsequent studies should focus on identifying BPDCN subsets that are most susceptible to PRMT5 inhibition.
Acknowledgments
The authors thank Takayoshi Matsumura (CSI-NUS, Singapore) for additional RNA-sequencing analyses.
This study was supported by the Singapore Ministry of Health’s National Medical Research Council STaR Investigator Award, granted to T. Suda (NMRC/STaR/024/2019).
Authorship
Contribution: M.R., D.Q.T., and T. Suda conceptualized and designed the research; M.R. performed experiments, analyzed and interpreted data, and wrote the manuscript; D.Q.T. performed experiments, interpreted data, and critically revised the manuscript; S.H.T. contributed essential materials, interpreted data, and revised the manuscript; R.Y., J.L., Y.L., and H.Y. performed key bioinformatical analyses; T. Sanda critically revised the manuscript; T. Suda supervised the research, acquired funding, and revised the manuscript; and all authors approved the final version of the manuscript for submission.
Conflicts-of-interest disclosure: The authors declare no competing financial interests.
Correspondence: Toshio Suda, Cancer Science Institute of Singapore, National University of Singapore, Singapore; e-mail: csits@nus.edu.sg.

