

Key Points
High surface IgM expression associates with shorter time to new treatment following ibrutinib therapy.
Cells with high surface IgM expression retain residual signaling capacity downstream of BTK during ibrutinib therapy.

Abstract
Chronic lymphocytic leukemia (CLL) cells have variably low surface IgM (sIgM) levels/signaling capacity, influenced by chronic antigen engagement at tissue sites. Within these low levels, CLL with relatively high sIgM (CLLhigh) progresses more rapidly than CLL with low sIgM (CLLlow). During ibrutinib therapy, surviving CLL cells redistribute into the peripheral blood and can recover sIgM expression. Return of CLL cells to tissue may eventually recur, where cells with high sIgM could promote tumor growth. We analyzed time to new treatment (TTNT) following ibrutinib in 70 patients with CLL (median follow-up of 66 months) and correlated it with pretreatment sIgM levels and signaling characteristics. Pretreatment sIgM levels correlated with signaling capacity, as measured by intracellular Ca2+ mobilization (iCa2+), in vitro (r = 0.70; P < .0001). High sIgM levels/signaling strongly correlated with short TTNT (P < .05), and 36% of patients with CLLhigh vs 8% of patients with CLLlow progressed to require a new treatment. In vitro, capacity of ibrutinib to inhibit sIgM-mediated signaling inversely correlated with pretherapy sIgM levels (r = −0.68; P = .01) or iCa2+ (r = −0.71; P = .009). In patients, sIgM-mediated iCa2+ and ERK phosphorylation levels were reduced by ibrutinib therapy but not abolished. The residual signaling capacity downstream of BTK was associated with high expression of sIgM, whereas it was minimal when sIgM expression was low (P < .05). These results suggested that high sIgM levels facilitated CLL cell resistance to ibrutinib in patients. The CLL cells, surviving in the periphery with high sIgM expression, include a dangerous fraction that is able to migrate to tissue and receive proliferative stimuli, which may require targeting by combined approaches.
Introduction
The B-cell receptor (BCR) can define B-cell fate via antigen-induced and antigen-independent (constitutive) signals.1 BCR signaling is also key to survival and proliferation of chronic lymphocytic leukemia (CLL) cells,2-4 in which BCR-associated kinase inhibitors appear very effective.5 In CLL, clinical use is skewed toward Bruton's tyrosine kinase (BTK) pathway inhibitors (BTKi), among which ibrutinib has been the first-in-kind BTKi to rapidly shift medical algorithms away from chemotherapy.6-8
CLL cells have variably low surface immunoglobulin (sIgM) levels and recover expression in vitro, indicating that chronic antigen engagement is occurring at tissue sites.9-11 The variable levels associate with signal strength, with a balance toward anergy when sIgM is low or proliferation when sIgM is high.2,3,4 Levels and signaling capacity are typically higher in the subset with unmutated (U) Ig gene heavy-chain variable regions (IGHV), of pregerminal center CD5+ B-cell origin and poor prognosis, than in the subset with mutated (M) IGHV, of postgerminal center CD5+ B-cell origin and generally good prognosis.12-16 However, sIgM levels/signaling vary within U-CLL and M-CLL, and this variability further informs natural propensity for disease progression.17
By irreversibly binding BTK at C481 and causing inhibition of downstream events,18,19 ibrutinib leads to rapid redistribution of CLL cells from lymph nodes into the peripheral blood. While the redistribution is likely due to inhibition of migration more than adhesion,20,21 the circulating CLL cells have a selective recovery of sIgM levels and proximal function, consequent to release from tissue-based antigen drive.10,11,24 Suspension of ibrutinib can reverse the redistribution of CLL cells back to tissue sites, often leading to nodal disease progression and more aggressive disease, particularly if discontinuation occurs early, suggesting specific environmental requirements for disease resistance.25-28
Occurrence of genetic lesions, including mutations of the BCR-associated kinases BTK and PLCγ2, have been frequently documented in the CLL cells of patients who develop resistance to ibrutinib and rapidly progress.29,30 However, these mutations are subclonal,30-38 and appear insufficient to keep the signaling pathway active unless there is also sIgM engagement,29 suggesting that environmental stimuli through sIgM are also necessary for evasion from ibrutinib. Conceivably, we have hypothesized that levels of sIgM would affect signaling strength and that this would ultimately have clinical consequences on response to ibrutinib.24
In this study, we observed that high pretherapy sIgM levels associate with short duration of response to ibrutinib and with incomplete inhibition of intracellular calcium mobilization (iCa2+) and ERK1/2 phosphorylation (pERK) downstream to fully inhibited BTK. At this stage, BTK/PLCγ2 lesions were not evident. The surviving cells with high sIgM recovered constitutive AKT phosphorylation, potentially keeping the cells ready to become resistant to ibrutinib.
Material and methods
Patients’ characteristics and ibrutinib treatment
Seventy patients participating in the “real-world” observational study at the University of Southampton (NIHR/UKCRN ID: 31076) were investigated. Diagnosis of CLL was according to the 2008 International Workshop on Chronic Lymphocytic Leukemia (IWCLL2008)/National Cancer Institute (NCI) criteria.39 Diagnoses were confirmed by a flow cytometry “Matutes score” > 3 in all cases.
Phenotypic (CD38, CD49d, and ZAP70 expression), immunogenetic (tumor IGHV usage and mutational status), fluorescence in situ hybridization (FISH) characteristics according to Dohner classification, and TP53 mutational status were determined pretreatment (baseline), as previously described.17,40 -43 Patients received ibrutinib once daily (starting at 420 mg dose) until toxicity and/or disease progression. Peripheral blood mononuclear cells (PBMCs) from patients with CLL were isolated prior to and during ibrutinib therapy by density gradient centrifugation and cryopreserved as previously described.10,24 Blood was taken no later than 2 hours after dosing.
The study was approved by the Institutional Review Boards at the University of Southampton (REC: H228/02/t). All patients provided written informed consent.
Cell preparation and immunophenotypic characterization of CLL sIgM
After thawing, PBMCs were allowed to recover for 1 hour at 37°C in RPMI-1640 medium (Sigma Aldrich) supplemented with 10% fetal bovine serum, 2 mM glutamine, and 1% penicillin/streptomycin, as described.24 For clinical correlation studies, viable PBMCs were stained in fluorescence-activated cell sorting (FACS) buffer (1% bovine serum albumin, 4mM ethylenediaminetetraacetic acid, and 0.15mM NaN3 in phosphate-buffered saline) for 30 minutes on ice with the following antibodies: PE-conjugated anti-IgM rabbit F(ab′)2 (Dako, Agilent Technologies), PE-conjugated or PerCP/Cy5.5-conjugated anti-CD5 (UCHT2), APC-conjugated or Pacific Blue-conjugated anti-CD19 (HIB19) (all from Biolegend), and corresponding controls. Cells were then washed, and data were acquired using a FACSCalibur (BD).10,17 For functional assays, PE-conjugated anti-IgM (MHM-88, Biolegend) and a FACSCanto (BD) were used. The analysis of marker expression, reported as mean fluorescence intensity (MFI), was performed on the CD19+/CD5+ tumor population using FlowJo software.
CLL cell stimulation, intracellular signaling analysis, and in vitro ibrutinib treatment
Anti-IgM–induced signaling capacity was measured by intracellular calcium (iCa2+) mobilization and immunoblotting. The iCa2+ mobilization assay was performed using our previously described methods.17 Briefly, cells were incubated with 4 µM of Fluo3-AM (Life Technologies) and 0.02% (vol/vol) Pluronic F-127 (Sigma Aldrich) for 30 minutes at 37°C. Cells were then washed in medium, and data were acquired by flow cytometry. The signal from unstimulated cells was recorded for 30 seconds before addition of polyclonal goat F(ab′)2 anti-human IgM (20 µg/mL, Southern Biotech). The percentage of IgM-mediated iCa2+ mobilization was calculated as peak percentage of cells responding to the stimulation (increase in fluorescent intensity above the set threshold measured on unstimulated cells) and normalized to the percentage of B cells in the lymophocyte population. In the text and figures, the term “sIgM iCa2+” has been used to indicate the percentage of responding cells to anti-IgM induced iCa2+ mobilization.
For immunoblotting, viable PBMCs were stimulated with polyclonal goat F(ab′)2 anti-human IgM or soluble polyclonal control (20 µg/mL; Southern Biotech) at 37°C for 10 minutes or left untreated. Cells were then lysed in RIPA buffer, and equal amounts of proteins were resolved by SDS-PAGE and transferred to nitrocellulose membranes, as previously described.24 Membrane staining with the primary antibodies anti-phosphoERK1/2 (Thr202/Tyr204), anti-ERK1/2, anti-phosphoAKT (Ser473), anti-AKT, anti-phosphoBTK (Y223), anti-BTK, anti-phosphoPLCγ2 (Y1217), anti-PLCγ2 (all from Cell Signaling Technology), and anti-GAPDH (Ambion) was followed by incubation with the appropriate anti-mouse or anti-rabbit horseradish peroxidase-conjugated secondary antibody (Dako). Imaging was performed using chemiluminescence reagents (Pierce ECL and SuperSignal West Femto, Thermo Scientific) and the ChemiDoc-It imaging system (UVP). The optical density of the bands was quantified using the ImageJ software. Protein phosphorylation of each sample was measured as the ratio between phospho-protein optical density and total-protein optical density (phospho/total) for each condition. “Inducibility” was defined as the ratio of induced/basal phosphoprotein levels at each time point, as previously described.24 When specified, CLL cells were treated in vitro with 10 µM of ibrutinib (Selleckchem) for 1 hour at 37°C before signaling analysis.
Analysis of BTK and PLCγ2 mutational status
BTK and PLCγ2 mutations were determined using custom assays with the NexteraXT kit (Illumina) for sequencing on the MiSeq platform or for long-read sequencing on the GridION (Oxford Nanopore Technologies) at the WISH laboratory, University of Southampton and validated at the Karolinska Institutet, Stockholm. DNA was extracted using the Qiagen miniprep kit (Qiagen) and diluted to 20 ng/µL. A multiplex polymerase chain reaction consisting of 4 assays with primers designed to amplify the mutational hotspots in BTK codon 481 and PLCγ2 codons 665, 707, and 848 was performed. Primers were designed using the Primer3 software (4.1.0) (supplemental Table 1). Amplified DNA was diluted and processed using either the NexteraXT kit (Illumina) or Amplicon barcoding kit SQK-AMB111.12 (Oxford Nanopore Technologies), according to manufacturer’s instructions. Libraries were quantified using Qubit High Sensitivity reagents (Thermo Fisher) and Agilent Bioanalyser 2100 high sensitivity DNA chips (Agilent). For Illumina sequencing, an equimolar pool of 57 samples at 4 nm was prepared and loaded into a 500-cycle Miseq Reagent kit v2 (Illumina). The fastq files generated by the MiSeq were manipulated using the Illumina BaseSpace Labs FASTQ Toolkit to remove adapter sequences and small-read sequences (<32 bp). The BaseSpace Labs BWA aligner was used to create a BAM file. For Nanopore sequencing data, samples were split into 2 pools at 120 ng to be prepared, barcoded, and loaded onto an R9.4.1 flow cell. The raw fast5 data were basecalled and demultiplexed via guppy, and minimap2 was used for alignment to a reference genome to create the BAM files. The BAM files from both sequencing pathways were manually curated in the Integrative Genomics Viewer 44 for the presence/absence of variants.
Statistical analysis
Survival curves were analyzed by Kaplan-Meier log-rank statistics. Time to progression requiring a new treatment from ibrutinib start (TTNT) was defined according to the 2018 iwCLL guidelines,39 and was used as the primary endpoint. Fisher’s exact test was used for categorical variables, Wilcoxon-signed rank, or Mann-Whitney nonparametric tests were used for continuous variables. The statistical correlations were performed by nonparametric Spearman’s rank test. All statistical tests were 2-sided. Statistical significance was defined as P < .05. Analyses were performed using the Statistical Package for the Social Sciences (SPSS) software or Graphpad Prism 8 software.
Results
Characteristics of the cohort of patients with CLL
Patients undergoing treatment with ibrutinib single agent (n = 70) were studied for clinical, phenotypic, and functional outcome. The general characteristics of the patients are described in supplemental Table 2. The median age was 71 years (range, 51-84), and median number of prior therapies was 1 (range, 0-6). Eighteen patients progressed, 9 while on ibrutinib and 9 after ibrutinib discontinuation. SIgM levels and signaling capacity were measured by flow cytometry before start of ibrutinib. Median sIgM levels before ibrutinib start were 65 (5th-95th percentile, 9-610) and median sIgM iCa2+ was 47% (5th-95th percentile, 5-99). The majority of these patients had U-CLL (69%). The sIgM levels and iCa2+ distinguished this cohort from a cohort of U-CLL and M-CLL at diagnosis because they showed features associated with aggressive disease.17 In fact, while sIgM levels and iCa2+ are higher in U-CLL than M-CLL at diagnosis (P < .001),17 the pre-ibrutinib sIgM levels and iCa2+ analyzed in this cohort at CLL progression were high and not different between U-CLL and M-CLL and significantly higher than at diagnosis in M-CLL (supplemental Figure 1A-B). These data are consistent with features of the aggressive subsets within U-CLL and M-CLL, which have progressed to require treatment.17
High sIgM levels associate with signaling capacity and shorter time to a new treatment following ibrutinib
Pre-ibrutinib sIgM levels correlated with sIgM iCa2+ (r=0.70; P < .0001) (supplemental Figure 1C), reinforcing our previous findings.10 We used our previously established MFI cutoff of 50 to define CLL with high sIgM (CLLhigh) or low sIgM (CLLlow)17 to perform correlations with the clinical characteristics and outcome of these patients. The MFI of 50 also appeared the best cutoff using receiver operating characteristic (ROC) and Youden’s t test when a new treatment following ibrutinib was used as a state variable. Supplemental Table 2 describes the clinical characteristics of CLLhigh and CLLlow. CLLhigh had higher sIgM iCa2+ than CLLlow (P = .0001). All patients developed a lymphocytosis and had at least a partial response. No significantly different kinetics of the lymphocytosis were observed in the peripheral blood between CLLhigh and CLLlow during ibrutinib (supplemental Figure 2).
Univariate analysis of serum biochemistry, clinical, phenotypic, FISH, and immunogenetic characteristics for TTNT is represented in Table 1. We found that high sIgM levels associated with a shorter TTNT (P = .008; Figure 1A). With a median follow-up of 66 months (95% CI, 59-71), only 2/26 (8%) CLLlow had progressed (median TTNT not reached) compared with 16/44 (36%) CLLhigh. Also, sIgM iCa2+ was associated with a shorter time to progression (P = .022; Figure 1B). However, sIgM levels were a more significant factor than signaling, and the cutoff that best discriminated CLL that received a new treatment from CLL that did not was particularly high (39% iCa2+ using ROC and Youden’s t test). This suggested that a strong signaling capacity is required to circumvent BTK blockade in patients. Conversely, U-IGHV, B2M, LDH, CD38, ZAP-70, CD49d, or TP53 status did not associate with significantly different TTNT in this series.
Univariate analysis of time to next treatment in patients with CLL who are on ibrutinib
| Parameter | Status | Total | Events | % | Mean | SE | 95% CI | P |
|---|---|---|---|---|---|---|---|---|
| sIgM MFI | Low | 26 | 2 | 92 | 76.5 | 2.3 | 72.1-80.9 | .008 |
| High | 44 | 16 | 63 | 58.1 | 4.3 | 49.6-66.6 | ||
| sIgM iCa2+ | Low | 31 | 4 | 87 | 73.2 | 3.2 | 70.0-79.3 | .022 |
| High | 39 | 14 | 63 | 57.9 | 4.7 | 48.8-67.1 | ||
| IGHV status | Mutated | 21 | 3 | 86 | 70.5 | 5 | 60.5-80.4 | .296 |
| Unmutated | 48 | 14 | 71 | 63.4 | 3.8 | 56.0-70.7 | ||
| B2M | Low | 39 | 14 | 64 | 58.9 | 4.5 | 50.1-67.6 | .084 |
| High | 16 | 2 | 88 | 72.4 | 5.1 | 62.4-82.4 | ||
| LDH | Low | 56 | 14 | 75 | 66.0 | 3.2 | 59.7-72.4 | .69 |
| High | 12 | 3 | 75 | 62.9 | 8.5 | 46.2-79.6 | ||
| CD38 | <30% | 38 | 9 | 76 | 64.8 | 4.3 | 56.4-73.1 | .907 |
| ≥30% | 30 | 9 | 70 | 63.8 | 4.7 | 54.6-73.0 | ||
| ZAP70 | <20% | 43 | 13 | 70 | 62.0 | 4.1 | 53.9-70.1 | .342 |
| ≥20% | 24 | 5 | 79 | 68.1 | 4.8 | 58.7-70.5 | ||
| CD49d | <30% | 27 | 11 | 59 | 58.8 | 5.1 | 48.8-68.7 | .071 |
| ≥30% | 36 | 6 | 83 | 70.1 | 3.7 | 62.8-77.3 | ||
| 17p13/TP53 | Wt | 61 | 15 | 76 | 66.2 | 3.2 | 59.8-72.5 | .099 |
| Mut/del | 9 | 3 | 67 | 57.4 | 8.1 | 41.6-73.2 |
Wt, wild type; Mut/del, mutated and/or deleted.
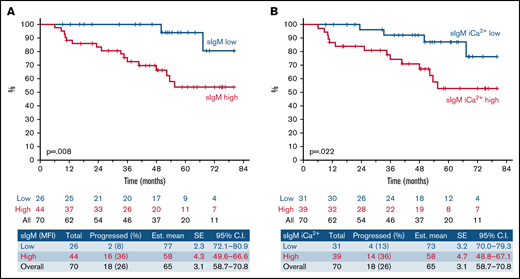
High sIgM levels or signaling capacity associates with shorter TTNT following ibrutinib therapy. SIgM levels and signaling capacity were measured by flow cytometry before start of ibrutinib. (A) Patients with sIgM MFI > 50 (red line) and sIgM MFI < 50 (blue line) were investigated for time to progression requiring a new treatment from ibrutinib start (TTNT). (B) Patients with high sIgM iCa2+ (red line, >39% iCa2+ using ROC and Youden’s t test) and low signaling (blue line, <39% iCa2+) were also investigated for TTNT. The y-axis (%) indicates the cumulative proportion of patients surviving without having progressed to a new treatment need. Cumulative survival analysis was performed by Kaplan-Meier algorithm using log-rank statistics.
High sIgM levels or signaling capacity associates with shorter TTNT following ibrutinib therapy. SIgM levels and signaling capacity were measured by flow cytometry before start of ibrutinib. (A) Patients with sIgM MFI > 50 (red line) and sIgM MFI < 50 (blue line) were investigated for time to progression requiring a new treatment from ibrutinib start (TTNT). (B) Patients with high sIgM iCa2+ (red line, >39% iCa2+ using ROC and Youden’s t test) and low signaling (blue line, <39% iCa2+) were also investigated for TTNT. The y-axis (%) indicates the cumulative proportion of patients surviving without having progressed to a new treatment need. Cumulative survival analysis was performed by Kaplan-Meier algorithm using log-rank statistics.
These data revealed a critical link between pretherapy sIgM levels or sIgM iCa2+ and the duration of response to ibrutinib.
In vitro ibrutinib inhibition of BTK downstream signals inversely correlate with pretherapy sIgM levels and sIgM iCa2+ mobilization
At the doses of ibrutinib given to patients with CLL, there was complete BTK inhibition in both CLLhigh and CLLlow samples.24 Hence, an in vitro dose (10 µM) that completely inhibits BTK and potentially other anti-IgM–induced kinases45 was used to investigate the effect of ibrutinib on sIgM iCa2+ (downstream of BTK) in 13 samples collected before therapy. SIgM iCa2+ was significantly reduced in the presence of ibrutinib (P = .0002; Figure 2A). However, the reduction was variable, ranging from 3% to 100%. The percent iCa2+ reduction was inversely correlated with pretreatment sIgM levels (r = −0.68; P = .01) and iCa2+ (r = −0.71; P = .009; Figure 2B-C). These data indicated that sIgM levels and signaling capacity influenced the effects of ibrutinib in vitro and prompted us to investigate this also in patients during therapy.

SIgM levels/signaling capacity inversely correlate with signaling inhibition by ibrutinib in vitro. CLL cells taken before ibrutinib therapy start were treated with 10 µM of ibrutinib in vitro (n = 13). Red symbols represent U-CLL; blue symbols represent M-CLL; the green triangle represents a IGHV3-21 M-CLL case. (A) SIgM-mediated iCa2+ mobilization was measured by flow cytometry. Non treated cells (NT) were incubated with DMSO as a control. (B-C) Correlation between percent signaling inhibition by ibrutinib in vitro and sIgM MFI (B) or sIgM signaling capacity (iCa2+ mobilization) (C) measured prior to ibrutinib treatment. Case 495 (IGHV3-21 M-CLL) was excluded from the graphs for better visualization of the correlation. Analysis and Spearman correlation were performed on all 13 cases.
SIgM levels/signaling capacity inversely correlate with signaling inhibition by ibrutinib in vitro. CLL cells taken before ibrutinib therapy start were treated with 10 µM of ibrutinib in vitro (n = 13). Red symbols represent U-CLL; blue symbols represent M-CLL; the green triangle represents a IGHV3-21 M-CLL case. (A) SIgM-mediated iCa2+ mobilization was measured by flow cytometry. Non treated cells (NT) were incubated with DMSO as a control. (B-C) Correlation between percent signaling inhibition by ibrutinib in vitro and sIgM MFI (B) or sIgM signaling capacity (iCa2+ mobilization) (C) measured prior to ibrutinib treatment. Case 495 (IGHV3-21 M-CLL) was excluded from the graphs for better visualization of the correlation. Analysis and Spearman correlation were performed on all 13 cases.
High sIgM levels associate with residual BCR-mediated signaling downstream of BTK in patients on ibrutinib
We had previously observed that levels of functional sIgM were selectively maintained or increased during ibrutinib therapy in patients.24 In this study, we assessed the effect of anti-IgM induced iCa2+ and pERK during ibrutinib therapy in 18 patients, including 12 previously investigated.24 This cohort included 10 CLLhigh and 8 CLLlow. All lacked BTK or PLCγ2 mutations (supplemental Figure 3) and had complete pBTK (Y223) inhibition by ibrutinib at the time points investigated (supplemental Figure 4).24 PLCγ2 phosphorylation at site Y1217 also appeared inhibited in 5/5 cases investigated (supplemental Figure 4).
SIgM iCa2+ and pERK reduced significantly during ibrutinib therapy compared with pre-ibrutinib (Figure 3; supplemental Figure 5). However, neither iCa2+ nor pERK were completely abolished, and the degree of inhibition was variable between individuals. Hence, we investigated if pre-ibrutinib sIgM levels of CLLhigh vs CLLlow informed on different residual activity downstream of BTK during ibrutinib. Anti-IgM–induced iCa2+ and pERK were inhibited less in CLLhigh than CLLlow at all time-points (Figure 4; P < .05 in all cases). When sIgM levels were measured at the individual time points investigated during therapy, the association with the induced iCa2+ and pERK remained significant (supplemental Figure 6), confirming that the expressed sIgM remained functional during therapy.
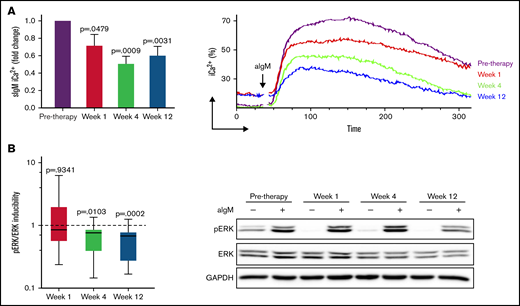
Anti-IgM induced signaling is reduced during ibrutinib therapy. CLL cells taken before and at weeks 1, 4, and 12 of ibrutinib therapy were stimulated with anti-IgM, and signaling was measured by flow cytometry or immunoblotting. (A) Intracellular iCa2+ mobilization at different time points of therapy is shown as fold change relative to pretherapy (n = 15) (left). Pretherapy values were set to 1. Mean + SEM is shown. Representative plot showing reduced but maintained iCa2+ during ibrutinib in a patient with CLL with high sIgM levels (right). (B) pERK/ERK inducibility was measured as aIgM/basal pERK/ERK at each time point of therapy in 15 patients with CLL and is shown as fold change relative to pretherapy (pretherapy inducibility was set to 1) (left). Representative immunoblot showing persistence of ERK phosphorylation during therapy (right). P values at each time-point in both panels are relative to pretherapy values.
Anti-IgM induced signaling is reduced during ibrutinib therapy. CLL cells taken before and at weeks 1, 4, and 12 of ibrutinib therapy were stimulated with anti-IgM, and signaling was measured by flow cytometry or immunoblotting. (A) Intracellular iCa2+ mobilization at different time points of therapy is shown as fold change relative to pretherapy (n = 15) (left). Pretherapy values were set to 1. Mean + SEM is shown. Representative plot showing reduced but maintained iCa2+ during ibrutinib in a patient with CLL with high sIgM levels (right). (B) pERK/ERK inducibility was measured as aIgM/basal pERK/ERK at each time point of therapy in 15 patients with CLL and is shown as fold change relative to pretherapy (pretherapy inducibility was set to 1) (left). Representative immunoblot showing persistence of ERK phosphorylation during therapy (right). P values at each time-point in both panels are relative to pretherapy values.

High sIgM expression before therapy associates with residual signaling capacity downstream of BTK during ibrutinib. Residual anti-IgM–induced signaling capacity was measured by flow cytometry (sIgM iCa2+) (A) and immunoblotting (pERK inducibility) (B) in a total of 18 patients with CLL. Levels of sIgM were determined before start of ibrutinib therapy. The statistical difference was calculated using the Mann-Whitney U-test.
High sIgM expression before therapy associates with residual signaling capacity downstream of BTK during ibrutinib. Residual anti-IgM–induced signaling capacity was measured by flow cytometry (sIgM iCa2+) (A) and immunoblotting (pERK inducibility) (B) in a total of 18 patients with CLL. Levels of sIgM were determined before start of ibrutinib therapy. The statistical difference was calculated using the Mann-Whitney U-test.
Basal AKT phosphorylation increases during ibrutinib
Phosphorylation of AKT at S473 (pAKT) was investigated for changes on the PI3K/AKT pathway in the circulating cells of 13 CLL patients (6 CLLhigh and 7 CLLlow). Basal pAKT levels, although similar to pre-ibrutinib in the first week of therapy (P = .3), gradually increased at subsequent time points (P = .03 and P = .04; Figure 5A). Conversely, anti-IgM–induced pAKT was not reduced by ibrutinib therapy (Figure 5B), confirming little influence of ibrutinib on the induction of the PI3K/AKT pathway.
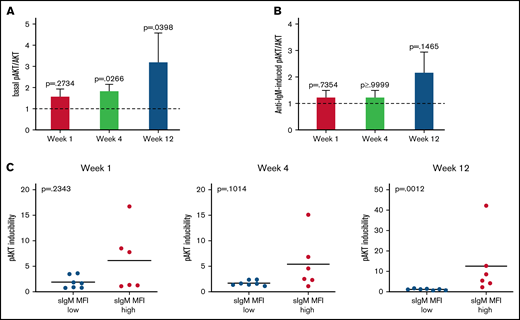
Basal AKT phosphorylation increases during ibrutinib. AKT basal and induced phosphorylation at S473 was analyzed by immunoblotting before and during therapy in a total of 13 patients with CLL. (A-B) Fold change relative to pre-therapy is shown (basal or anti-IgM–induced pAKT/AKT pretherapy values were set to 1). Bars show mean ±SEM. P values were calculated using the Wilcoxon rank test. (C) Association between inducibility of pAKT and sIgM expression is shown. Levels of sIgM were determined before start of ibrutinib therapy. The statistical difference was calculated using the Mann-Whitney U-test.
Basal AKT phosphorylation increases during ibrutinib. AKT basal and induced phosphorylation at S473 was analyzed by immunoblotting before and during therapy in a total of 13 patients with CLL. (A-B) Fold change relative to pre-therapy is shown (basal or anti-IgM–induced pAKT/AKT pretherapy values were set to 1). Bars show mean ±SEM. P values were calculated using the Wilcoxon rank test. (C) Association between inducibility of pAKT and sIgM expression is shown. Levels of sIgM were determined before start of ibrutinib therapy. The statistical difference was calculated using the Mann-Whitney U-test.
The increase of basal pAKT associated with the sIgM levels. In fact, the increase in pAKT inducibility was observed specifically in the CLLhigh and not in the CLLlow patients (Figure 5C). These data indicated that constitutive AKT activity increased with therapy duration, suggesting that the AKT pathway provided a signal, which was rescued by the tumor cells with high sIgM, to survive in the absence of antigen engagement.46
SIgM expression following discontinuation of ibrutinib therapy in patients with CLL
We have previously shown that sIgM levels increase in patients with CLL during ibrutinib therapy and that they are selectively maintained higher than pretherapy levels during therapy.24 Here, we looked at the dynamics of sIgM expression in 13 patients with CLL before and after discontinuation of ibrutinib therapy. Seven of the 13 patients had discontinued because of CLL progression, and 6 had discontinued ibrutinib because of cardiovascular complications (3 patients), second cancer, cognitive deterioration or infection, respectively.
Following ibrutinib discontinuation, sIgM levels increased significantly compared with pretherapy levels in patients with progressive disease. Instead, sIgM levels remained stable or dropped below pretherapy levels in patients who did not progress (Figure 6A). Only 1 out of 7 patients who progressed converted from CLLlow to CLLhigh, whereas the remaining 6 were already CLLhigh (Figure 6B). Conversely, none of 6 CLLlow converted to CLLhigh. These results suggest that high sIgM levels are selectively maintained or increased in patients who will have progressive disease.
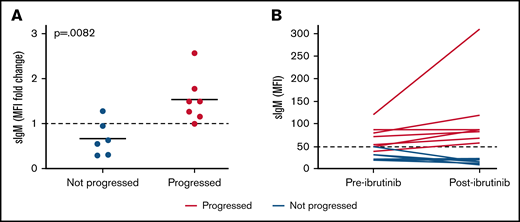
SIgM levels are selectively increased in patients who progress after ibrutinib therapy. Expression of sIgM was measured before therapy and after ibrutinib therapy discontinuation (n = 13). SIgM levels are shown as fold change relative to pretherapy set to 1 (A) and as MFI values (B). Red lines/dots represent progressed patients. Blue lines/dots represent patients who did not progress. The dashed line in panel B represents the cutoff used in this series to discriminate CLL with high and low sIgM expression. The statistical difference was calculated using the Mann-Whitney U-test.
SIgM levels are selectively increased in patients who progress after ibrutinib therapy. Expression of sIgM was measured before therapy and after ibrutinib therapy discontinuation (n = 13). SIgM levels are shown as fold change relative to pretherapy set to 1 (A) and as MFI values (B). Red lines/dots represent progressed patients. Blue lines/dots represent patients who did not progress. The dashed line in panel B represents the cutoff used in this series to discriminate CLL with high and low sIgM expression. The statistical difference was calculated using the Mann-Whitney U-test.
Discussion
In this study, we found that high sIgM levels are associated with more rapid progression following ibrutinib and confirmed that sIgM signaling strength depends on sIgM expression. SIgM levels and signaling capacity appear critical for CLL behavior, with a balance toward anergy and an indolent clinical course when sIgM is low or toward proliferation/growth and a more aggressive course when sIgM is high.17 We reinforce this concept in the specific context of ibrutinib therapy, demonstrating that high sIgM levels measured before treatment can inform the duration of response to therapy. Our data highlight the need of a high signaling threshold required to overcome BTK inhibition.
We found that BTK blockade by ibrutinib is bypassed with ERK activation and iCa2+ mobilization when sIgM-mediated signaling is high. Previous studies documented that BTK inhibition can be overcome when either mutations of BTK prevent ligation of ibrutinib to the binding pocket30 or when a hypertrophic signal is generated by anti-IgM in the presence of PLCγ2 mutations.29 Our cases had no evidence of BTK or PLCγ2 mutations at the time of the functional analyses, and the complete inhibition of BTK activity suggested full occupancy by ibrutinib. The only association remained with high sIgM-mediated signaling.
During ibrutinib therapy, sIgM function (measured by its ability to activate SYK, which is upstream to BTK) recovers with the level of expression.24 The accompanying iCa2+ mobilization and ERK phosphorylation indicate that the pathways downstream to BTK are also still operative. Residual iCa2+ mobilization has been observed in BTK-deficient X-linked hypogammaglobulinemia,47 and knocking out BTK in B cells does not abolish sIgM-mediated mobilization iCa2+.48 In these models, sIgM is not anergized, suggesting that a strong signal is required to overcome BTK deficiency or arrest.
Studies in vitro document that sIgM-mediated signaling to AKT and PKCδ operates via SYK in CLL, and this is unlikely to be affected by BTKi.49-51 Our data in patients show that the AKT pathway remains open for stimulation during ibrutinib therapy. However, they also document a gradual increase in basal pAKT. This observation is in line with studies in which constitutive AKT activity recovered in the tumor cells of patients receiving therapy.52 The PI3K/AKT pathway is central for the maintenance of tonic signals in resting tumor and normal B cells.51,53,54 In CLL, AKT activation promotes cell survival by induction of the anti-apoptotic Mcl-1, whereas basal AKT activation is sustained by SYK.51,55 AKT has also shown to be a regulator of cell cycle progression, and the intensity of AKT activation has been related to the proliferative response capacity in CLL.56 Here, we identify the AKT pathway as one of the possible routes for CLL cells counteracting BTK blockade during ibrutinib. In lymphoma, in which sIgM is high, inactivating lesions of BTK are accompanied by increased AKT activity,57 suggesting that AKT is a rescue pathway when BTK is not operative. Therefore, a combinatorial therapeutic approach with ibrutinib and AKT/PI3Ki might be required when sIgM is high.
While expression of sIgM was relatively low and stabilized in patients who did not progress, there was a further sIgM increase in patients who progressed and after ibrutinib therapy discontinuation. In the absence of ibrutinib, CLL cells will be exposed to tissue-based antigen again and subject to sIgM downmodulation by endocytosis.24 Thus, the sIgM increase identifies a heavily selected subpopulation with high sIgM expression that will incorporate those cells with high levels of CXCR4.58 This subgroup of cells is expected to be particularly dangerous, being therefore equipped to migrate to tissue and receive proliferative stimuli.58
These data provide the phenotypic and functional characteristics of the tumor CLL cells surviving ibrutinib therapy in patients. They set a rationale for the need for combinatorial therapeutic approaches to target these cells, which have been heavily selected and appear to carry more dangerous potentials than the tumor population existing prior to the start of single-agent ibrutinib.
Acknowledgments
The authors are grateful to the Faculty of Medicine Tissue Bank (Cancer Sciences, University of Southampton) for the processing and storage of the primary CLL specimens.
This work was funded by Blood Cancer UK (grant 18009), the Eyles Cancer Immunology Fellowship, Cancer Research UK (ECRIN-M3 accelerator award C42023/A29370, Southampton Experimental Cancer Medicine Centre grant C24563/A15581, Cancer Research UK Southampton Centre grant C34999/A18087, program C2750/A23669, and BTERP project C36811/A29101), and the Czech Science Foundation (20-02566S).
Authorship
Contribution: G.C. performed research, analyzed and interpreted data, and wrote the manuscript; S.D., L.O., I.S., L.d.R., I.T., and A.D. collected samples and acquired and analyzed data; E.A.M., O.B., and B.S. collected and analyzed clinical data; J.F., H.P., S.B., L.S., and L.-A.S. performed and interpreted the mutational status analysis; M.M., J.C.S., S.L., K.N.P., and P.G. contributed to the interpretation and discussion of the data; F.K.S. supervised research and interpreted data; F.F. designed the study, supervised research, analyzed and interpreted data and wrote the manuscript; and all authors reviewed and approved the manuscript.
Conflict-of-interest disclosure: The authors declare no competing financial interests.
Correspondence: Francesco Forconi, Cancer Sciences, University of Southampton, Cancer Research UK Centre, Somers Cancer Research Building, MP824, Southampton General Hospital, Southampton, SO16 6YD, UK; e-mail: f.forconi@soton.ac.uk.

